MRD:Hjc3917
This report has been plagiarised from here and here.
By Jessica Chung
Exercise 1: H and H2 system
Dynamics on a Potential Energy Surface Diagram
How the transition state is mathematically defined on a potential energy surface diagram. How the transition state can be identified, and how it can be distinguished from a local minimum of the potential energy surface:
The saddle point on a potential energy diagram represents the transition state (TS). The first partial derivative of the potential with respect to the two intermolecular distances should equal 0. To confirm that the r values represent the saddle point, you calculate the second derivative of r1 multiplied by the second derivative of r2, subtracting from this the second derivative of r1 and r2. If this equation produces a value of less than 0, then the saddle point has been identified.
At a TS or a minimum, the first derivative of r1 and r2 will be equal to zero. So to find the minimum, the second derivative equation discussed before will equal more than 0, rather than less.
Parameters set:
AB distance = r1
BC distance = r2
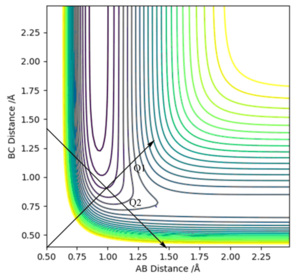
The transition state is mathematically defined as the maximum point along a minimum energy pathway on a potential energy surface diagram. The maximum along the minimum energy trajectory can be seen in Figure 1.1. Mathematically defined as a saddle point - a local minimum in one direction but a local maximum in a direction orthogonal to this direction - taking a first derivative of the inflection point of the reaction path, ∂V('r1)/∂r1 and ∂V(r2)/∂r2 will result in 0 for both derivatives, indicating a turning point. Taking the second derivative to the inflection point of the orthogonal vector derivative of q1 and q2 ca distinguish this from a local minimum point, where q1 and q2 are vectors positioned diagonally to r1 and r2. The second partial derivatives relative to these values provide more information of the transition state point. Whilst one derivative result indicates a maximum point, the derivative in the orthogonal direction will indicate the minimum point of ∂V(q1)/∂q1 <0 and ∂V(q2)/∂q2 >0. One direction of the second derivative (positive result) will indicate the minimum, whilst the other derivative will indicate a maximum point (negative), the latter of which is the saddle point.
Estimate of the transition state position (rts), with reasoning to illustrate it with a “Internuclear Distances vs Time” plot for a relevant trajectory:
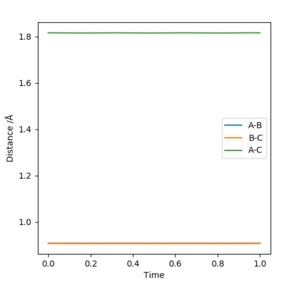
The intermolecular transition state position can be found through use of an intermolecular distance vs time graph, as seen in Figure 2. In setting the momentum to zero, and identifying r1 = r2, a value of 0.9078 Å was found to produce a system in which no oscillation was observed (since the transition state will exist with no oscillations).
Reaction Path Trajectories using MEP and Dynamic Calculations:
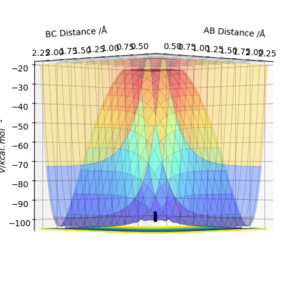
Figures 3.1 and 3.2, using parameters r1 = 0.9078 Å (transition distance), r2 = 0.9088 Å and p1 = p2 = 0, show the PES using Dynamic and MEP calculation types, respectively. Running this trajectory calculation yield graphically different results.
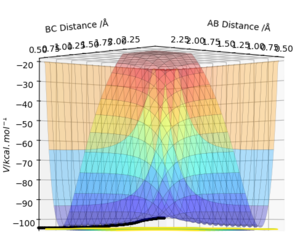
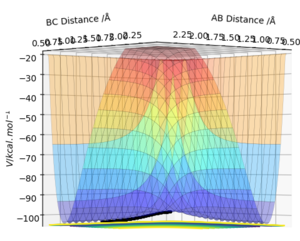
The Minimum Energy Pathway (MEP) is the lowest energy pathway from reactant to product. Since the calculation assumes the atoms have no mass, the reaction trajectory runs along the minimum with no oscillations - it does not realistically demonstrate the atoms' motion. Therefore, their motion will be considered inertial. On the contrary, the dynamic calculation demonstrates oscillations along the minimum energy trajectory. This is because dynamic calculations treat the system as a diatomic and atom, therefore, the diatomic has vibrational energy and oscillations. While MEP treats the species as two solids colliding, so there is no vibrational energy. The differences in appearance can be explained using a sphere rolling on a potential energy surface analogy. The MEP takes readings at infinitesimally small speeds, hence the sphere does not acknowledge or take into account previous momenta. Hence, the absence of momentum to roll up the potential energy surface results in the non-oscillating, straight line trajectory.
In contrast, the sphere associated with the dynamic calculation is aware of the momentum obtained from previous movements starting higher on the potential energy surface. Therefore, once the minimum point is reached, the sphere is able to slightly roll up the opposite surface, leading to the observed oscillating trajectory.
Table demonstrating the un/reactive trajectories, with accompanying plots and descriptions of what happens along the trajectories:
Conclusions Drawn:
From the table it can be seen that the total energy from the reaction is not the only factor that signifies whether or not a reaction will take place. Higher values of momenta (and hence total energy) do not necessarily always result in reactivity. Not all the trajectories starting with the same positions with larger momenta values than those from previous successful collisions will lead to another successful collision reaction. Whilst having enough kinetic energy to overcome the activation barrier is an essential requirement, other conditions must be satisfied for this success to occur. These factors include the ratio of the contribution of vibrational and translational energy on the overall total energy, where a higher vibrational energy would newly formed bonds to break.
The main assumptions of Transition State Theory, with obtained results. An explanation of how Transition State Theory predictions for the reaction rate values compare with experimental values:
Transition State Theory (TST) describes how a reaction occurs, by specifically monitoring the transitions in the reaction pathway from products to reactants. The main assumption of the Transition State Theory is the Born-Oppenheimer approximation, which states that since nuclei are much heavier than electrons (roughly 1800 times), they can be considered as molecules moving separately. From Ψ = Ψelec x Ψnuc, the atoms can be classically treated separately. Another assumption is that the reactants must collide with enough energy to overcome the TS energy barrier. Nevertheless, the tunnelling process of electrons has not been taken account in either of the assumptions. For light atoms, including hydrogens, particles lie in energy levels which are higher than the bottom of the potential energy wells, enabling particles to tunnel through the barrier. The cumulative quantum effects reduce the energy barrier required for the reaction to take place, which would lead to the TST predicting a rate constant lower than the experimental. This is because more collisions are enabled to occur with enough energy: kpred < kexp.
From the TST, the rate constant k of a reaction is predicted. However, the theoretical prediction may fall short due to some limitations TST has when it comes to predicting rate constants.
The TST also assumes that when the molecule has gained enough energy to overcome the TS barrier, the formation of the products is possible. This may not necessarily be reflected in reality, as seen in the last two trajectories in the table, which is due to high vibrational energy of the molecule.
Moreover, when the products and reactants are not in equilibrium, the transition states that are becoming products are distributed among all the states, Maxwell-Boltzmann laws (from the Hammond's postulate which states that: "If two states, as, for example, a transition state and an unstable intermediate, occur consecutively during a reaction process and have nearly the same energy content, their interconversion will involve only a small reorganization of the molecular structures.")
A further assumption is that, even in the absence of an equilibrium between reactant and product molecules, the TS that are becoming products are seen to distribute among their states in accordance with the Maxwell-Boltzmann laws.
The first three trajectories are likely to obey the TST, enabling the reaction rate to be be predicted. The products are formed upon overcoming the activation barrier. Conversely, the last two systems, do not necessarily indicate that the mean product formation occurs immediately, despite the reactants overcoming the activation energy barrier. Evidence of this is provided in the fourth trajectory, where although the reactants have sufficient energy, the large vibrational energy of the products results in the dissociation back to the reactant molecules. From the fifth trajectory, barrier recrossing of the molecule is seen; this is neither allowed nor predicted by TST. These latter cases exemplify when the TST predictions do not properly align with the experimental values, because the assumption is established as molecular systems being unable to return to form the reactant molecules once the product has formed.
Exercise 2: H and H2 system
Potential energy surface inspection, to classify the F + H2 and H + HF reactions according to their energetics (endothermic or exothermic). Identifying how this relates to the bond strength of the chemical species involved:
The parameters used are:
Atom A = H, B = H and C = F. The AB distance = 0.74 Å, BC = 2.3 Å and a momentum of -2.7 kg m/ s.
One one hand, the F + H2 reaction is exothermic as the reactant energies i.e. an atom of F and H2 molecule are higher than the product energies on the potential energy surface graph. Hence, an endothermic reaction indicates that reactant bond strength is greater than product bond strength and an exothermic reaction indicates that reactant bond strength is weaker than product bond strength, as more energy has been released upon formation of the stronger product bond than was inputted to break the weaker reactant bond. On the other hand, in the case of HF + H, the reaction is endothermic as the reactants are lower in energy than the products, thus the reaction proceeds in a downhill direction.
Figure 3.1 exemplifies that H2 + F is exothermic, since it can be observed that the product channel, HF (BC), is lower in energy than the reactant channel, H2 (AB), leading to energy being released from the system. This can be justified by looking at relative bond strength, because the HF bond (565 KJ/mol) is much stronger than H2 (432 KJ/mol), resulting in energy release. This difference in bond strength is from the larger electronegativity difference in HF, to form a more polar, stronger bond. Therefore, HF + F are endothermic, again confirmed by figure 3.2, because the HF bond is very strong, energy is required to break it.
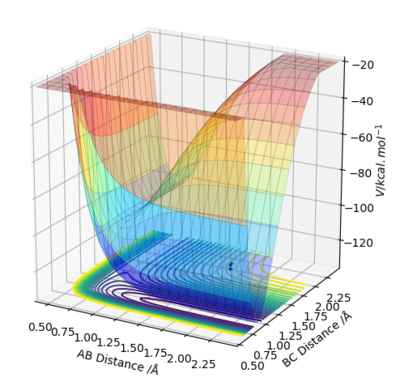
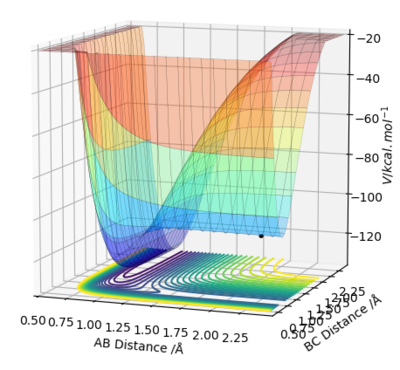
The blue dot represents the starting reactants on the potential energy surface.
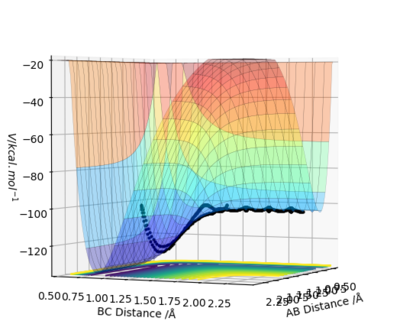
The following reaction is considered to illustrate this concept further: the initial H2 + H reaction acknowledges that the energy of the reactants and products are equal as the bond being formed and created is identical, therefore taking in and releasing equal energy. As a result the potential energy surfaces for reactants and products are equal and hence no net energy is released.
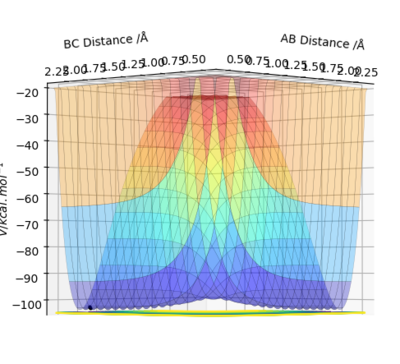
Locating the approximate position of the transition state:
Using figure 6, the approximate TS can be found as roughly AB (HH) = 0.7 Å and BC (HF) = 1.5 Å. Through using trial and error, AB was found to be 0.747 Å while BC was found to be 1.813 Å. This is exemplified in figure 6 where Transition State is signified by the lack of oscillations in the Internuclear Distance vs Time graph.

Reporting the activation energy for both reactions:
Partial displacement of the internuclear distances by +/- 0.01 was found for the TS, and through the use of a MEP calculation and an Energy vs Time graph, the activation energy can be found. Slight adjustments to the trajectory would lead to a fall back to the energy of the reactants or products and the difference in potential energy on figure 7 and 8 the activation energy could be found.
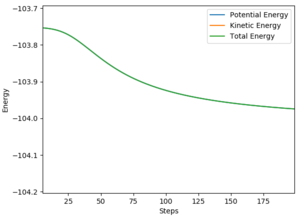

For H2 + F --> HF + H, (figure 7), activation energy: + 0.22 kcal/mol.
For HF + H --> H2 + F, (figure 8), activation energy: + 29.75 kcal/mol.
In light of the fact that energy is conserved, discuss the mechanism of release of the reaction energy. Explain how this could be confirmed experimentally:
The initial conditions of successful collisions between H2 + F --> HF + H are: 0.74 Å (HH), momenta = -2.5 kg m/s and 1.81 Å (HF), momenta = -1.69 kg m/s.
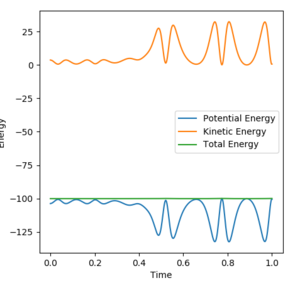
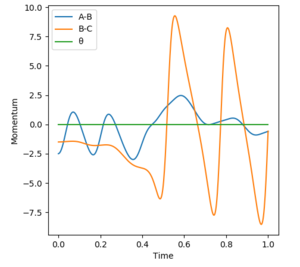
HF produces a vibrationally excited state, seen in figure 9 through the identification of the large oscillations, due to the conservation of energy throughout the reaction; further confirmation of the theory is seen in figure 10, where the total energy remains constant. There is a positive correlation between the increase in potential energy as a result of kinetic energy increase.
The vibrational energy of the HF molecule is likely to be dispersed as heat to its surroundings, confirmed experimentally using gas phase IR. This technique is able to measure any deviations in vibrational energy, because the photon released demonstrates the relaxation of the vibrationally excited state.
In the exothermic reaction of F + H2
p(FH) = translational contribution to energy
p(HH) = vibrational contribution to energy
Simulations were carried out to determine the empirical rule for the reaction. The initial reaction conditions of F + H2, set as R(HH) distance of 0.74 Å of momentum p(FH) of -0.5, were used to then test a range of p(FH) values between -3 and 3. At the values that were close to reaching the limits, the successful reaction goes to completion. Between values at the extremes (ie the middle range) it is observed that the reactions were not successful as there was a significant amount of barrier recrossing required. With a molecule approaching with a low vibrational energy, the reaction is considered unsuccessful. This is due to the fact that placing too huge an energy in the system will result in energies that significantly exceed the activation energy barrier. Since some reactions with such a high magnitude of energy are seen as being unsuccessful, this provides stronger proof against the TST. Furthermore, it indicates that the energy type (vibrational/ translational) inputted into the system is significant.
Increasing the momentum of the FH bond to p(FH) = -0.8 kg m/ s, and lowering the momentum of the HH vibration to p(HH) = 0.1 kg m/ s, it can be seen that the reaction occurs, although with barrier recrossing being present.
This reaction is exothermic and hence has a characteristic early transition state. Hence, increasing the translational contribution by a fraction for an early transition state has a greater impact on the success of the reaction than any changes to vibrational contributions.
In the endothermic reaction FH + H:
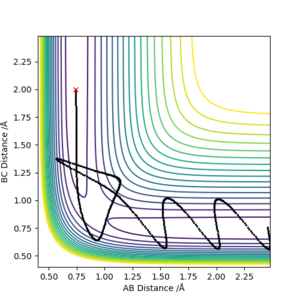
This reaction is seen to be endothermic and hence has a characteristic late transition state. Here, it was observed that adding vibrational energy to the reaction through an increased p(FH) was very significant: a reaction still occurred despite low values of p(HH), so long as a high enough magnitude of vibrational energy was present.
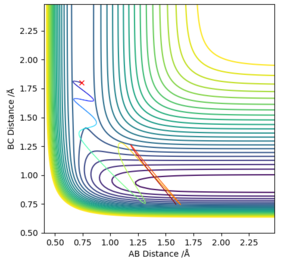
The contour plot below clearly illustrates this, which was generated using parameters of R(FH) = 0.9 Å, R(HH)= 1.3 Å, p(HH) = 0.2 kg m/ s and p(FH) = 12 kg m/ s. This particular plot exemplifies that the translational contribution to the energy is very small, whilst the vibrational contribution is very large, hence the reaction still occurs, and simultaneously the rules are illustrated.

Discussion of the distribution of energy between the different modes (translation and vibration) and how they affect the efficiency of the reaction, as well as how this is influenced by the position of the transition state.
Polanyi's Empirical Rules conclude that the activation of a late TS reaction is much more efficiently activated by vibrational energy relative to the alternative translational energy. Conversely, the opposite conditions apply for the formation of an early TS.
As concluded previously, from figure 4, the reaction H2 + F --> HF + F is exothermic. Therefore, according to Hammond's postulate, this reaction will have an early TS, wherein the TS resembles the reactants. Thus, according to the Empirical Rules discussed above, it is the translational energy that plays a greater role in the efficient energy initiation. Again, the reverse case correlates with the opposite direction of reaction from HF + F --> H2 + F. The differences in translational and vibrational energy are observable using different initial momenta, where the momenta between p(HH) or p(HF) in the diatomic molecule is the vibrational energy. The momenta between the diatomic and atom represents instead the translational energy.
The parameters for the below trajectories include: + 0.74 Å AB and + 1.81 Å AC.
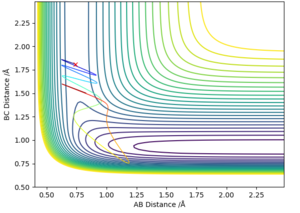
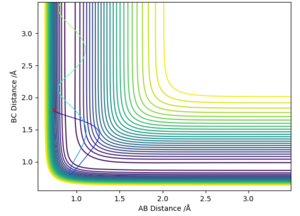
From figure 12 (greater vibrational energy; p(HH) = -3 kg m/ s, p(HF) = -0.5 kg m/ s) and 13 (greater translational energy; p(HH) = -0.5 kg m/ s, p(HF) = -2.4 kg m/ s), it can be observed that an excess in translational energy leads to a successful trajectory for H2 + F --> HF + F, while a greater translational energy does not drive a successful trajectory, with an early TS. These results support and agree with Polanyi's empirical rules.
While from figure 14 (greater vibrational energy; p(HF) = -2 kg m/ s, p(HH) = -0.5 kg m/ s) and 15 (greater translational energy; p(HF) = -0.5 kg m/ s, p(HH) = -3 kg m/ s), it can be observed from the graphs that the opposite is true to the previous case. In the reverse direction, HF + H --> H2 + F, a greater vibrational energy drives the endothermic reaction, leading to a successful trajectory with a late TS. While a greater translational energy does not drive a successful reaction, these results support and agree with Polanyi's empirical rules.


Concluding Comments:
Polanyi's rules state that for an early TS (exothermic reaction), translational energy is most important in determining the success of the reaction, whereas for a late TS (endothermic reaction), the vibrational energy is the more significant energy in determining its success. To a certain extent, these rules are useful in providing a quick guide (like with the TST) of whether or not a reaction will or will not be successful, as well as a clear indication of the parameters needed to improve the efficiency of the reaction. Nevertheless, the rules in general provide a broad overview of the entire reaction, and thus should be considered holistically with other data and information; it merely takes a tiny change in the reaction conditions to lead to a change in the expected rules.


