MRD:frances
Exercise 1
Dynamics on a Potential Energy Surface Diagram
Definition of parameters
AB distance = r1
BC distance = r2
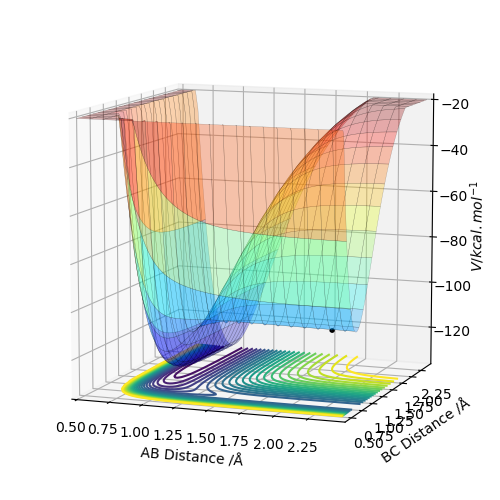
On a potential energy surface diagram, the transition state is mathematically defined as maximum point along a minimum energy pathway. The maximum along the minimum energy trajectory is shown in the first image below from a side on view. It can mathematically defined as a saddle point, which is a local minimum in one direction but a local maximum in a direction orthogonal to this direction. From this definition, taking a first derivative of the inflection point of the reaction path, ∂V('r1)/∂r1 and ∂V(r2)/∂r2 will give 0 for both derivatives, indicating a turning point. This can be distinguished from a local minimum point by taking the second derivative to the inflection point or the derivative of orthogonal vectors, q1 and q2. We can define two additional important vectors, q1 and q2. These are diagonal vectors relative to r1 and r2 and the second partial derivatives with respect to these values gives specific information about the nature of the transition state point. One derivative result will indicate a maximum point and the derivative in the orthogonal direction will indicate a minimum point i.e. ∂V(q1)/∂q1 <0 and ∂V(q2)/∂q2 >0. In one direction the second derivative will be positive indicating a minimum point, however in the other it will be negative indicating a maximum point. This is the definition of the saddle point.
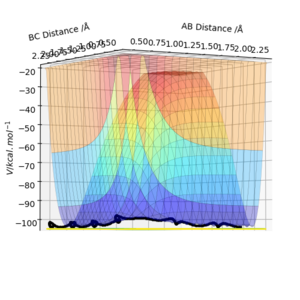

Trajectories from r1 = r2: locating the transition state
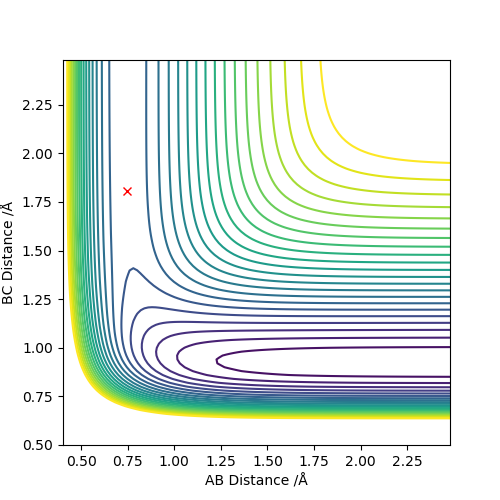
The transition state position (rts) can be estimated as 0.91 (2sf) Å. This value can be obtained through running a MEP type calculation with r1 = r2, and p1 = p2 = 0.0. This allows you to calculate the transition state point as at 0 momentum the trajectory oscillates on the ridge. Arbitrarily selecting r1 = 0.6, the system increases to a distance of 0.9077 before plateauing, indicating the transition state distance has been reached. The system comes to rest at this point.
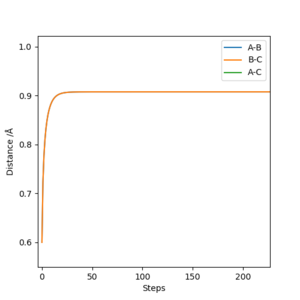
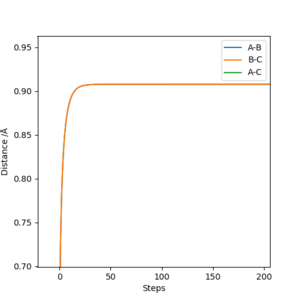
(I think including the contour plot here is better.) Cq3417 (talk) 20:18, 22 May 2019 (BST)
Reaction Path Trajectories using MEP and Dynamic Calculations
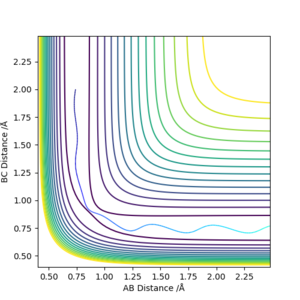
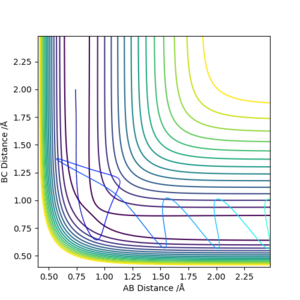
Running a trajectory calculation with the parametersr1 = 0.9077, i.e. transition state distance, r2 = 0.9087 and p1 = p2 = 0, gives two slightly different trajectories depending on which type of calculation you use. In the case of the MEP calculation, the reaction trajectory essentially runs along the minimum with no oscillations, in contrast to the dynamic calculation which oscillates along the minimum energy trajectory. These are both shown below. The reason they differ in appearance can be explained using a sphere rolling on a potential energy surface analogy. The MEP takes recordings at infinitesimally small speeds which means the sphere does not take into account any previous momentum. As a result, it has no momentum to 'roll' up the other potential energy surface and as such, the trajectory follows a straight line. In contrast, the sphere representing the dynamic calculation is aware of its previous momentum it has gained from starting higher on the potential energy surface. As a result, when it reaches the minimum, it is able to slightly roll up the opposite surface. Hence, an oscillating trajectory is observed.


(I think here contour plot is better than surface plot.) Cq3417 (talk) 20:18, 22 May 2019 (BST)
The final values values of momentum and internuclear distance can be recorded at large t.
r1(2.5)= 8.97 Å
r2(2.5)= 0.68 Å
p1(2.5)= 2.48
p2(2.5)= 0.90
If we change the parameters so that r1 = rts and r2 = rts +0.01 instead, the only difference between the plots is that the lines switch over, the magnitude of the values remains the same. This is because we are dealing with a completely symmetrical system and so the momentum and internuclear distances will be the same irrespective of whether we are considering the exchange of a H atom in either case.
The graphs of Internuclear distance vs time and momentum vs time, from which the above values were calculated from, are shown below.


Reactive and unreactive trajectories
(The contour plot of your first example in this table is a little bit ambiguous.) Cq3417 (talk) 20:18, 22 May 2019 (BST)
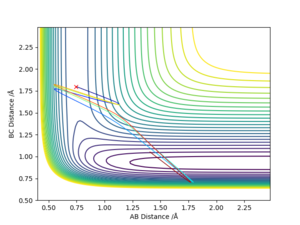
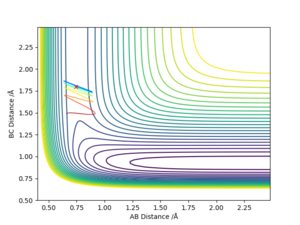
This table is showing that total energy from the reaction is not the only factor that dictates whether or not a reaction occurs. In other words, not all trajectories starting with the same positions with values of momenta greater than those resulting in a previous successful collision, will result in a successful collision reaction. Having enough kinetic energy to overcome the activation barrier is not the only condition that needs to be satisfied in order to have a successful reaction. There are many other factors to take into account such as the ratio of contribution of vibrational and translational energy to the total energy that will impact whether or not a reaction occurs. These factors are discussed later. We can also see in the case of the penultimate row value, that barrier recrossing is possible. Therefore the average number of collisions that would be predicated to occurr successfully, based on energetics alone, would in fact be greater than that observed experimentally.
Transition State Theory
Transition State theory is the idea that rates of reaction can be studied by examining activated complexes at the saddle point. These complexes are in quasi-equilibrium with the reactant molecules.
The main assumptions of transition state theory are as follows:
1. The theory assumes that each reactive intermediate is long-lived enough that a Boltzmann distribution of energies is reached before the reaction then continues onto the next step. However, this can often lead to limitations of the TST, as if the intermediates are very short lived, the reaction does not have time to re-equilibriate its energy levels. In this case the transition state will have residual momentum from its reaction trajectory that is able to push it over to the products. In addition, the model also assumes that all reactant molecules are distributes according to the Boltzman distribution. As a result, the predictions made by the model may overestimate the number of successful reactions.
2. Another assumption is that the theory is based on atomic nuclei behaving according to classical mechanics. Unless atoms react with enough energy to overcome the activation energy, a reaction does not occur. However, the phenomenon of quantum mechanical tunnelling results in the possibility of particles still crossing the barrier even if the collision does not occur with enough energy to cross the activation barrier. However, this phenomenon will be relatively small.
3. The third assumption is that the reaction system will pass over the lowest energy saddle point on the potential energy surface. This is sufficient for low temperatures however at high temp, molecules populate higher vibrational modes therefore motions are more complex and so collisions may occur with more complex transition states that do not occur on the simple saddle point Transition State Theory predicts. As a result, the energetics and dynamics associated with the prediction may not be valid.
4. It also assumes that once the transition state has been crossed and products of the reaction formed, there is no way for the entities to then recross the transition state without altering the reaction conditions in a way that is then favourable for them to do so. In other words, it does not take into account barrier recrossing, hence it predicts a greater number of reactions occurr to completion of products than is observed in reality. Hence, the predicted rate constant for the reaction will be greater than the observed.
(Good statement, any reference?) Cq3417 (talk) 20:18, 22 May 2019 (BST)
How will Transition State Theory predictions for reaction rate values compare with experimental values?
As can be seen from the table and as has been touched on above in point 4, the experimental values obtained do not follow transition state theory, as even in cases where the values predict a reaction to have enough energy to overcome the activation barrier, a reaction does not always occur. If the reactions did all obey the TST, all reactions would occur as they all have energy to overcome the activation barrier. As a result, predicted reaction rate values will be greater than those observed.
Exercise 2
The F + H2 reaction is exothermic as the reactant energies i.e. an atom of F and H2 molecule are higher than the product energies on the potential energy surface graph. However in the case of HF + H, the reaction is endothermic as the reactants are lower in energy than the products and hence the reaction proceeds in a downhill direction.
Endothermic reaction of HF + H:
Exothermic reaction of F and H2:
The blue dot represents the staring reactants on the potential energy surface.
The energetics of the reaction relate to the bond strength as the net energy taken in or released in the reaction is indicative of the relative strength of the reactant and product bonds. Bond formation is exothermic, whereas bond breaking is endothermic. Therefore, if the reactant bond strength is greater than the product bond strength, a greater amount of energy is required to break the bond than is released upon formation of the new bond. Hence, an endothermic reaction indicates that reactant bond strength is greater than product bond strength and an exothermic reaction indicates that reactant bond strength is weaker than product bond strength, as more energy has been released upon formation of the stronger product bond than was inputted to break the weaker reactant bond. This can be further illustrated by considering the initial H2 + H reaction where the energy of the reactants and products are equal as the bond being formed and created is identical, therefore taking in and releasing equal energy. As a result the potential energy surfaces for reactants and products are equal and hence no net energy is released. This is shown below.
Locating the approximate position of the transition state
The transition state is a saddle point at which, if given no additional energy or momentum, the reaction trajectory will remain stationary.
a) For the reaction F + H2, the approximate position of the transition state can be located by finding the combination of AB and BC distances at which, given no momentum and no energy, the particle trajectory will remain stationary. This can be located when:
A = F
B = H
C = H
AB distance = 1.808 Å
BC distance = 0.705 Å
This is shown graphically plotted below.
The small variation of the trajectory position is shown below, a zoomed in version of the above graph. This graph shows the precision of the approximate position, there is very small deviation from the point.
b) For the reaction HF + H, the approximate position of the transition state will simply be the same coordinates associated with the opposite atoms as the transition state is the same regardless of the direction in which the reaction proceeds. Plotting these on a contour plot for the reverse reaction gives the same result as above, a stationary trajectory point, indicating that we area at a saddle point. This graph is shown below where,
A = H
B = H
C = F
AB distance = 0.705 Å
BC distance = 1.808 Å
Estimating the activation energy
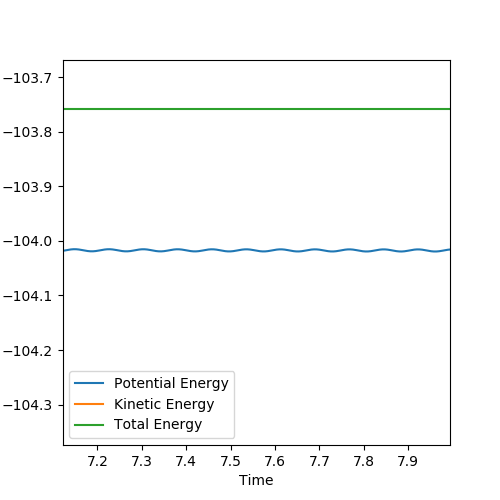
To obtain an approximation for the activation energy of the reaction, an MEP calculation can be performed (with 5000 steps) on a structure with bond lengths adjusted slightly from the transition state values. By plotting an energy V time graph, shown below, it is possible to estimate the activation energy for the reaction as the difference between the total energy and the potential energy at high values of t.
a) For the H2 + F reaction, this can be approximated as +0.255 kcal/mol.
The graphical representation of this is shown below:
b) For the HF + H reaction, this can be approximated from taking away the potential energy of the HF molecule from the total (transition state) energy. Therefore, there are an additional energy values required for this calculation, the potential energy of the HF molecule.
Using the values below:
HF potential energy = -134.03 Total energy/ Transition State energy = -103.75 H2 energy = -104.02
The activation energy of the reaction HF + H can be approximated as + 30.01 kcal/mol.
(Any diagrams here?) Cq3417 (talk) 20:18, 22 May 2019 (BST)
Reaction Dynamics
A set of conditions that results in a reactive trajectory for F + H2 are as follows:
A = F, B = H, C= H
AB distance = 1.4
BC distance = 1
AB momentum = BC momentum = 0
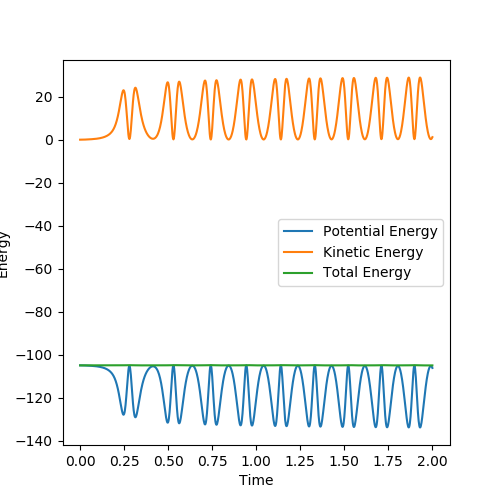
The mechanism of release of reaction energy is as follows. This reaction is an exothermic reaction, hence energy is released to the surroundings. The mechanism of release is the conversion of excess potential energy stored in the bonds of the reactants converted to kinetic energy. Molecules are constantly switching energy between potential and kinetic and hence this is a dynamic process. Upon reaction completion, energy is converted to translational energy of the H atom leaving the HF molecule as well as vibrational energy of the molecules. Therefore, even though the kinetic energy is constantly switching between vibrational and translational energy, the time average kinetic energy has increased following reaction completion.
This is shown in the graph below, where the time average kinetic energy increases, and the time average potential energy decreases:
In addition, an analysis of the momentum time graph shows that energy released from forming the stronger H-F bond is released and converted into a large increase in BC oscillation. The AB value however tends to a fixed value as the product molecule and particle move away from each other and so do not influence each others momentum. This means the translational energy represented by the orange line, remains constant. The HF bond will continue to oscillate at a steady rate however, with the increase in oscillation proportional to the energy released from the chemical bonds and hence the increase in temperature of the reaction.
In summary, chemical Potential energy is being converted to Kinetic energy.
Experimentally this can be confirmed through measuring the temperature of the reaction. Kinetic energy is all energy an object possesses due to motion and so in general the kinetic energy of the molecules increases due to the release of energy, therefore the temperature of the surroundings of an exothermic reaction will increase. As a result, using calorimetry, you can measure the increase in kinetic energy in the surroundings.
Discuss how the distribution of energy between different modes (translation and vibration) affect the efficiency of the reaction, and how this is influenced by the position of the transition state.
Contributions from the energy occur as vibrational and translational.
In the exothermic reaction of F + H2
pFH = the translational contribution to the energy pHH = the vibrational contribution to the energy
A number of simulations were performed in order to determine the empirical rules for the reaction.
First, initially setting the conditions of a reaction of F + H2 as rHH = 0.74, with a momentum pFH = -0.5. Testing a range of values of pFH between -3 and 3, it is observed that at values close to the limits, the reaction is successful and goes to completion. However, at values in between, it is observed that either the reaction is not successful or there is a significant amount of barrier recrossing. Therefore if the vibrational energy of the molecule approaching is too low, the reaction will not be successful. As we have been told, we are placing a much greater amount of energy in the system, much greater than that required to surpass the activation energy barrier. The fact that some of the reactions even with this magnitude of energy are unsuccessful is further proof against TST and indication that the type of energy (vibrational or transnational) supplied to the system is important.
Using the increasing the momentum of the FH bond to -0.8 and reducing the momentum of the HH vibration to 0.1 you observe the reaction does occur, however there appears to be barrier recrossing.
This reaction is exothermic and hence has an early transition state.
This shows that increasing the translational contribution even slightly for an early transition state has a greater impact on the success of the reaction than any changes to vibrational contributions.
In the endothermic reaction FH + H
This reaction is endothermic and hence has a late transition state. In this case, it was observed that adding vibrational energy to the reaction (ie in the form of momentum pFH) was of greatest importance. A reaction still occurred despite low values of pHH, if there was still a high enough magnitude of vibrational energy.
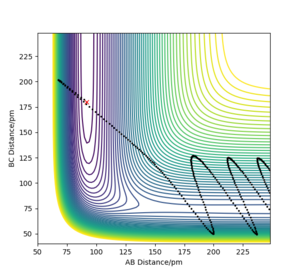
This can be illustrated in the below contour plot which was generated using parameters of rFH = 0.9, rHH= 1.3 pHH = 0.2 and pFH = 12. In this case, the translational contribution to the energy is very small, yet the vibrational contribution is very large and hence the reaction still occurs. This illustrates the rules.
Polanyi's rules
Polanyi's rules state that a certain distribution of energy in reactants and products is more favoured to promote a successful reaction. The specifics of this distribution are dependant on whether the reaction has an early or late transition state. Using Hammond's postulate, it can be assumed that an exothermic reaction has an early transition state in which the transition state closely resembles the reactants and in an endothermic reaction the transition state energy most closely resembles the products.
Polanyi's rules relate concept of early or late transition state to the most favourable distribution of energy for the highest efficiency of reaction[1]. These rules state that vibrational energy is more efficient in promoting a late transition state reaction than translational energy, whereas the reverse is true for an early transition state reaction.
For an early transition state (exothermic reaction), translational energy is most important in determining the success of the reaction.
An example of this case is shown below. Starting with reaction parameters: rFH = 2 rHH = 0.74 and pHH = -1.5, pHH = -0.26, a reaction does not occur. However, only slightly increasing the FH momentum, related to the translational energy, from -0.26 to -0.28 results in a successful reaction. This proves that translational energy is most important in determining the success of a reaction. This process is illustrated below in the two graphs where just a small change in translational energy results in the reaction overcoming the transition state barrier and the reaction occurring successfully. As was indicated above, it took much greater changes to the vibrational motion in the range pHH = -3 to 3 in order to achieve a successful reaction. This further confirms the notion that translational energy is most important factor for the efficiency of the exothermic reaction.


For a late transition state (endothermic reaction), vibrational energy is most important in determining the success of the reaction.
These rules are in line with the observations made above about the importance of the translation and vibrational energy distribution for the exothermic reaction of F + H2 and the reverse endothermic reaction of FH + H.
These rules are successful to a certain degree, however, varying the conditions even slightly may result in an unsuccessful reaction even where the rules may predict that a reaction would be successful.
Conclusion
Polanyi's rules state that for a late transition state (endothermic reaction), vibrational energy is most important in determining the success of the reaction, yet for an early transition state (exothermic reaction), translational energy is most important in determining the success of the reaction. These rules are useful to a certain extent as they provide a quick guide, much like with TST, as to whether or not a reaction will be successful and the parameters needed in order to improve reactions efficiency. However, these rules are also a broad overview and should not be taken as the whole story as often small tweaks in conditions will act against the rules. Such an example includes
(Overall, well done) Cq3417 (talk) 20:18, 22 May 2019 (BST)
Reference
1. J. Phys. Chem. Lett., 2012, 3 (23), pp 3416–3419

