User:Nb2212
BH3 Section
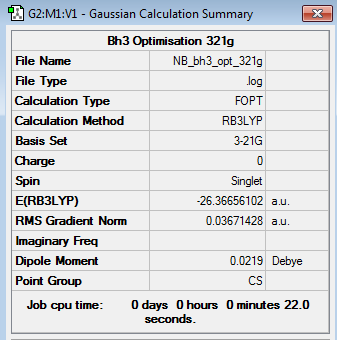
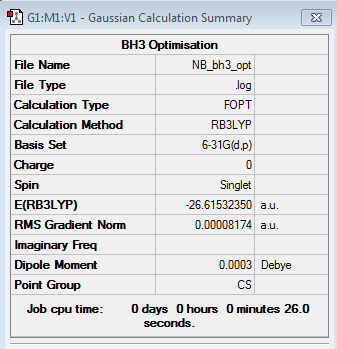
BH3 3-21G Optimisation
Optimisation log file here
BH3 6-31G Optimisation
Optimisation log file here
| Summary Data | Convergence | Jmol | |||
|---|---|---|---|---|---|
|
Item Value Threshold Converged? Maximum Force 0.000203 0.000450 YES RMS Force 0.000098 0.000300 YES Maximum Displacement 0.000867 0.001800 YES RMS Displacement 0.000415 0.001200 YES |
|
EX3 Section
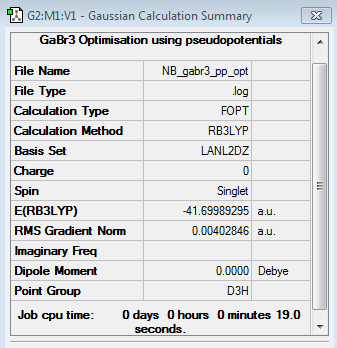
GaBr3 Pseudopotentials Optimisation
Optimisation log file here
| Summary Data | Convergence | Jmol | |||
|---|---|---|---|---|---|
|
Item Value Threshold Converged? Maximum Force 0.000000 0.000450 YES RMS Force 0.000000 0.000300 YES Maximum Displacement 0.000003 0.001800 YES RMS Displacement 0.000002 0.001200 YES |
|
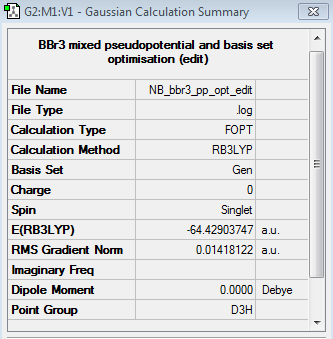
BBr3 Pseudopotentials and Basis Set Optimisation
Optimisation log file here
| Summary Data | Convergence | Jmol | |||
|---|---|---|---|---|---|
|
Item Value Threshold Converged? Maximum Force 0.000008 0.000450 YES RMS Force 0.000005 0.000300 YES Maximum Displacement 0.000036 0.001800 YES RMS Displacement 0.000023 0.001200 YES |
|
| BH3 | BBr3 | GaBr3 | |
|---|---|---|---|
| r(E-X) | 1.19 | 1.93 | 2.35 |
| θ(X-E-X) | 120.0 | 120.0 | 120.0 |
When discussing bond lengths of BH3, GaBr3 and BBr3, making the assumption that the bonds will be purely covalent means the bond lengths in each species can be expected to be the sum of the covalent bond radii of the atoms involved. Using this assumption, the strength of the bond and type of bonding can be inferred. Using the sum of covalent radii the B-H bond length would be predicted to be 119pm theoretically, as is the result from the optimised calculation. From this it can be inferred that the B-H is fully covalent. The B-Br length would be expected to be 196pm, and the result is 193pm, once again demonstrating the bond is fully covalent. Boron trigonal planar compounds are electron deficient, making the molecule lewis acidic, therefore in this case, the highly electronegative Br atoms are able to donate electron density into an empty 2p orbital on the boron. For the Ga-Br bond, the bond length is expected to be 240pm by the sum of covalent radii, the calculated result is 235pm again showing the covalent nature of the bond. As Ga and Br are in the same period, the orbital overlap is likely to be better than that of the B-Br bond, which causes a decrease in the theoretical length of the bond, indicating further strength. When considering the main differences between H and Br, it is evident that Br is larger and on substitution of H with Br (as seen in BH3 and BBr3) the bond length increases. Both B and Ga are in the 3rd period, indicating their electron deficiency when forming BBr3 and GaBr3, but the lewis acidity of the latter compound is reduced. On observation of the angles in each compound, all angles were 120ᶿ as expected in a trigonal planar structure.
A bond is an internuclear attraction between two atoms. There are many types of bonds; a covalent bond involves nuclei held together by an electrostatic force of interaction, in the case where the two nuclei are the same, the electron density is distributed equally amongst the two nuclei. When the nuclei are different, and thus there is a difference in the electronegativity of the two nuclei, the electron cloud will be distorted with a larger share of the electron density on the more electronegative nucleus – this polar covalent bond results in a permanent dipole. When the electronegativity difference between the two nuclei involved is large this results in ionic bonding in which a positive ion and negative ion is formed. An example of a strong (covalent) bond would be the N≡N bond which has a dissociation energy of 945kJ/mol. A medium strength (covalent) bond would be the C-F bond with a dissociation a energy of 490kJ/mol, this strength is due to the good orbital overlap between the two atoms. A weak (covalent) bond would be the I-I bond, with an energy of 151kJ/mol – the larger orbitals on I results in an increased bond length. These examples demonstrate the strength of a covalent bond can vary. In a general sense, covalent and ionic bonds are considered strong. A weaker bond would be Van der Waals dispersion forces which arise between permanent dipoles, induced dipoles and both combined. [1]
Gaussview does not always draw bonds where expected because it has set parameters for what it expects the bond length to be, therefore when the bond does not meet the minimum bond length requirements it does not draw a bond. We can expect the bonds that would not be detected may be dispersion forces or bridging bonds.
BH3 Frequency Analysis
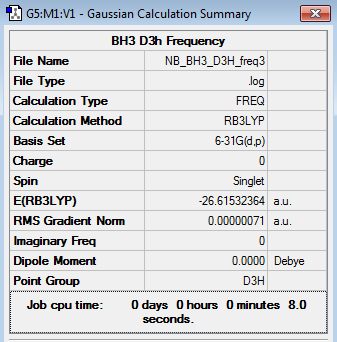
6-31G(d,p) BH3 frequency file here
Low frequencies ---  -10.1940  -10.1821   -3.1776   -0.0008    0.0579    0.4920
Low frequencies --- 1162.9850 1213.1461 1213.1463
| Summary Data | Convergence | Jmol | |||
|---|---|---|---|---|---|
|
Item Value Threshold Converged? Maximum Force 0.000001 0.000450 YES RMS Force 0.000001 0.000300 YES Maximum Displacement 0.000006 0.001800 YES RMS Displacement 0.000003 0.001200 YES |
|
BH3 Vibrational Spectrum Analysis
| Wavenumber(cm-1) | Intensity | IR active? | Type |
| 1163 | 93 | Yes | Bend |
| 1213 | 14 | Yes | Bend |
| 1213 | 14 | Yes | Bend |
| 2583 | 0 | No | Stretch |
| 2716 | 126 | Yes | Stretch |
| 2715 | 126 | Yes | Stretch |
GaBr3 Frequency Analysis
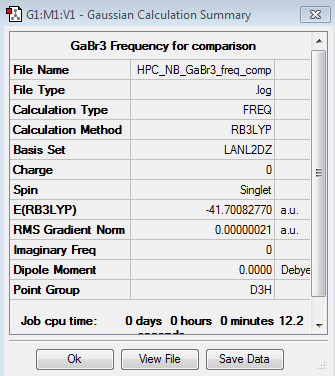
LANL2DZ GaBr3 frequency file here
Low frequencies ---   -1.4877   -0.0015   -0.0002    0.0096    0.6540    0.6540
Low frequencies ---   76.3920   76.3924   99.6767
| Summary Data | Convergence | Jmol | |||
|---|---|---|---|---|---|
|
Item Value Threshold Converged? Maximum Force 0.000000 0.000450 YES RMS Force 0.000000 0.000300 YES Maximum Displacement 0.000004 0.001800 YES RMS Displacement 0.000002 0.001200 YES |
|
GaBr3 Vibrational Spectrum Analysis
| Wavenumber(cm-1) | Intensity | IR active? | Type |
| 76 | 3 | Yes | Bend |
| 76 | 3 | Yes | Bend |
| 100 | 9 | Yes | Bend |
| 197 | 0 | No | Stretch |
| 316 | 57 | Yes | Stretch |
| 316 | 57 | Yes | Stretch |
Frequency analysis explanations
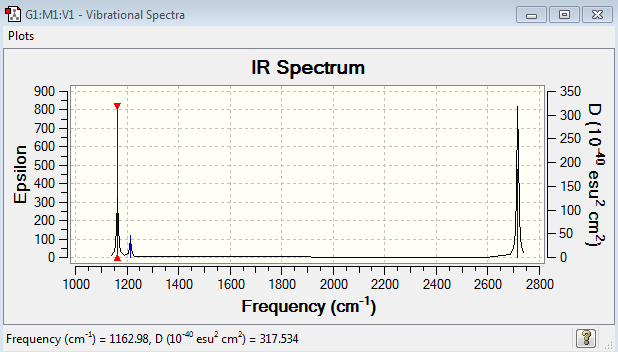
For a non-linear molecule there are 3N-6 modes of vibration, therefore for BH3 (N=4) there are six modes of vibration. For a vibrational mode to be termed as IR active it needs to absorb infrared light which is only done when the vibration results in a change in the dipole moment of the molecule. For BH3, the stretch at 2583 cm-1 corresponds to a symmetric stretch which does not cause a change in dipole, deeming this vibration to be IR inactive.
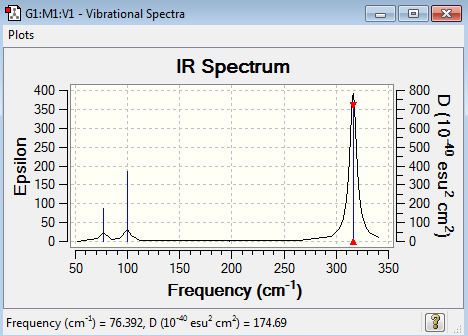
The bond length and mass of particles has a large impact on the IR spectrum of molecules. Stronger bonds resonate at higher frequencies – this is demonstrated by the IR spectra of GaBr3 and BH3. The B-H bonds, as discussed previously, are shorter and therefore stronger than the Ga-Br bonds and therefore resonate at higher frequencies. Relating this to energy where E = hf (h is planck’s constant), the higher the frequency the greater the energy required to vibrate the bond and overcome the attraction between the nuclei.
The A2’’ umbrella motion for GaBr3 it at a higher frequency of 100cm-1, higher than the degenerate vibrations. For BH3 the A2’’ umbrella motion is the lowest frequency at 1163 cm-1. By considering the displacement vectors, for BH3 the hydrogens are being displaced for the bend causing the vibration. For GaBr3 the central Ga atom is being displaced for the motion which results in it being of higher energy than the degenerate pair because the Ga is in a sense having to do more work to achieve the vibration instead of if the Br atoms were being displaced.
A basis set describes the number of functions used to describe the electronic structure. The same method and basis set must be used for the optimisation and frequency analysis calculations for a fair comparison – the total energy given by a calculation is highly dependent on the basis set used, therefore comparison of this data for different molecules using different basis sets is void. Gaussian computes energies by finding the minimum point on a potential energy surface, in our calculations using the 6-31G basis set, tight convergence data and the ‘scf=conver=9’ all instruct Gaussian to use more precise calculations for obtaining a value for the minimum (i.e. when calculating the area under a graph using a trapezium method, these instruct Gaussian to create smaller trapeziums in order to reach a more precise result). When carrying out a frequency analysis the energy changes very slightly, as can be seen in the comparison of summaries for each optimisation and frequency, this is because Gaussian defines a minimum as a point where the gradient is equal to zero, therefore the point may move slightly but still correspond to a minimum. The frequency analysis must be carried out to ensure the point given is a minimum, if, by going on the arbitrary values of plus or minus 15cm-1, the ‘low frequency’ values lie outside this range it means the point found is not a minimum. The first line of the ‘low frequencies’ corresponds to the 6 vibrations of the molecule as expected by the 3N-6 vibrational modes.
BH3 MO Diagram
Energy log file for MO computing here
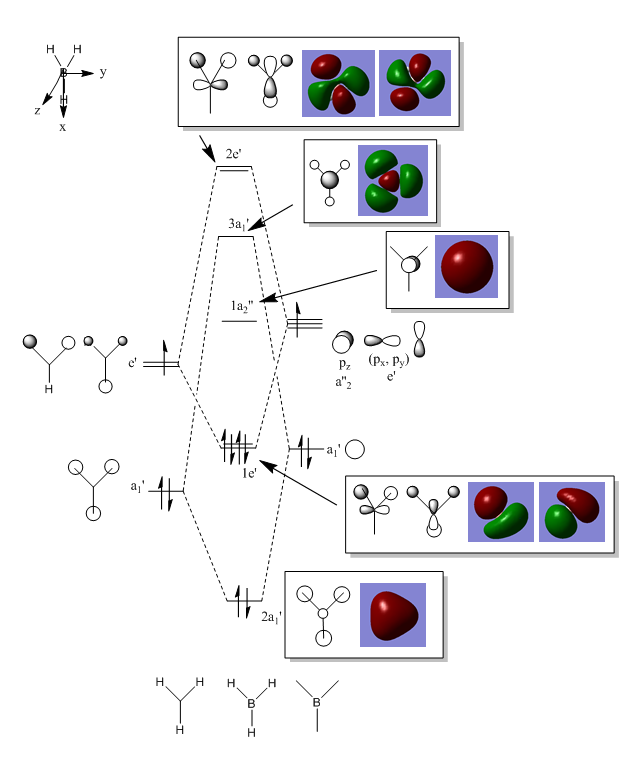
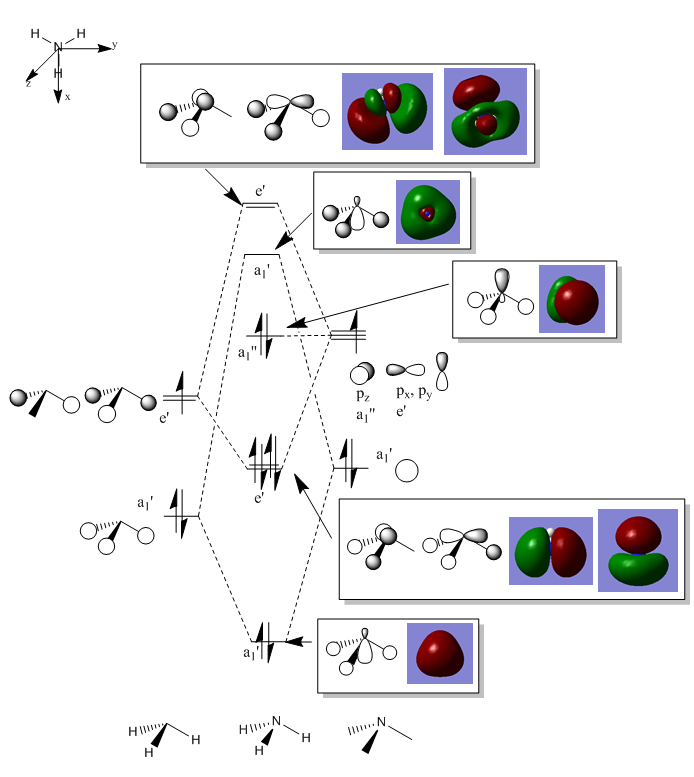
The calculated MOs resemble the LCAO MOs which proves that a qualitative approach to MO formation is mostly accurate. Saying this, computational methods should still be employed to confirm the predictions.
NH3 Optimisation
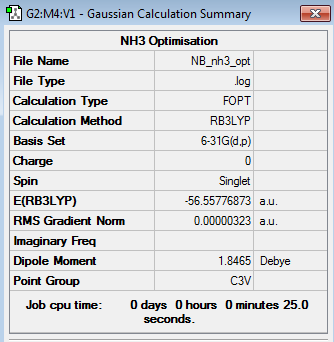
Optimisation log file here
| Summary Data | Convergence | Jmol | |||
|---|---|---|---|---|---|
|
Item Value Threshold Converged? Maximum Force 0.000006 0.000450 YES RMS Force 0.000004 0.000300 YES Maximum Displacement 0.000012 0.001800 YES RMS Displacement 0.000008 0.001200 YES |
|
NH3 Frequency Analysis
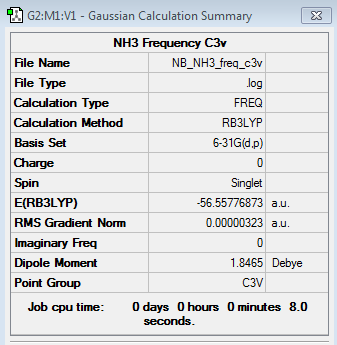
6-31G(d,p) NH3 frequency file here
Low frequencies ---   -0.0130   -0.0028   -0.0002    7.0722    8.1014    8.1017
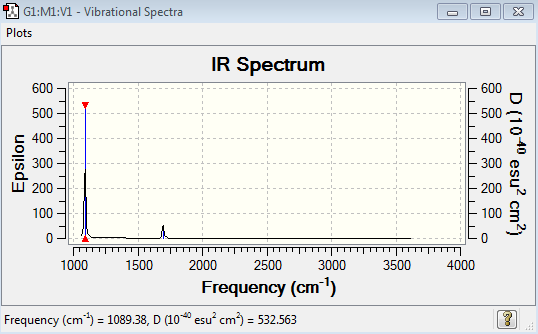
Low frequencies --- 1089.3849 1693.9369 1693.9369
| Summary Data | Convergence | Jmol | |||
|---|---|---|---|---|---|
|
Item Value Threshold Converged? Maximum Force 0.000006 0.000450 YES RMS Force 0.000003 0.000300 YES Maximum Displacement 0.000013 0.001800 YES RMS Displacement 0.000007 0.001200 YES |
|
NH3 Vibrational Spectrum Analysis
| Wavenumber(cm-1) | Intensity | IR active? | Type |
| 1089 | 145 | Yes | Bend |
| 1694 | 14 | Yes | Bend |
| 1694 | 14 | Yes | Bend |
| 3461 | 1 | No | Stretch |
| 3590 | 0.2699 | Yes | Stretch |
| 3590 | 0.2699 | Yes | Stretch |
NH3 MO Diagram
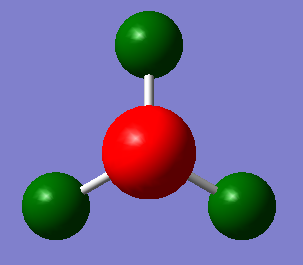
Energy log file for MO computing and NBO analysis here
NH3 NBO Analysis

| Atom | NBO Charge |
|---|---|
| N | -1.125 |
| H | 0.375 |
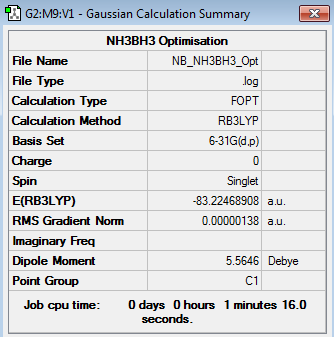
NH3BH3 Optimisation
B3LYP/6-31G(d,p) Optimisation log file here
| Summary Data | Convergence | Jmol | |||
|---|---|---|---|---|---|
|
Item Value Threshold Converged? Maximum Force 0.000002 0.000015 YES RMS Force 0.000001 0.000010 YES Maximum Displacement 0.000034 0.000060 YES RMS Displacement 0.000010 0.000040 YES |
|
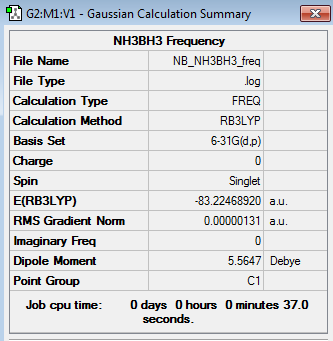
NH3BH3 Frequency Analysis
B3LYP/6-31G(d,p) Frequency log file here
Low frequencies ---   -2.8800    0.0007    0.0009    0.0018    4.0175    7.9188
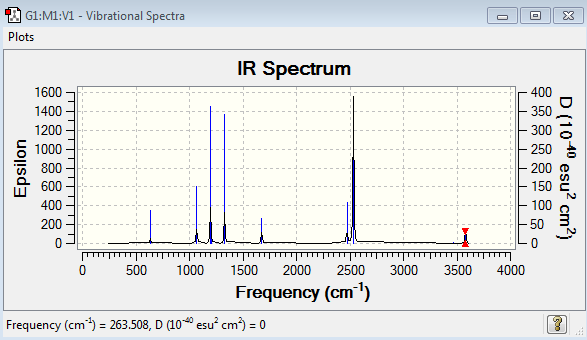
Low frequencies ---  263.5082  632.9669  638.4737
| Summary Data | Convergence | Jmol | |||
|---|---|---|---|---|---|
|
Item Value Threshold Converged? Maximum Force 0.000004 0.000450 YES RMS Force 0.000001 0.000300 YES Maximum Displacement 0.000027 0.001800 YES RMS Displacement 0.000011 0.001200 YES |
|
NH3BH3 Vibrational Spectrum Analysis
| Wavenumber(cm-1) | Intensity | IR active? | Type |
| 264 | 0 | No | Bend |
| 633 | 14 | Yes - weakly | Stretch |
| 638 | 4 | No | Bend |
| 639 | 4 | No | Bend |
| 1069 | 41 | Yes - medium | Bend |
| 1069 | 41 | Yes -medium | Bend |
| 1196 | 109 | Yes - strongly | Bend |
| 1204 | 3 | No | Bend |
| 1204 | 3 | No | Bend |
| 1329 | 114 | Yes - strongly | Bend |
| 1676 | 28 | Yes - slightly | Bend |
| 1676 | 28 | Yes - weakly | Bend |
| 2472 | 67 | Yes - medium | Stretch |
| 2532 | 231 | Yes - very strong | Stretch |
| 2532 | 231 | Yes - very strong | Stretch |
| 3464 | 3 | No | Stretch |
| 3581 | 28 | Yes - weakly | Stretch |
| 3581 | 28 | Yes - weakly | Stretch |
NH3, BH3 and NH3BH3 Energy Calculations
| Molecule | Energy (au) |
|---|---|
| NH3 | -56.5577687 |
| BH3 | -26.61532364 |
| NH3BH3 | -83.2246891 |
ΔE= E(NH3BH3)-[E(NH3)+E(BH3)]
ΔE= E(-83.2246891)-[E(-56.5577687)+E(-26.61532364)]
ΔE= -0.0515968 au
ΔE= -0.0515968 x 2625.50 = -135.47 kJmol-1
Following on from the earlier discussion of strong, medium and weak bonds, the energy difference between the products and reactants is approximately -135.47 kJmol-1 which corresponds to the strength of the N-B bond. Therefore the bond can be assumed to be relatively weak as a small amount of energy input is required for dissociation. This is the expected value as N and B have a large difference in electronegativity.
Project Section
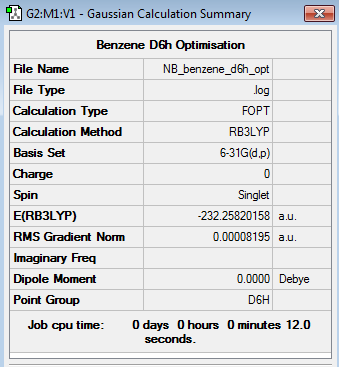
Benzene 6-31G Optimisation
Optimisation log file here
| Summary Data | Convergence | Jmol | |||
|---|---|---|---|---|---|
|
Item Value Threshold Converged? Maximum Force 0.000193 0.000450 YES RMS Force 0.000079 0.000300 YES Maximum Displacement 0.000830 0.001800 YES RMS Displacement 0.000294 0.001200 YES |
|
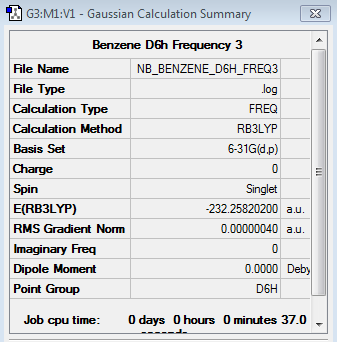
Benzene 6-31G Frequency Analysis
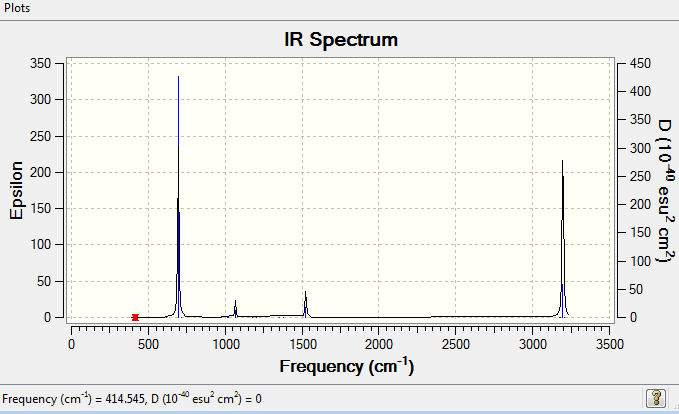
Frequency log file here
Low frequencies ---  -10.2549   -5.6651   -5.6651   -0.0055   -0.0055   -0.0003
Low frequencies ---  414.5451  414.5451  621.0429
| Summary Data | Convergence | Jmol | |||
|---|---|---|---|---|---|
|
Item Value Threshold Converged? Maximum Force 0.000001 0.000450 YES RMS Force 0.000000 0.000300 YES Maximum Displacement 0.000001 0.001800 YES RMS Displacement 0.000001 0.001200 YES |
|
Benzene Vibrational Spectrum Analysis
| Wavenumber(cm-1) | Intensity | IR active? | Type |
| 415 | 0 | No | Bend |
| 415 | 0 | No | Bend |
| 621 | 0 | No | Bend |
| 621 | 0 | No | Bend |
| 695 | 74 | Yes - strongly | Bend |
| 718 | 0 | No | Bend |
| 865 | 0 | No | Bend |
| 865 | 0 | No | Bend |
| 975 | 0 | No | Bend |
| 975 | 0 | No | Bend |
| 1013 | 0 | No | Bend |
| 1018 | 0 | No | Bend |
| 1020 | 0 | No | Stretch |
| 1066 | 3 | No | Bend |
| 1066 | 3 | No | Bend |
| 1180 | 0 | No | Bend |
| 1203 | 0 | No | Bend |
| 1203 | 0 | No | Bend |
| 1355 | 0 | No | Stretch |
| 1381 | 0 | No | Bend |
| 1524 | 7 | Yes - weakly | Bend |
| 1524 | 7 | Yes - weakly | Bend |
| 1652 | 0 | No | Stretch |
| 1652 | 0 | No | Stretch |
| 3172 | 0 | No | Stretch |
| 3181 | 0 | No | Stretch |
| 3181 | 0 | No | Stretch |
| 3197 | 47 | Yes - strongly | Stretch |
| 3197 | 47 | Yes - strongly | Stretch |
| 3208 | 0 | No | Stretch |
Benzene MO Diagram
Energy log file for MO computing and NBO analysis here
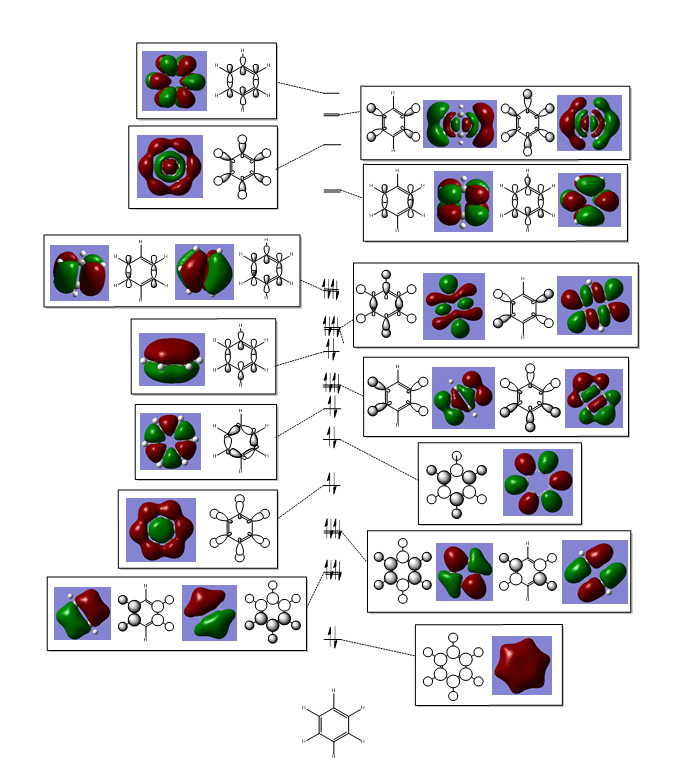
For the MO diagram of benzene, it should be noted that I have made use of hybrid orbitals. This does not follow the LCAO approach but from further analysis of the NBO calculations further to creating the diagram, there is evidence to suggest a system of hybrid orbitals amongst normal molecular orbitals constructed from LCAO's.
Benzene NBO Analysis

| Atom | NBO Charge |
|---|---|
| C | -0.239 |
| H | 0.239 |
Aromaticity is defined by several conditions: the structure must be planar with pi bonds in a cyclic structure, all p orbitals must overlap and as a result of this there is a delocalised system of electrons, the molecule must follow Huckel’s Rule of 4n+2 pi electrons which leads to a lowering in energy of the system. Firstly looking at the MO diagram there is a clear cyclic arrangement of p orbitals in three MO’s, where each contains 2 electrons thus totalling 6 pi electrons – this corresponds to Huckel’s rule of 4n+2 where n=1. Secondly looking at the following part of the Gaussian energy calculation log file we can see features of aromaticity as seen in the MO. The first section corresponds to a C-C bond, from the percentages it is apparent the bond is formed by equal overlap of a hybrid sp2 orbital from each carbon. The third calculation relates to another C-C bond, this time formed from p orbitals on each carbon. Going through the table these bonding patterns are repeated reinforcing the aromaticity ideas the MO diagram presents.
       (Occupancy)   Bond orbital/ Coefficients/ Hybrids
 ---------------------------------------------------------------------------------
     1. (1.98098) BD ( 1) C   1 - C   2
                ( 50.00%)   0.7071* C   1 s( 35.20%)p 1.84( 64.76%)d 0.00(  0.04%)
                                           -0.0001  0.5932 -0.0079  0.0006  0.7063
                                            0.0300 -0.3840  0.0193  0.0000  0.0000
                                           -0.0151  0.0000  0.0000  0.0069 -0.0109
                ( 50.00%)   0.7071* C   2 s( 35.20%)p 1.84( 64.76%)d 0.00(  0.04%)
                                           -0.0001  0.5932 -0.0079  0.0006 -0.6857
                                            0.0017  0.4197  0.0357  0.0000  0.0000
                                           -0.0135  0.0000  0.0000  0.0096 -0.0109
     3. (1.66514) BD ( 2) C   1 - C   6
                ( 50.00%)   0.7071* C   1 s(  0.00%)p 1.00( 99.96%)d 0.00(  0.04%)
                                            0.0000  0.0000  0.0000  0.0000  0.0000
                                            0.0000  0.0000  0.0000  0.9997 -0.0133
                                            0.0000 -0.0096 -0.0170  0.0000  0.0000
                ( 50.00%)   0.7071* C   6 s(  0.00%)p 1.00( 99.96%)d 0.00(  0.04%)
                                            0.0000  0.0000  0.0000  0.0000  0.0000
                                            0.0000  0.0000  0.0000  0.9997 -0.0133
                                            0.0000  0.0195 -0.0002  0.0000  0.0000
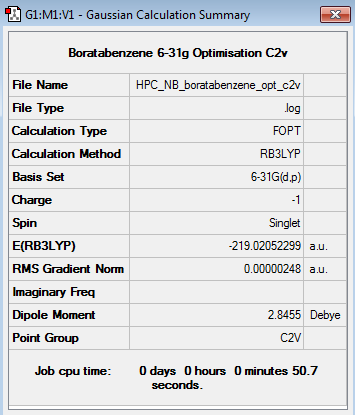
Boratabenzene 6-31G Optimisation
Optimisation log file here
| Summary Data | Convergence | Jmol | |||
|---|---|---|---|---|---|
|
Item Value Threshold Converged? Maximum Force 0.000007 0.000015 YES RMS Force 0.000002 0.000010 YES Maximum Displacement 0.000031 0.000060 YES RMS Displacement 0.000009 0.000040 YES |
|
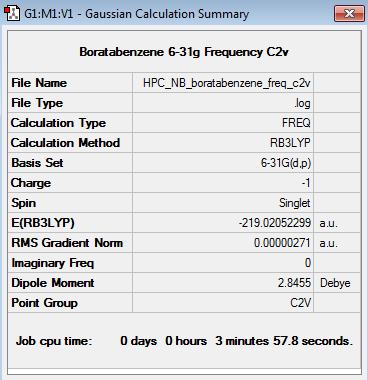
Boratabenzene 6-31G Frequency Analysis
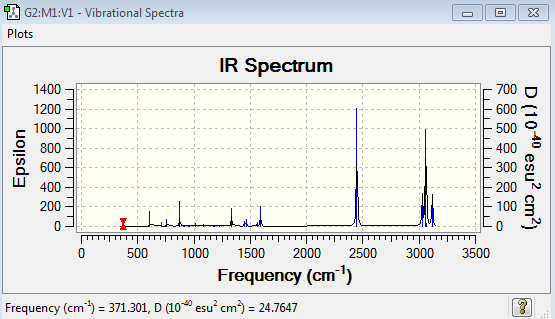
Frequency log file here
Low frequencies ---   -7.1034   -0.0008   -0.0006   -0.0006    3.1885    5.0012
Low frequencies ---  371.3009  404.4183  565.0800
| Summary Data | Convergence | Jmol | |||
|---|---|---|---|---|---|
|
Item Value Threshold Converged? Maximum Force 0.000013 0.000450 YES RMS Force 0.000003 0.000300 YES Maximum Displacement 0.000036 0.001800 YES RMS Displacement 0.000012 0.001200 YES |
|
Boratabenzene Vibrational Spectrum Analysis
| Wavenumber(cm-1) | Intensity | IR active? | Type |
| 371 | 2 | No | Bend |
| 404 | 0 | No | Bend |
| 565 | 0 | No | Bend |
| 568 | 0 | No | Bend |
| 608 | 11 | Yes - weakly | Bend |
| 711 | 3 | No | Bend |
| 756 | 7 | No | Bend |
| 815 | 0 | No | Bend |
| 873 | 28 | No | Bend |
| 906 | 0 | No | Bend |
| 917 | 1 | No | Bend |
| 951 | 0 | No | Bend |
| 951 | 0 | No | Bend |
| 960 | 2 | No | Stretch |
| 1012 | 4 | No | Bend |
| 1085 | 3 | No | Bend |
| 1175 | 1 | No | Bend |
| 1180 | 1 | No | Bend |
| 1227 | 1 | No | Bend |
| 1333 | 31 | No | Bend |
| 1449 | 9 | No | Bend |
| 1463 | 14 | Yes - weakly | Bend |
| 1565 | 7 | Yes - weakly | Bend |
| 1592 | 40 | Yes - medium | Bend |
| 2447 | 368 | Yes - very strongly | Stretch |
| 3027 | 108 | Yes - strongly | Stretch |
| 3030 | 0 | No | Stretch |
| 3060 | 380 | Yes - very strongly | Stretch |
| 3061 | 10 | Yes - weakly | Stretch |
| 3116 | 112 | Yes - strongly | Stretch |
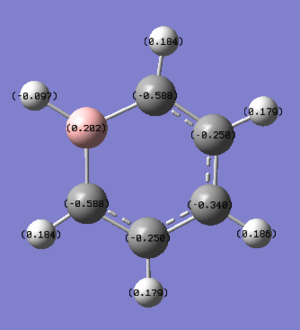
Boratabenzene NBO Analysis
Energy log file for NBO analysis here

| Atom | NBO Charge |
|---|---|
| B | 0.202 |
| C (ortho to B) | -0.588 |
| C (meta to B) | -0.250 |
| C (para to B) | -0.340 |
| H (on B) | -0.097 |
| H (on ortho C) | 0.184 |
| H (on meta C) | 0.179 |
| H (on para C) | 0.186 |
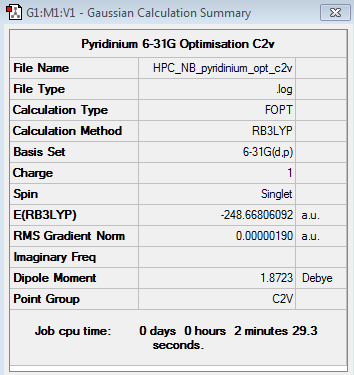
Pyridinium 6-31G Optimisation
Optimisation log file here
| Summary Data | Convergence | Jmol | |||
|---|---|---|---|---|---|
|
Item Value Threshold Converged? Maximum Force 0.000003 0.000015 YES RMS Force 0.000001 0.000010 YES Maximum Displacement 0.000008 0.000060 YES RMS Displacement 0.000002 0.000040 YES |
|
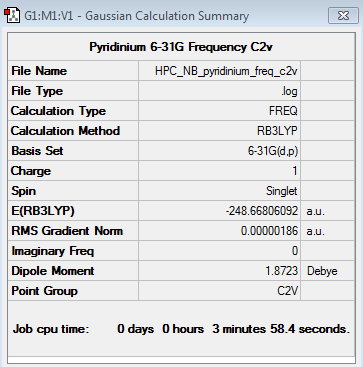
Pyridinium 6-31G Frequency Analysis
Frequency log file here
Low frequencies ---   -9.3854   -2.9688   -0.0007   -0.0003    0.0008    0.9294
Low frequencies ---  391.8998  404.3434  620.1995
| Summary Data | Convergence | Jmol | |||
|---|---|---|---|---|---|
|
Item Value Threshold Converged? Maximum Force 0.000005 0.000450 YES RMS Force 0.000002 0.000300 YES Maximum Displacement 0.000007 0.001800 YES RMS Displacement 0.000003 0.001200 YES |
|
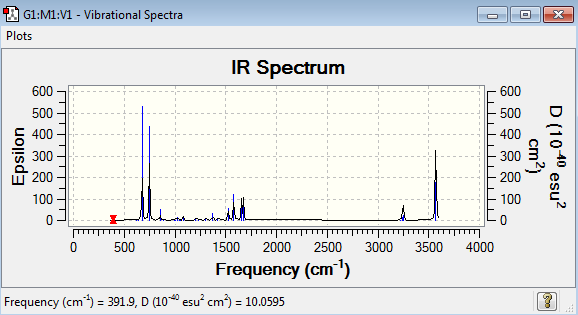
Pyridinium Vibrational Spectrum Analysis
| Wavenumber(cm-1) | Intensity | IR active? | Type |
| 392 | 1 | No | Bend |
| 404 | 0 | No | Bend |
| 620 | 0 | No | Bend |
| 645 | 0 | No | Bend |
| 677 | 90 | Yes - strongly | Bend |
| 748 | 82 | Yes - strongly | Bend |
| 854 | 11 | Yes - weakly | Bend |
| 883 | 0 | No | Bend |
| 992 | 2 | No | Bend |
| 1006 | 0 | No | Bend |
| 1022 | 4 | No | Bend |
| 1048 | 0 | No | Bend |
| 1052 | 0 | No | Bend |
| 1082 | 3 | No | Stretch |
| 1087 | 4 | No | Bend |
| 1200 | 3 | No | Bend |
| 1229 | 2 | No | Bend |
| 1300 | 3 | No | Bend |
| 1374 | 11 | Yes - weakly | Bend |
| 1416 | 3 | No | Bend |
| 1524 | 21 | Yes - weakly | Bend |
| 1580 | 48 | Yes - medium | Bend |
| 1657 | 32 | Yes - medium | Bend |
| 1677 | 34 | Yes - medium | Bend |
| 3233 | 0 | No | Stretch |
| 3240 | 1 | No | Stretch |
| 3242 | 11 | Yes - weakly | Stretch |
| 3252 | 20 | Yes - weakly | Stretch |
| 3254 | 0 | Yes - weakly | Stretch |
| 3570 | 158 | Yes - strongly | Stretch |
Pyridinium NBO Analysis
Energy log file for NBO analysis here

| Atom | NBO Charge |
|---|---|
| N | -0.476 |
| C (ortho to N) | 0.071 |
| C (meta to N) | -0.241 |
| C (para to N) | -0.122 |
| H (on N) | 0.483 |
| H (on ortho C) | 0.285 |
| H (on meta C) | 0.297 |
| H (on para C) | 0.292 |
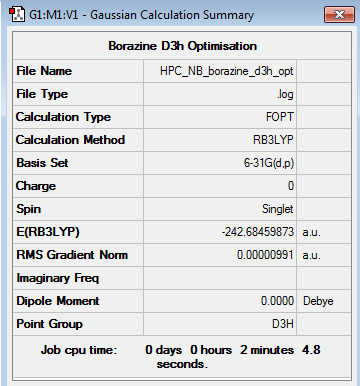
Borazine 6-31G Optimisation
Optimisation log file here
| Summary Data | Convergence | Jmol | |||
|---|---|---|---|---|---|
|
Item Value Threshold Converged? Maximum Force 0.000010 0.000015 YES RMS Force 0.000005 0.000010 YES Maximum Displacement 0.000056 0.000060 YES RMS Displacement 0.000018 0.000040 YES |
|
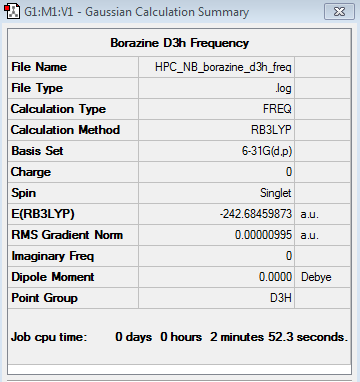
Borazine 6-31G Frequency Analysis
Frequency log file here
Low frequencies ---   -5.9490   -5.3365   -5.3347   -0.0035    0.0085    0.0179
Low frequencies ---  289.7252  289.7260  404.5242
| Summary Data | Convergence | Jmol | |||
|---|---|---|---|---|---|
|
Item Value Threshold Converged? Maximum Force 0.000032 0.000450 YES RMS Force 0.000010 0.000300 YES Maximum Displacement 0.000058 0.001800 YES RMS Displacement 0.000024 0.001200 YES |
|
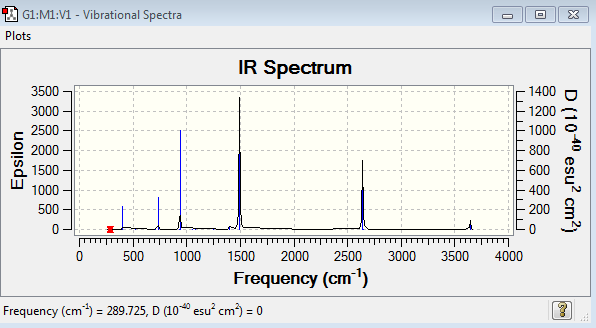
Borazine Vibrational Spectrum Analysis
| Wavenumber(cm-1) | Intensity | IR active? | Type |
| 290 | 0 | No | Bend |
| 290 | 0 | No | Bend |
| 405 | 24 | Yes - very weakly | Bend |
| 525 | 1 | No | Bend |
| 525 | 1 | No | Bend |
| 710 | 0 | No | Bend |
| 710 | 0 | No | Bend |
| 732 | 60 | Yes - medium | Bend |
| 865 | 0 | No | Bend |
| 928 | 0 | No | Bend |
| 928 | 0 | No | Bend |
| 937 | 236 | Yes - strongly | Bend |
| 945 | 0 | No | Bend |
| 945 | 0 | No | Stretch |
| 945 | 0 | No | Bend |
| 1052 | 0 | No | Bend |
| 1081 | 0 | No | Bend |
| 1081 | 0 | No | Bend |
| 1246 | 0 | No | Bend |
| 1314 | 0 | No | Bend |
| 1400 | 11 | Yes - very weakly | Bend |
| 1400 | 11 | Yes - very weakly | Bend |
| 1492 | 494 | Yes - very strongly | Bend |
| 1492 | 494 | Yes - medium | Bend |
| 2640 | 284 | No | Stretch |
| 2640 | 284 | No | Stretch |
| 2650 | 0 | No | Stretch |
| 3642 | 0 | No | Stretch |
| 3644 | 40 | Yes - medium | Stretch |
| 3644 | 40 | Yes - medium | Stretch |
Borazine NBO Analysis
Energy log file for NBO analysis here

| Atom | NBO Charge |
|---|---|
| N | -1.102 |
| B | 0.747 |
| H (on N) | 0.432 |
| H (on B) | -0.077 |
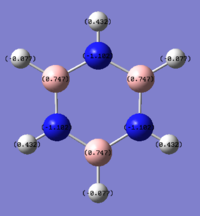
Charge Distribution Analysis
| Benzene | Boratabenzene | Pyridinium | Borazine |
|---|---|---|---|
|
|
|
|
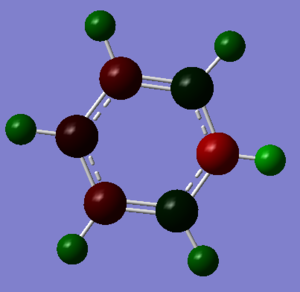
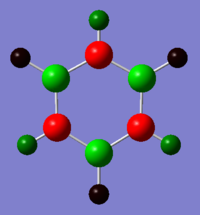
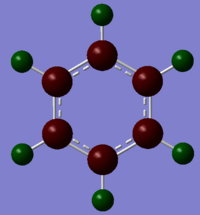
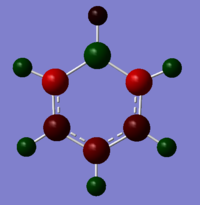
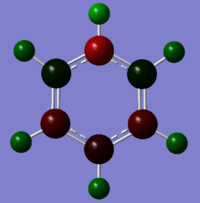
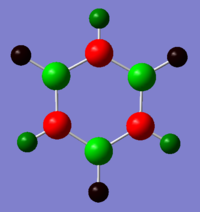
The atoms correspond to the images above, where the top atom is in the C1 position with the H attached labelled as H1, and the atom labels follow on clockwise.
| Atom | ||||||||||||
|---|---|---|---|---|---|---|---|---|---|---|---|---|
| C1 | C2 | C3 | C4 | C5 | C6 | H1 | H2 | H3 | H4 | H5 | H6 | |
| Benzene | -0.239 | -0.239 | -0.239 | -0.239 | -0.239 | -0.239 | 0.239 | 0.239 | 0.239 | 0.239 | 0.239 | 0.239 |
| Boratabenzene | 0.202 | -0.588 | -0.250 | -0.340 | -0.250 | -0.588 | -0.087 | 0.184 | 0.179 | 0.186 | 0.179 | 0.184 |
| Pyridinium | -0.476 | 0.071 | -0.241 | -0.122 | -0.241 | 0.071 | 0.483 | 0.285 | 0.297 | 0.292 | 0.297 | 0.285 |
| Borazine | -1.102 | 0.747 | -1.102 | 0.747 | -1.102 | 0.747 | 0.432 | -0.077 | 0.432 | -0.077 | 0.432 | -0.077 |
As benzene is a neutral molecule the overall change is expected to be 0. All carbon atoms are in the same environment in comparison to each other and all hydrogens are in the same environment in comparison to each other therefore every carbon will have the same charge and every hydrogen will have the same charge. As carbon is more electronegative than hydrogen, the carbons are negatively charged and the hydrogens are positively charged (equal in magnitude).
In boratabenzene, the substitution of C1 for electropositive boron changes the charges on the molecule. There are now 3 environments for the carbons (ortho, meta and para to the boron atom) and 4 hydrogen environments (bonded to the B, bonded to the ortho, meta and para carbon atoms). As boron is electropositive, it imparts electron density onto the ortho carbons giving them a negative charge of -0.588 in comparison to -0.239 in benzene. This effect of pushing the electrons has less of an impact on the meta carbons as they are further away and somewhat shielded by the ortho carbons, therefore their charges are only slightly more negative, -0.250, than those of the carbons in benzene. The para carbon is again more electronegative than the corresponding benzene molecule, as boron pushes electron density away this effect falls off with distance making the electronegativity less pronounced than that of the ortho carbons but in comparison to the meta carbons the para position is less shielded. The hydrogen in the H1 position is less electropositive compared to boron results in its negative charge. The charges on the hydrogens would be expected to become increasingly positive with increasing distance from the boron, but as witnessed before, the meta position hydrogens are slightly shielded by the ortho, causing them to be slightly less positive than expected; the para H3 hydrogen is the most positive. The sum of charges add to -1 as this is the overall charge of the molecule.
In pyridinium it is the opposite case. The electronegative nitrogen draws electron density towards it resulting in the ortho carbons having a positive charge. The shielding of the meta position by the ortho once again means the drawing of electrons from this position is reduced, resulting in the carbons being approximately as negative as in the benzene ring. The para carbon does not experience this shielding, but the electron withdrawing effect of the nitrogen falls off with distance resulting in the para carbon being slightly positive. The charges on the hydrogens depend on the charges of the atoms they are bonded to i.e. the H1 hydrogen bonded to the most electronegative atom in the ring, N, is the most electropositive.
For borazine all boron’s are in the same environment, all nitrogen’s are in the same environment and there are 2 environments for the hydrogens, either bonded to boron or nitrogen. The nitrogen’s are electronegative and withdraw electrons giving them a charge of -1.102. The boron’s are electropositive resulting in the positive charge of 0.747. The hydrogens on the nitrogen’s are positively charged as the nitrogen’s have an electron withdrawing effect, on the other hand the hydrogens bonded to the boron’s are electronegative in comparison leading to their charge being negative.
MO Analysis
| Benzene | Boratabenzene | Pyridinium | Borazine | |
|---|---|---|---|---|
| MO | 
|
|
|
|
| MO construction | 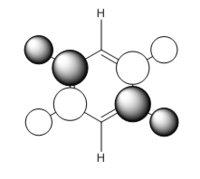
|

|
|

|
| Energy | -0.59736 | -0.36649 | -0.85982 | -0.52456 |
| Oribital Number | 11 | 10 | 11 | 12 |
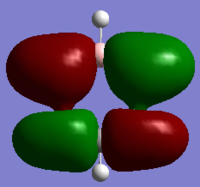
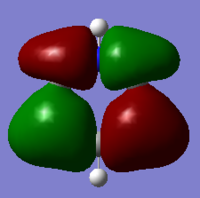
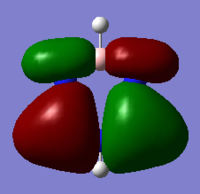
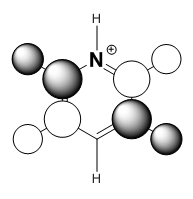
These MOs are bonding MOs composed of s orbitals. The patterns are the same but the positioning of the orbitals is slightly different on each molecule due to the substituent atoms. Each MO has two nodes, along the nodes the interactions are highly antibonding. The orbitals are all the same size on the benzene ring as the carbons are all of the same electronegativity, this is where the other molecules differ.
The boron on boratabenzene is electropositive in comparison to the ortho carbons, making the bond polar. In this instance the electrons density will be shifted towards the carbons as they are more electronegative, this makes the orbital more diffuse. For this reason the orbitals on the meta carbons are contracted with a higher electron density.
Nitrogen being electronegative draws electron density towards it in the pyridinium, making the orbitals on the ortho carbons more contracted and electron dense. The electron withdrawing effects are felt by the meta carbons thus making these orbitals more diffuse. In borazine the ortho nitrogens (in correspondence to the C1 atom) are electronegative and the meta borons are electropositive, therefore there is in theory a summation of effects – as the nitrogen's withdraw electrons from them, the boron's donate electrons making the nirtogen orbitals highly electron dense and the boron orbitals much more diffuse, in comparison to the carbon orbitals on benzene.
As expected the electropositivity of boron in boratabenzene causes an increase in the energy of the MOs. And the pyridinium is reduced in energy due to the nitrogen. This explains the ordering of energy for all MOs discussed.
| Benzene | Boratabenzene | Pyridinium | Borazine | |
|---|---|---|---|---|
| MO | 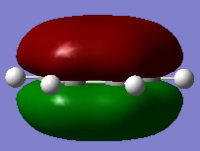
|
|
|
|
| MO construction | 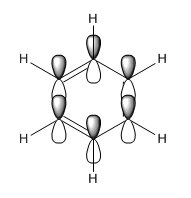
|
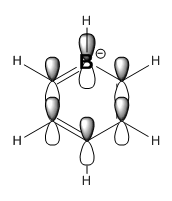
|
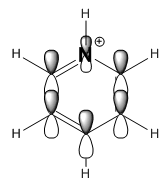
|
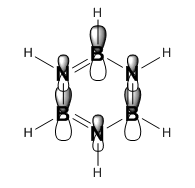
|
| Energy | -0.35994 | -0.13209 | -0.64062 | -0.36134 |
| Oribital Number | 17 | 17 | 17 | 17 |
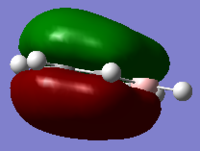
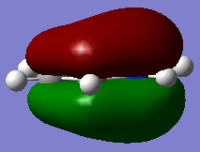
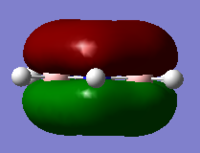
As can be seen for each molecule there is a nodal plane along the hydrogens. As the MO is composed of p orbitals there are no through space bonding interactions. For benzene the orbital shape is uniform due to carbons being in the same environment.
For boratabenzene the electron density is shifted towards the meta and para carbons, distorting the electron cloud. This is the opposite for the pyridinium where the nitrogen draws electron density towards itself. For borazine due to the polar nature of the N-B bonds which are equal in environments around the ring, the MO is uniform in shape like the benzene.
| Benzene | Boratabenzene | Pyridinium | Borazine | |
|---|---|---|---|---|
| MO | 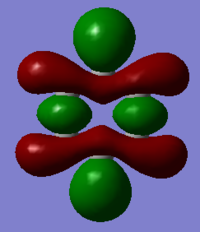
|
|
|
|
| MO construction | 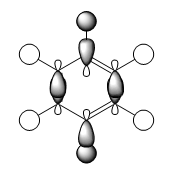
|
|
|
|
| Energy | -0.33960 | -0.09170 | -0.57433 | -0.31992 |
| Oribital Number | 18 | 18 | 19 | 19 |
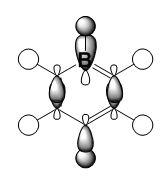
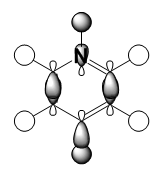
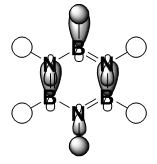
It should be noted that the MO constructions are produced using hybrid orbitals – this conceptually explains the shape of each MO but does not use the LCAO model.
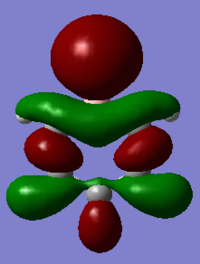
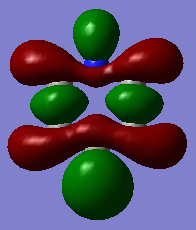
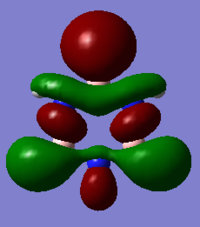
This MO has 4 nodal planes, which explains why it is higher in energy compared to the other MOs. In the centre of the ring there are through space bonding interactions (between the red orbitals and between the green orbitals). Due to the orientation of the C1 and C4 position carbon hybrid orbitals, there is better overlap with the hydrogen s orbital – this is why the orbital appears larger. By considering the MO construction diagram it can be seen the red orbitals are a result of through space bonding interactions (red orbitals are presented as the unshaded orbitals in the MO construction) in the molecule as opposed to direct overlap. This means in an MO diagram the splitting (ΔE) will be smaller, this provides an explanation as to why these MO’s are higher up in energy than the previous MOs discussed above.
For boratabenzene the through space bonding as discussed above is responsible for the green orbitals. The uppermost green orbital is larger due to the nature of the larger boron orbital. The orbital on C1 is considerably larger as there is much better overlap of the boron atom with the hydrogen s orbital it is bonded too.
For pyridinium the nitrogen orbital is smaller in comparison to the para carbon therefore it’s overlap with the attached hydrogen is poor, resulting in the smaller orbital – this in turn explains why the para carbon – hydrogen s orbital overlap has a larger orbital. In the centre of the molecule the effects of through space bonding between the green orbitals explain the slightly skewed shape.
The sizes of boron and nitrogen orbitals, larger and smaller in comparison to each other respectively, explains their overlap with the hydrogen s orbitals which results in the shapes at the C1 and C4 position. The lower green orbital formed as a result of through space interactions is larger than the uppermost due to the larger meta boron orbitals.
References
1) "Bond Lengths and Energies". Science.uwaterloo.ca. - http://www.science.uwaterloo.ca/~cchieh/cact/c120/bondel.html
2) Hunt Research Group - Year 3 Computational Lab - http://www.huntresearchgroup.org.uk/teaching/year3_lab_start.html

