Sg2317hf
BH3 optimisation
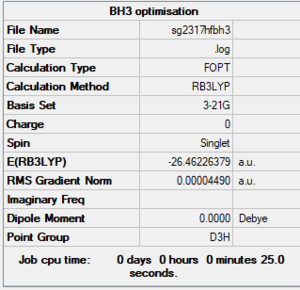
BH3: B3LYP/3-21G level
Summary
Item section of output
        Item               Value     Threshold  Converged?
Maximum Force            0.000090     0.000450     YES
RMS     Force            0.000059     0.000300     YES
Maximum Displacement     0.000351     0.001800     YES
RMS     Displacement     0.000230     0.001200     YES
Predicted change in Energy=-4.723230D-08
Optimization completed.
Link to log file
The optimisation file is linked to here
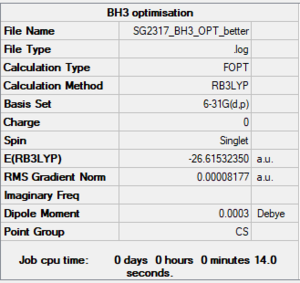
BH3 6-31G(d,p) level
Summary
Item section of output
        Item               Value     Threshold  Converged?
Maximum Force            0.000203     0.000450     YES
RMS     Force            0.000098     0.000300     YES
Maximum Displacement     0.000737     0.001800     YES
RMS     Displacement     0.000395     0.001200     YES
Predicted change in Energy=-1.355408D-07
Optimization completed.
Link to log file
The optimisation file is linked to here
Jmol image of optimised BH3
Optimised BH3 |
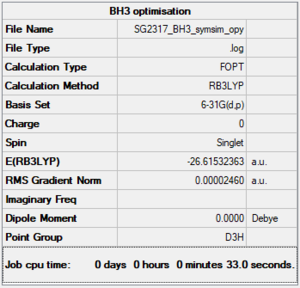
BH3 with D3h symmetry
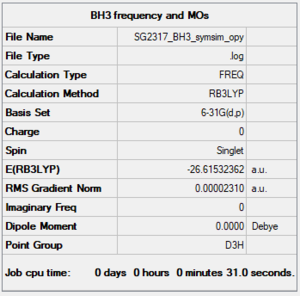
BH3 frequency analysis
Item section of file
        Item               Value     Threshold  Converged?
Maximum Force            0.000046     0.000450     YES
RMS     Force            0.000023     0.000300     YES
Maximum Displacement     0.000182     0.001800     YES
RMS     Displacement     0.000091     0.001200     YES
Predicted change in Energy=-1.259145D-08
Optimization completed.
Low frequencies
Low frequencies ---   -0.4072   -0.1962   -0.0055   25.2514   27.2430   27.2460
Low frequencies --- 1163.1897 1213.3128 1213.3155
Link to log file
The optimisation file is linked to here
Jmol image of optimised BH3
SG2317_BH3_OPT_1 |
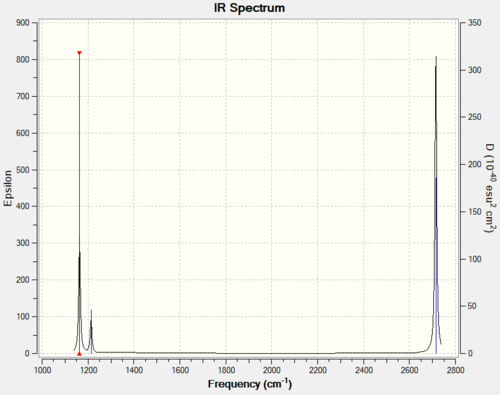
IR spectrum or BH3
Vibrational spectrum for BH3
| Wavenumber (cm-1 | Intensity (arbitrary units) | Symmetry | IR active? | Type |
| 1163 | 92 | A2 | yes | out-of-plane bend |
| 1213 | 14 | E' | slight | in-plane bend |
| 1213 | 14 | E' | slight | in-plane bend |
| 2582 | 0 | A'1 | no | totally symmetric stretch |
| 2714 | 126 | E' | yes | asymmetric stretch |
| 2714 | 126 | E' | yes | asymmetric stretch |
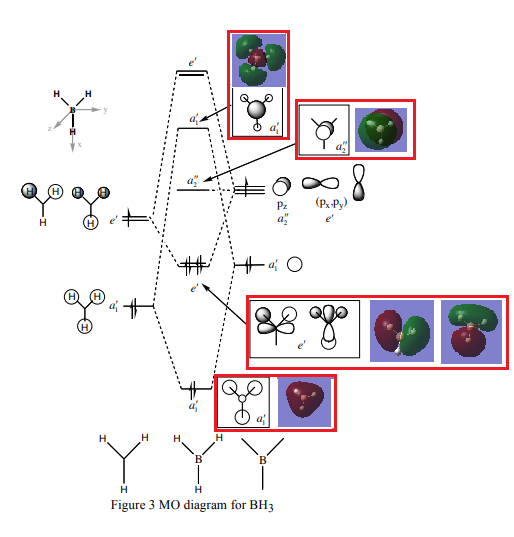
BH3 MO analysis
- ↑ This is the MO diagram for BH3 taken from Dr Hunt's handout. http://www.huntresearchgroup.org.uk/teaching/teaching_comp_lab_year2a/Tut_MO_diagram_BH3.pdf
Are there significant differences between the real and LCAO MOs?
In real MOs, molecular orbitals are delocalised throughout the whole molecule; whereas in the diagram above using LCAOs the orbitals are shown as individual contributions from each atom of B or H as localised molecular orbitals (aka canonical molecular orbitals). The LCAO orbitals also represent regions in a molecule where an electron occupying that orbital is to be found, however in reality the electron may not be there. [1]
- ↑ Information cited from https://en.wikipedia.org/wiki/Molecular_orbital
Ng611 (talk) 16:42, 4 June 2019 (BST) None of this is really incorrect, but the differences you point out are not really at all significant. Think about orbital contributions...
What does this say about the accuracy and usefulness of qualitative MO theory?
The molecular orbital wave function can be written as a weighted sum of each atomic orbital. Using:

The coefficients can be determined by substituting the sum into the Schrodinger equation and applying the variational principle. This quantifies the orbital contribution.
Overall, MO diagram can be used to make an accurate prediction for solutions to the Schrodinger equation. [1]
- ↑ Information cited from https://en.wikipedia.org/wiki/Molecular_orbital_theory
NH3 optimisation
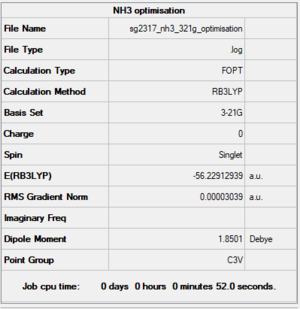
NH3 B3LYP/3-21G level
Summary
Item section of output
        Item               Value     Threshold  Converged?
Maximum Force            0.000057     0.000450     YES
RMS     Force            0.000038     0.000300     YES
Maximum Displacement     0.000145     0.001800     YES
RMS     Displacement     0.000096     0.001200     YES
Predicted change in Energy=-1.132410D-08
Optimization completed.
Link to log file
The optimisation file is linked to here
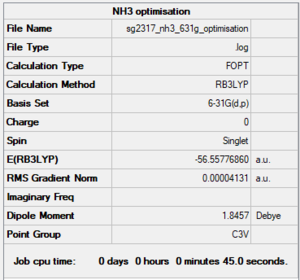
NH3 6-31G(d,p) level
Summary
Item section of output
        Item               Value     Threshold  Converged?
Maximum Force            0.000058     0.000450     YES
RMS     Force            0.000039     0.000300     YES
Maximum Displacement     0.000370     0.001800     YES
RMS     Displacement     0.000162     0.001200     YES
Predicted change in Energy=-2.215151D-08
Optimization completed.
Link to log file
The optimisation file is linked to here
Jmol image of optimised NH3
Optimised NH3 |
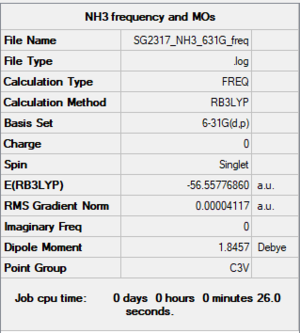
NH3 Frequency and MOs: 6-31G(d,p) level
Summary
Item section of output
        Item               Value     Threshold  Converged?
Maximum Force            0.000099     0.000450     YES
RMS     Force            0.000041     0.000300     YES
Maximum Displacement     0.000342     0.001800     YES
RMS     Displacement     0.000114     0.001200     YES
Predicted change in Energy=-2.170625D-08
Optimization completed.
Low frequencies
Low frequencies ---  -32.8801  -32.8674  -11.9107   -0.0036    0.0074    0.0513
Low frequencies --- 1088.6732 1694.0154 1694.0157
Link to log file
The optimisation file is linked to here
NH3BH3 optimisation
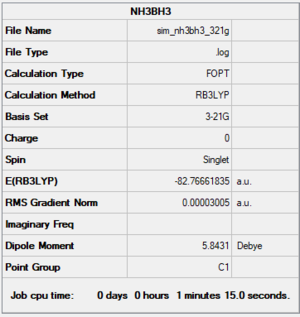
NH3BH3 B3LYP/(3-21G) level
Summary
Item section of output
        Item               Value     Threshold  Converged?
Maximum Force            0.000094     0.000450     YES
RMS     Force            0.000030     0.000300     YES
Maximum Displacement     0.000419     0.001800     YES
RMS     Displacement     0.000179     0.001200     YES
Predicted change in Energy=-5.743893D-08
Optimization completed.
Link to log file
The optimisation file is linked to here
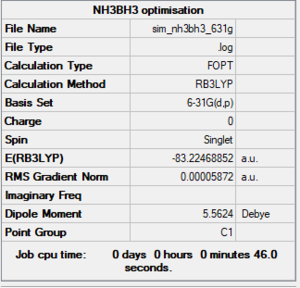
NH3BH3 6-31G(d,p) level
Summary
Item section of output
        Item               Value     Threshold  Converged?
Maximum Force            0.000137     0.000450     YES
RMS     Force            0.000038     0.000300     YES
Maximum Displacement     0.000989     0.001800     YES
RMS     Displacement     0.000393     0.001200     YES
Predicted change in Energy=-1.212361D-07
Optimization completed.
Link to log file
The optimisation file is linked to here
Jmol image of optimised NH3BH3
Optimised NH3BH3 |
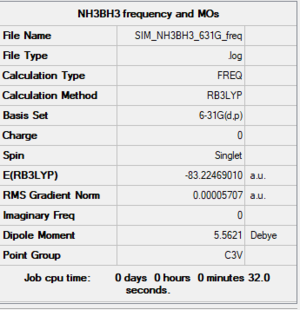
NH3BH3 Frequency and MOs: 6-31G(d,p) level
Summary
Item section of output
        Item               Value     Threshold  Converged?
Maximum Force            0.000260     0.000450     YES
RMS     Force            0.000057     0.000300     YES
Maximum Displacement     0.001414     0.001800     YES
RMS     Displacement     0.000342     0.001200     YES
Predicted change in Energy=-2.014452D-07
Optimization completed.
Low frequencies
Low frequencies ---   -0.1676   -0.0620   -0.0067   12.6988   16.2670   16.2765
Low frequencies ---  263.1439  631.3651  638.8717
Link to log file
The optimisation file is linked to here
Include a Jmol image of your optimised geometry in your wiki
What is your optimised N-I distance?
2.18363 au
Association energies calculations
| Molecule | Energy (arbitrary units) |
| NH3 | -56.6 |
| BH3 | -26.6 |
| NH3BH3 | -83.2 |
ΔE=E(NH3BH3)-[E(NH3)+E(BH3)]
ΔE=(-83.22469010) - [(-56.55776860)+(-26.61532362)]
ΔE= -0.05159788 au
ΔE= -134 kJ/mol
Ng611 (talk) 16:47, 4 June 2019 (BST) Correct values reported and correct answer in a.u., but you've reported the wrong final answer. Converting your a.u value myself, I get -135.4702442596 kJ/mol which rounds to -135 kJ/mol. You've either converted to kJ/mol incorrectly or written your answer down incorrectly.
Based on your energy calculation is the B-N bond weak, medium or strong? What comparison have you made to come to this conclusion?
It's a weak bond. The bond enthalpy to Al-N is 297 kJ/mol; it takes 163 kJ/mol less energy to break the B-N bond. The bond is made as a result of electron donation from the Nitrogen lone pair into the empty orbital of B. This is a dative covalent bond. The B-N bond is weaker than Al-N; this may be because the orbitals are more diffuse in Al as it is one period below B. As a result there is more efficient orbital overlap and a stronger bond. [1]
- ↑ Information cited from https://labs.chem.ucsb.edu/zakarian/armen/11---bonddissociationenergy.pdf
Ng611 (talk) 16:51, 4 June 2019 (BST) You should use a book source rather than a website.
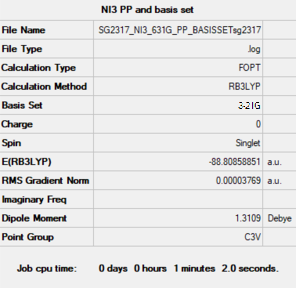
NI3
Summary
Item section of output
        Item               Value     Threshold  Converged?
Maximum Force            0.000066     0.000450     YES
RMS     Force            0.000044     0.000300     YES
Maximum Displacement     0.000480     0.001800     YES
RMS     Displacement     0.000327     0.001200     YES
Predicted change in Energy=-5.608968D-08
Optimization completed.
Link to log file
The optimisation file is linked to here
Jmol image of optimised NI3
Optimised NI3 |
Optimised N-I distance is 2.18396
Ionic liquids, designer solvents
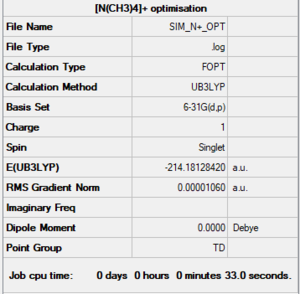
N[(CH3)4]+
Summary
Item section of output
        Item               Value     Threshold  Converged?
Maximum Force            0.000020     0.000450     YES
RMS     Force            0.000008     0.000300     YES
Maximum Displacement     0.000056     0.001800     YES
RMS     Displacement     0.000025     0.001200     YES
Predicted change in Energy=-7.411317D-09
Optimization completed.
Link to log file
The optimisation file is linked to here
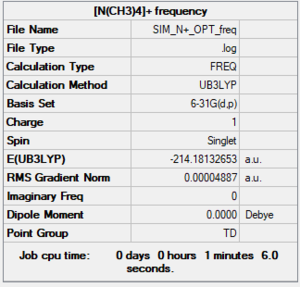
Summary for frequency
Item section of output
        Item               Value     Threshold  Converged?
Maximum Force            0.000097     0.000450     YES
RMS     Force            0.000049     0.000300     YES
Maximum Displacement     0.000882     0.001800     YES
RMS     Displacement     0.000487     0.001200     YES
Predicted change in Energy=-4.705137D-07
Optimization completed.
Low frequency
Low frequencies ---    0.0007    0.0007    0.0007   34.8305   34.8305   34.8305
Low frequencies ---  217.4553  316.5611  316.5611
Link to log file
The optimisation file is linked to here
Jmol image of optimised [N(CH3)4]+
Optimised [N(CH3)4]+ |
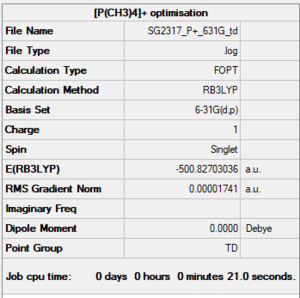
P[(CH3)4]+
Summary
Item section of output
        Item               Value     Threshold  Converged?
Maximum Force            0.000034     0.000450     YES
RMS     Force            0.000014     0.000300     YES
Maximum Displacement     0.000157     0.001800     YES
RMS     Displacement     0.000071     0.001200     YES
Predicted change in Energy=-3.029697D-08
Optimization completed.
Link to log file
The optimisation file is linked to here
Summary for frequency
Item section of output
        Item               Value     Threshold  Converged?
Maximum Force            0.000186     0.000450     YES
RMS     Force            0.000107     0.000300     YES
Maximum Displacement     0.001331     0.001800     YES
RMS     Displacement     0.000800     0.001200     YES
Predicted change in Energy=-1.314624D-06
Optimization completed.
Low frequency
Low frequencies ---   -0.0034   -0.0031   -0.0026   50.7931   50.7931   50.7931
Low frequencies ---  187.1415  211.9878  211.9878
Link to log file
The optimisation file is linked to here
Jmol image of optmisied [P(CH3)4]+
Optimised [P(CH3)4]+ |
Charge distribution analysis for [N(CH3)4]+ and [P(CH3)4]+
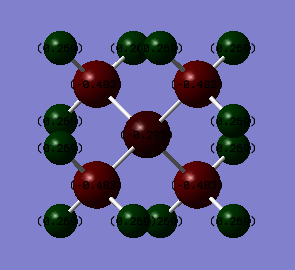
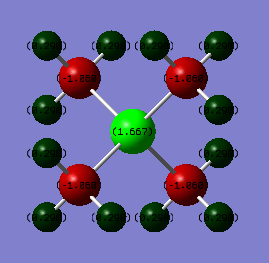
Charge on atoms
| Atom(s) | Charge in [P(CH3)4]+ | Charge in [N(CH3)4]+ |
| Heteroatom | 1.667 | -0.295 |
| C | -1.060 | -0.483 |
| H | 0.298 | 0.269 |
Discussion
In the charge analysis, the colour range was set from -1.7 to 1.7 for both atoms. This allows a more accurate comparison to be made. Although, it could be predicted that the molecules would have a similar charge distribution as they are similar in structure this is not the case.
Description: In [N(CH3)4]+, the charges are more delocalised; the H atoms have a positive charge and the heteroatom (N) and the C atoms have negative charges, with C being more negatively charged. But, in the [P(CH3)4]+, only the C atoms have negative charges, of which are significantly more negative than in [N(CH3)4]+, and the heteroatom (P) and the H atoms have positive charges. The P is very interesting in particular as it has a very positive localised charge.
Heteroatoms: N and P carry charges of the opposite sign. The N is negative, but the P is positive. N (3.04) is more electronegative than C (2.55), so you would expect more of a negative charge on the N atoms; however this is not the case because N participates n=in dative bonding and so has less electrons than expected and is "positive". P (2.19) is less electronegative than C (2.55), so there is more of a negative charge on C atoms. The C-heteroatom bonds are more polarised in [P(CH3)4]+. This is likely to be because N is so electronegative that it doesn't retain positive charge well, so the charges are more delocalised over the molecule. Because P is one period below N , P orbitals are more diffuse, and the positive charge is more spread over the molecule, this can lead to the negative charges to be lower in magnitude on the C atoms in [P(CH3)4]+ than in [N(CH3)4]+.
Carbon atoms: In both molecules, the C atoms are negative (less so in [P(CH3)4]+ due to the stabilisation from the positive charge on the P)
Hydrogen atoms: In both molecules, the H atoms are positive. There isn't significant difference in magnitude of these charges either; this is likely to be because the effect of electronegativity falls with distance.
Ng611 (talk) 16:54, 4 June 2019 (BST) Good discussion. Taking into account the overall dipole moment, what can you say about the symmetry of the charge distribution?
Questions to answer
What does the "formal" positive charge on the N represent in the traditional picture?
If we draw the Lewis structure of [N(CH3)4]+, a positive charge arises. This is because N has 5 valence electrons; 3 of the bonds to methyl groups are due to covalent bonds but, one of the C-N is a dative covalent bond arising from donation of the lone pair on N. There are now less electrons than expected on the N and the positive charge demonstrates this.
On what atoms is the positive charge actually located for this cation?
The positive charge is delocalised over the N and the C.
Ng611 (talk) 16:53, 4 June 2019 (BST) A reasonable discussion about the formal charge system.
Molecular orbitals
MO 6
Here there are bonding interactions between S orbitals on the C atoms in each methyl, each H and the N atom.
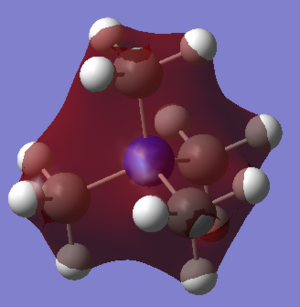
MO 10
There are bonding interactions between the s orbitals on the H atoms and the S orbitals of the N atom. And the p orbitals of the C; this is because the nodes cut through the C atoms - this is what happens with p orbitals. There is some anti-bonding character between space; represented by the red and green areas being close.
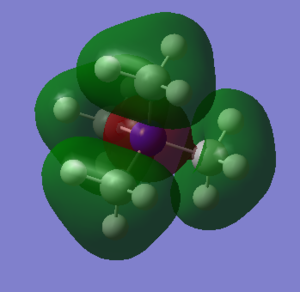
MO 18
There is anti-bonding character through space and at each methyl group. The MO is a result of mixing of only 2 of the 3 s orbitals from H on each methyl. They are mixing with p orbitals on C. This can be demonstrated because there are nodes on each C.

Ng611 (talk) 16:55, 4 June 2019 (BST) Good LCAO analysis!
Comments
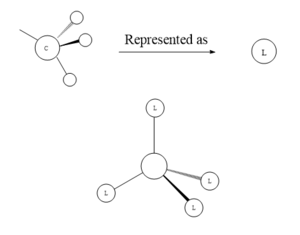
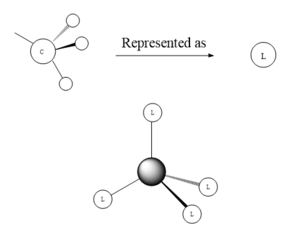
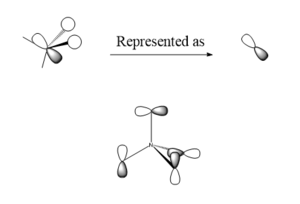
It is interesting how in MO18 only 2 of the H atoms per methyl group have orbitals participating. The 3rd H has no orbitals contributing. Furthermore, the MO diagram can be constructed with help of the BH3 MO; as the MO from that diagram can be used to help represent each methyl group mixing with the N atom here.

