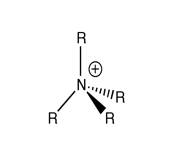
Rep:Mod:zc1111
Third Year Computational Lab- Part 1
EX3 Section
Geometry Information
| BH3 | BBr3 | GaBr3 | |
|---|---|---|---|
| r(E-X) | 1.19 | 1.93 | 2.28 |
| θ(X-E-X) | 120.0 | 120.0 | 120.0 |
When comparing structures, it is important to define the terms we use to describe the simiarities and differences. I shall starts with explaining what a bond is. A bond can be thought of to be a distribition of electron density and is the sum of all orbital contributions where the molecular orbitals are delocalised[2]>, There are three main types of bonding, ionic, covalent and metallic, howeever we can also have covalent bonds with ionic character and vice versa. There are also weaker types of bonds such as hydrogen bonding, dispersion forces to name a few. Traditional theory depicts bonds as 2c-2e shown through a solid line between the atoms. This doesn't tell us much about the hybridisation of the orbitals and their relative contributions. While valence bond theory is useful for small molecules, MO theory tells us more about the electron distribution and the orbital shapes and contributions. Gaussview sometimes doesnt draw in the bonds where we would expect them, however this doesnt mean the bond is not there, it simply means that the bond length is outside the calibrated range and so Gaussview considers the two atoms not to be bonded.
For comparison of bond strengths, the terms weak, medium and strong ca be used for relative comparison. The bond strength can be quantified by looking at the bond dissociation energy and comparing to similar molecules either by type of bond, or with only the central atom or ligand changed. For example, C-H, C-Br, C-F, where the C-F bond can be considered strong at 490 kj/mol, the C-H bond medium at 410 kj/mol and C-Br weak at 285 kj/mol. [5].
Comparing BX3 we can see the B-H has a shorter bond distance than B-Br. This is due to the fact that Br is in period 3 and has a much larger atomic radius, resulting in relatively poor orbital overlap compared to B-H. This results in the formation of the longer, weaker B-Br bonds. Bond angle is not affected and remains 120.0 throughout.
Comparing MX3 we can see that Ga-Br is a longer weaker bond than B-Br. Again this is due to poor orbital overlap as Ga is much larger than B and forms longer, weaker bonds with Br. Changing the ligand increases the bond length, the larger the ligand the longer the bond length as B-Br bond length is larger than B-H. This can be rationalised using the fact that Br has more electrons that H and so the atoms must be further spsrt to reduce the repulsion between the bonding electrons and the electrons on Br. H and Br are very different as H is smaller with a smaller van der waals radius and is also less electronegative than Br at 2.04 compared to Br's 2.96 on the Pauling scale.
Changing the central atom changes the bond length as the larger the central atom, the larger the bond length due to the increased van der waals radius of the larger central atom. This is shown when changing B to Ga. Both are in Group 3 of the periodic table, howeever Ga is further down rhe group and is larger than B due to the increase in the number of elecrons. It therefore has a larger van der waals radii. B is more electronegative than Ga at 2.96 compared to 1.81 (Pauling scale).
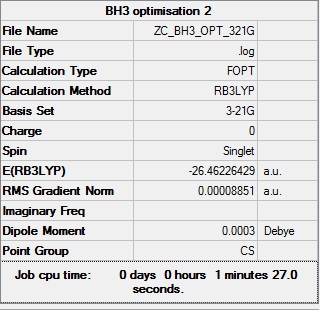
BH3:B3LYP/3-21G
Optimization log file
The optimisation log file can be found here
As you can see a better optimisation is needed as the point group is Cs and the optimised molecule must have the correct point group. A better basis set is needed.
BH3:B3LYP/6-31G (d,p)
The optimisation log file can be found here
| Geometry | Summary Data | Convergence Table | Jmol | |||
|---|---|---|---|---|---|---|
| Cs | 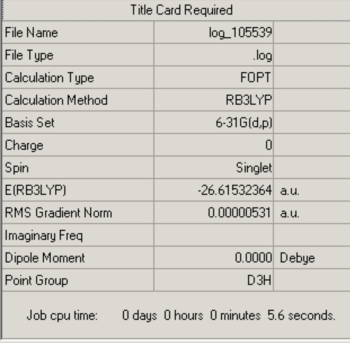
|
Item Value Threshold Converged? Maximum Force 0.000012 0.000450 YES RMS Force 0.000008 0.000300 YES Maximum Displacement 0.000055 0.001800 YES RMS Displacement 0.000039 0.001200 YES |
|
GaBr3:B3LYP/LANL2DZ
Optimization log file
The optimisation log file can be found here DOI:10042/193878 GaBr3 opt link
| Geometry | Summary Data | Convergence Table | Jmol | |||
|---|---|---|---|---|---|---|
| D3h | 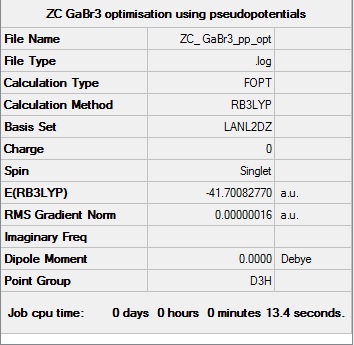 |
  Item                     Value     Threshold  Converged?
  Maximum Force            0.000000     0.000450     YES
  RMS     Force            0.000000     0.000300     YES
  Maximum Displacement     0.000003     0.001800     YES
  RMS     Displacement     0.000002     0.001200     YES
  Predicted change in Energy=-1.307633D-12
  Optimization completed.
    -- Stationary point found.
|
|
BBr3:B3LYP/6-31G(d,p)LANL2DZ
Optimization log file
The optimisation log file can be found here DOI:10042/193966
| Geometry | Summary Data | Convergence Table | Jmol | |||
|---|---|---|---|---|---|---|
| Cs | 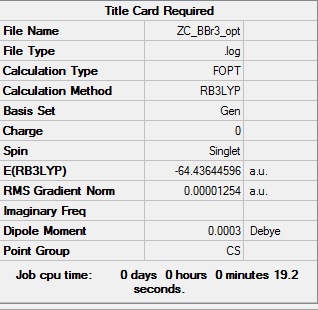 |
  Item               Value     Threshold  Converged?
 Maximum Force            0.000028     0.000450     YES
 RMS     Force            0.000011     0.000300     YES
 Maximum Displacement     0.000141     0.001800     YES
 RMS     Displacement     0.000075     0.001200     YES
 Predicted change in Energy=-3.051534D-09
 Optimization completed.
    -- Stationary point found.
|
|
Further Optimisation
The optimisation log file can be found here D-SPace DOI:10042/193965
| Geometry | Summary Data | Convergence Table | Jmol | |||
|---|---|---|---|---|---|---|
| D3h | 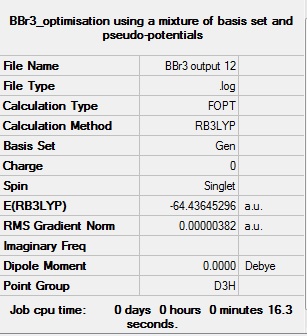 |
  Item               Value     Threshold  Converged?
 Maximum Force            0.000008     0.000450     YES
 RMS     Force            0.000005     0.000300     YES
 Maximum Displacement     0.000036     0.001800     YES
 RMS     Displacement     0.000023     0.001200     YES
 Predicted change in Energy=-4.027615D-10
 Optimization completed.
    -- Stationary point found.
|
|
BH3 Frequency Analysis:B3LYP/6-31G(d,p)
Frequency file: here
| summary data | low modes |
|---|---|

|
Low frequencies --- -14.5183 -14.5142 -10.8197 0.0010 0.0169 0.3454 Low frequencies --- 1162.9508 1213.1230 1213.1232 |
Vibrational spectrum for BH3
| wavenumber | Intensity | IR active? | type |
| 1162 | 93 | yes | bend |
| 1213 | 14 | very slight | bend |
| 1213 | 14 | very slight | bend |
| 2583 | 0 | no | stretch |
| 2716 | 126 | yes | stretch |
| 2716 | 126 | yes | stretch |
In the spectrum,only 3 vibrational peaks are observed even though there are 6 vibrations in total. The vibration at the frequency of 2583 cm-1 was not observed as it is not IR active.It is a stretch along 3 B-H bonds where the dipole moments cancels each other out and giving rise to zero intensity. For it to be seen there needs to be a change in dipole moment of the molecule and as the molecule is trigonal planar, D3h, the stretches that do not break the symmetry are not observed in the spectrum. The vibration at 1162cm-1 is an umbrella bend, the two vibrations at 1213 cm-1 that are due to bending are degenerate and give rise to a single peak and the two vibrations at 2716 cm-1 that are due to stretching are degenerate and give rise to a single peak.
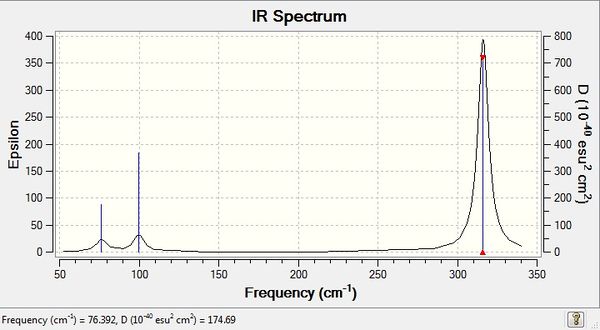
GaBr3 Frequency Analysis
Frequency file: here D Space DOI:10042/193967
| summary data | low modes |
|---|---|

|
Low frequencies --- -1.4878 -0.0015 -0.0002 0.0096 0.6540 0.6540 Low frequencies --- 76.3920 76.3924 99.6767 |
Vibrational spectrum for GaBr3
| wavenumber | Intensity | IR active? | type |
| 76 | 3 | yes | bend |
| 76 | 3 | very slight | bend |
| 100 | 9 | very slight | bend |
| 197 | 0 | no | stretch |
| 316 | 57 | yes | stretch |
| 316 | 57 | yes | stretch |
Similar to BH3, 3 vibrational peaks are observed when there are 6 vibrations in total. The vibration at frequency 197 cm-1 was not observed as it is not IR active. This is because the asymmetric stretch of all 3 Ga-Br bonds in the trigonal planar, D3h molecule leads to zero change in the molecule's dipole moment and the dipole moments cancel each other out and the molecule is IR inactive. The two vibrations at 76 cm-1 resulting from bending are degenerate and give rise to a single peak. The two vibrations at 316 cm-1 resulting from stretching are degenerate and give rise to a single peak in the spectrum.
Q:What does the large difference in the value of the frequencies for BH3 compared to GaBr3 indicate?
The values of frequencies for BH3 are in the range of 1162-2716 cm-1 while the values of frequencies for GaBr3 are in the range of 76 to 316 cm-1.The large difference in values for BH3 compared to GaBr3 indicate that there is greater displacement from the latter. GaBr3 has heavier atoms and thus has a greater reduced mass and lower vibrational frequency compared to BH3. Furthermore, due to the fact that B-H has stronger bonds and greater bond dissociation energy than Ga-Br, it follows that it has greater stiffness constant k and this higher vibrational frequency for a given mode ass according to the simple harmonic motion V=1/2π √(k/µ) , frequency of vibration (V) is proportional to the bond stiffness constant (k) and inversely proportional to the reduced mass (µ).
Q:Looking at the displacement vectors how has the nature of the vibration changed? Why?
The nature of the vibration has changed as for BH3 the H is the lighter element and thus undergoes umbrella motion, not the central element B. In GaBr3 it is the central element, Ga that is the lighter element and this undergoes umbrella motion.
Q: There been a reordering of modes! This can be seen particularly in relation to the A2" umbrella motion. Compare the relative frequency and intensity of the umbrella motion for the two molecules.
The reordering of modes can be rationalised considering the relative frequency and intensity of the umbrella motion for the two molecules. GaBr3 has lower intensity for the umbrella motion than BH3 due to the fact that Ga is heavier than H. Looking at the bending motions, the intensity is low for both as this involves bringing the atoms together, which leads to repulsion.
Q:Why must you use the same method and basis set for both the optimisation and frequency analysis calculations?
It is important to use the same basis set for both the optimisation and frequency analysis to maintain the same levels of accuracy throughout the analysis so that the conclusions drawn are not due to differences in basis set used.
Q:What is the purpose of carrying out a frequency analysis?
Frequency analysis allows us to compute the vibrations for the molecule and visualise the bends and stretches and compute a spectrum from the data. It also allows us to confirm that the optimisation was successful and that a minimum structure has been reached. The presence of negative frequencies indicate that this is not the case, as a maximum point is present and that the optimisation was not successful.
Q:What do the "Low frequencies" represent?
Low frequencies represent the -6 part of 3N-6 vibrational modes for non linear molecules. They are rotations or translations that must be subtracted to obtain the 3N possible vibrations for every degree of freedom. The closer the value to zero, the more accurate the data.
BH3Molecular Orbitals
D Space DOI:10042/193968

We can see that the real MOs differ from the LCAO MOs.LCAO MOs do not show the interaction between the orbitals and so there is no distortion in their shape. On the other hand real Mos do show the interactions between the orbitals and the degree of bonding overlap and hence we see distortion: bonding interactions occuring through the orbital ovelaps and antibonding when electron density decreases to the point where there is a nodal plane between nuclei. Real MOs help visualize the actual electron density and orbital shape whereas qualitative MO theory often over/underestimates contributions and LCAO Mos do not take into account the interactions between orbitals. With that said, they are a useful tool for small molecules and are good for providing a rough idea.
NH3 NBO Analysis
NH3:B3LYP/6-31G (d,p)
The optimisation log file can be found here
| Geometry | Summary Data | Convergence Table | Jmol | |||
|---|---|---|---|---|---|---|
| C3v | 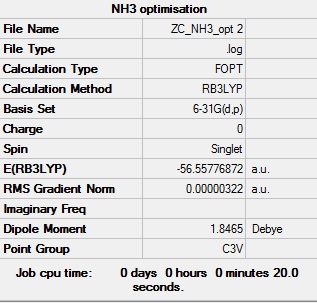 |
Item               Value     Threshold  Converged?
 Maximum Force            0.000006     0.000450     YES
 RMS     Force            0.000004     0.000300     YES
 Maximum Displacement     0.000016     0.001800     YES
 RMS     Displacement     0.000011     0.001200     YES
 Predicted change in Energy=-1.228228D-10
 Optimization completed.
    -- Stationary point found.
|
|
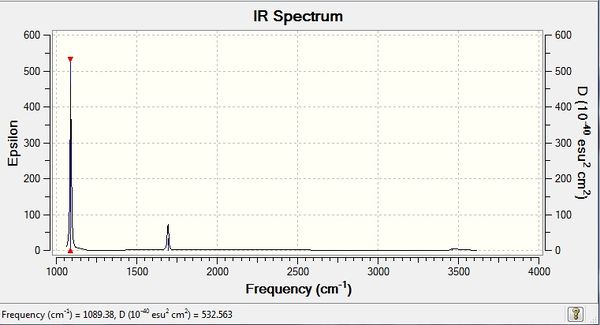
NH3 Frequency Analysis:B3LYP/6-31G(d,p)
Frequency file: here
| summary data | low modes |
|---|---|
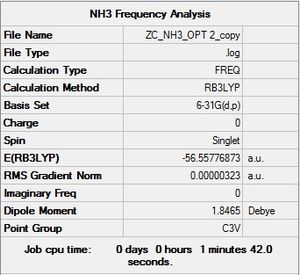
|
Low frequencies --- -0.0129 -0.0027 0.0005 7.0724 8.1020 8.1023 Low frequencies --- 1089.3849 1693.9369 1693.9369 |
Vibrational spectrum for NH3
| wavenumber | Intensity | IR active? | type |
| 1089 | 145 | yes | bend |
| 1694 | 14 | slight | bend |
| 1694 | 14 | slight | bend |
| 3461 | 1 | no | stretch |
| 3590 | 0 | no | stretch |
| 3590 | 0 | no | stretch |
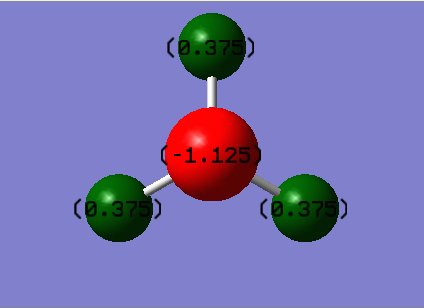
NBO Analysis
Population analysis log file here D-Space: DOI:10042/194025
Summary of Natural Population Analysis:

                                      Natural Population
               Natural  -----------------------------------------------
   Atom  No    Charge         Core      Valence    Rydberg      Total
-----------------------------------------------------------------------
     N    1   -1.12514      1.99982     6.11104    0.01429     8.12514
     H    2    0.37505      0.00000     0.62250    0.00246     0.62495
     H    3    0.37505      0.00000     0.62250    0.00246     0.62495
     H    4    0.37505      0.00000     0.62250    0.00246     0.62495
=======================================================================
  * Total *    0.00000      1.99982     7.97852    0.02166    10.00000
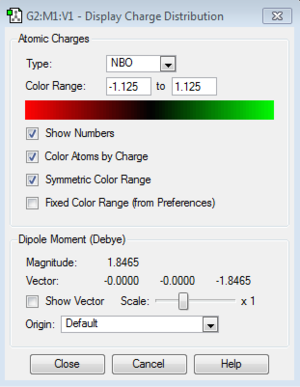
Atom N and H have respective charge distributions -1.125 and 0.375.
NH3BH3:B3LYP/6-31G(d,p) level
Optimisation log file here D-space: DOI:10042/194022
| Geometry | Summary Data | Convergence Table | Jmol | |||
|---|---|---|---|---|---|---|
| C3v | 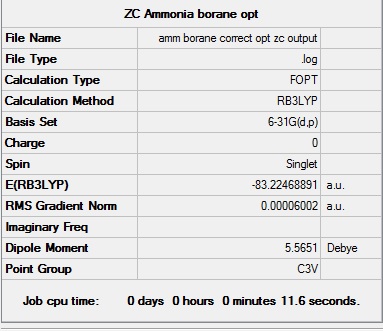 | |
|
Item Value Threshold Converged? Maximum Force 0.000002 0.000015 YES RMS Force 0.000001 0.000010 YES Maximum Displacement 0.000016 0.000060 YES RMS Displacement 0.000007 0.000040 YES |
|
NH3BH3 frequency analysis: B3LYP/6-31G(d,p)
Frequency analysis log file here D-Space: DOI:10042/194023
| Geometry | Summary Data | Summary Table | Low Frequencies |
|---|---|---|---|
| C3v | 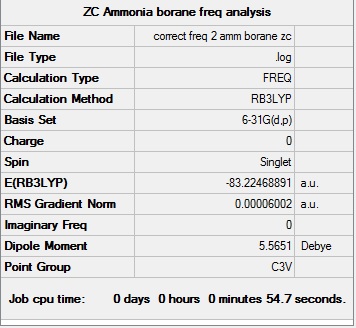 | |
|
Low frequencies --- -5.5821 -0.2698 -0.0388 0.0008 1.3925 1.4497 Low frequencies --- 263.2918 632.9559 638.4632 |
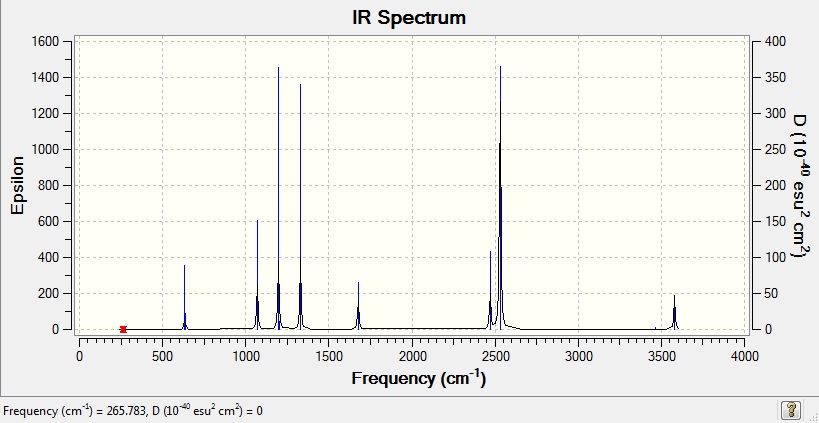
Vibrational spectrum for NH3BH3
| Wavenumber (cm-1) | Intensity | IR active? | Type |
| 266 | 0 | no | bend |
| 632 | 14 | slight | stretch |
| 639 | 4 | very slight | bend |
| 639 | 4 | very slight | bend |
| 1069 | 41 | yes | bend |
| 1069 | 41 | yes | bend |
| 1196 | 109 | yes | bend |
| 1204 | 3 | very slight | bend |
| 1204 | 3 | very slight | bend |
| 1329 | 114 | yes | bend |
| 1676 | 28 | slight | bend |
| 1676 | 28 | slight | bend |
| 2470 | 67 | yes | stretch |
| 2530 | 231 | yes | stretch |
| 2530 | 231 | yes | stretch |
| 3463 | 3 | very slight | stretch |
| 3580 | 28 | slight | stretch |
| 3580 | 28 | slight | stretch |
Dissociation Energy of the NH3BH3 bond
E(NH3)=-56.5577687 a.u.
E(BH3)=-26.6153236 a.u.
E(NH3BH3)=-83.2246891 a.u.
ΔE=E(NH3BH3)-[E(NH3)+E(BH3)]=-0.0515968 a.u.=-135.47 kJ/mol
NH3BH3 has bond strength in between a strong bond like a covalent and weak bond like a hydrogen bond- thus is is a medium bond. The figure obtained is in the right ballpark for a bond energy and we would expect a range between 100-500 kj/mol[4] for a covalent single bond and the figure here is in the right ballpark.
Comment on the dissociation energy
B and N are in the same period of the periodic table and are very similar in size.N is more electronegative than B and this difference contributes some ionic character to the B-N bond which decreases the valence orbital overlap.
Third Year Computational Lab- Part 2: Designer Solvents Mini Project
Ionic Liquids are liquids that comprise of ions. In this project, I shall be utilising computational methods to investigate properties of a selection of cations first through changing the central element, and then in the second part I shall look at the effect of adding electron donating and electron withdrawing groups.
Comparison of Onium Cations
| [N(Me)4]+ | [P(Me)4]+ | [S(Me)3]+ | |
|---|---|---|---|
| r(E-Me)/Å | 1.51 | 1.82 | 1.82 |
| r(C-H)/Å | 1.09 | 1.09 | 1.09 |
| θ(Me-E-Me)/° | 110.0 | 109.0 | 102.7 |
| θ(H-C-H)/° | 109.5 | 109.5 | 109.4 |
As you can see varying the central atom doesn't change the C-H bond length. The N-C bond is the shortest because N atom is the smallest atom and has shorter covalent radius- therefore it forms shorter and stronger bonds. P-C bond and S-C bond are in the same period of the periodic table and have roughly the same value for bond length. P and S atoms are both larger than N with larger covalent radii and so form longer and weaker bonds. As for the bond angles, the Me-E-Me bond angles are typical for tetrahedral molecules for both [P(Me)4]+ and [N(Me)4]+and as for [S(Me)3]+ the bond angle is smaller. This molecule adopts a trigonal pyramidal structure due to the lone pair on the S. The H-C-H bond angles are roughly the same for all three molecules as there is no distortion in the tetrahedral methyl groups.
[N(Me)4]+:B3LYP/6-31G (d,p)
The optimisation log file can be found here D-Space:DOI:10042/194005
| Geometry | Summary Data | Convergence Table | Jmol | |||
|---|---|---|---|---|---|---|
| Td | 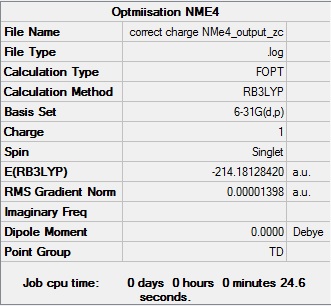 |
Item               Value     Threshold  Converged?
 Maximum Force            0.000023     0.000450     YES
 RMS     Force            0.000007     0.000300     YES
 Maximum Displacement     0.000042     0.001800     YES
 RMS     Displacement     0.000017     0.001200     YES
 Predicted change in Energy=-7.302671D-09
 Optimization completed.
    -- Stationary point found.
|
|
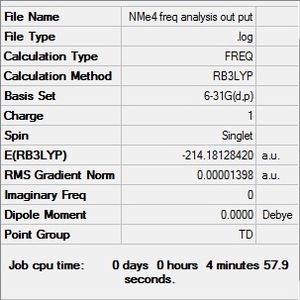
B3LYP/6-31G(d,p)level
Frequency file: here D-Space:DOI:10042/194008
| summary data | low modes |
|---|---|
|
Low frequencies --- -0.0010 -0.0005 -0.0003 21.5583 21.5583 21.5583 Low frequencies --- 188.3214 292.5082 292.5082 |
B3LYP/6-31G(d,p)level
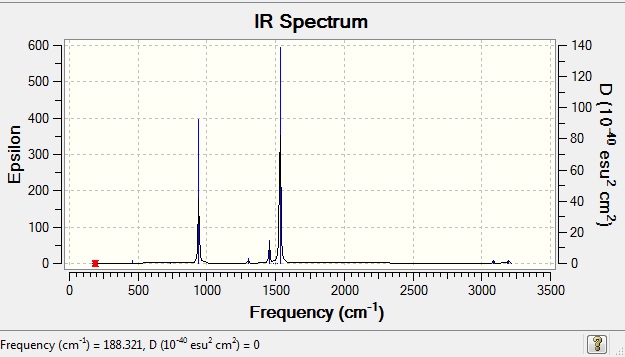
Vibrational Data
| wavenumber | Intensity | IR active? | type |
| 188 | 0 | no | bend |
| 293 | 0 | no | bend |
| 293 | 0 | no | bend |
| 293 | 0 | no | bend |
| 362 | 0 | no | bend |
| 362 | 0 | no | bend |
| 456 | 0 | no | bend |
| 456 | 0 | no | bend |
| 456 | 0 | no | bend |
| 736 | 0 | no | symmetric stretch |
| 941 | 22 | yes (very slight) | bend |
| 941 | 22 | yes (very slight) | bend |
| 941 | 22 | yes (very slight) | bend |
| 1078 | 0 | no | bend |
| 1078 | 0 | no | bend |
| 1078 | 0 | no | bend |
| 1185 | 0 | no | bend |
| 1185 | 0 | no | bend |
| 1306 | 11 | yes (very slight) | bend |
| 1306 | 11 | yes (very slight) | bend |
| 1306 | 11 | yes (very slight) | bend |
| 1456 | 5 | yes (very slight) | bend |
| 1456 | 5 | yes (very slight) | bend |
| 1456 | 5 | yes (very slight) | bend |
| 1487 | 0 | no | bend |
| 1487 | 0 | no | bend |
| 1487 | 0 | no | bend |
| 1502 | 0 | no | bend |
| 1502 | 0 | no | bend |
| 1512 | 0 | no | bend |
| 1532 | 54 | yes | bend |
| 1532 | 54 | yes | bend |
| 1532 | 54 | yes | bend |
| 3087 | 1 | yes (very slight) | stretch (antisymmetric) |
| 3087 | 1 | yes (very slight) | stretch (antisymmetric) |
| 3096 | 0 | no | symmetrical stretch |
| 3189 | 0 | no | symmetrical stretch |
| 3189 | 0 | no | symmetrical stretch |
| 3189 | 0 | no | symmetrical stretch |
| 3190 | 0 | no | symmetrical stretch |
| 3195 | 1 | yes (very very slight) | symmetrical stretch |
| 3195 | 1 | yes (very very slight) | symmetrical stretch |
| 3195 | 1 | yes (very very slight) | symmetrical stretch |
IR spectrum
MO Analysis
| Orbitals | Comments | |
|---|---|---|
 |
This is completely bonding.
The molecular orbital is completely delocalised and the interactions are completely bonding. The interactions are very strong, as there are no nodes and great overlap. The high electronegativity of the central element (nitrogen), means it pulls the electron density more into itself, and hence the orbital is more concave. S-orbitals are responsible for the bonding interactions. || | |
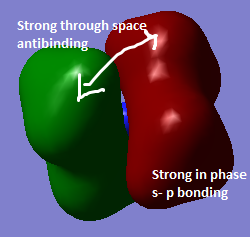 |
There is strong s-p overlap and 1 internuclear plane at the nitrogen atom. There is less overlap between the orbitals resulting in some strong through space antibonding interactions. Contribution from s orbitals from C and H and p-orbitals from N to bonding. | |
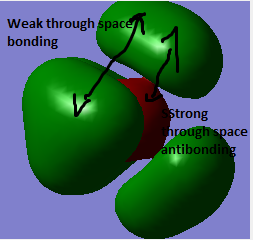 |
4 nodal planes on each C atom. This orbital has poor overlap between the orbitals which makes it less bonding, However there is strong overlap in the green region resulting in weak through space bonding interactions. | |
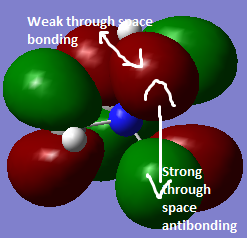 |
This orbital is less delocalised due to less overlap between the orbitals, relative to orbital's 1 and 2 and hence it is less bonding.However there is some overlap in the green and red regions. | |
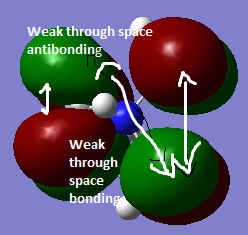 |
Due to the addition of more nodes, this MO is the least bonding compared to the orbitals above. However, nodal planes contribute less to the antibonding nature of the MO. The level of bonding is relatively less because the main contributions to the bonding is from p-p overlap. There is less s- contribution, therefore not as strong bonding as in the MO's above.This orbital is also less delocalised due to less overlap between the orbitals compared to the orbitals above, so it is the least bonding. |
Pop analysis file
D Space:DOI:10042/150542
[P(Me)4]+
B3LYP/6-31G(d,p)level
Optimisation Log file: here D-Space: DOI:10042/194010
| Geometry | Summary Data | Convergence Table | Jmol | |||
|---|---|---|---|---|---|---|
| Td | 
|
Item Value Threshold Converged? Maximum Force 0.000000 0.000015 YES RMS Force 0.000000 0.000010 YES Maximum Displacement 0.000001 0.000060 YES RMS Displacement 0.000000 0.000040 YES |
|
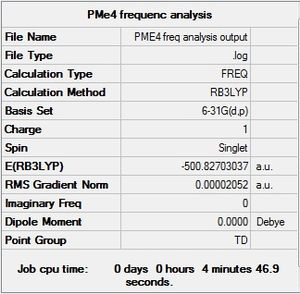
B3LYP/6-31G(d,p)level
Frequency file: here D-Space DOI:10042/194011
| summary data | low modes |
|---|---|
|
Low frequencies --- -0.0009 0.0027 0.0030 24.3438 24.3438 24.3439 Low frequencies --- 159.2180 194.1231 194.1231 |
IR Analysis
Vibrational data
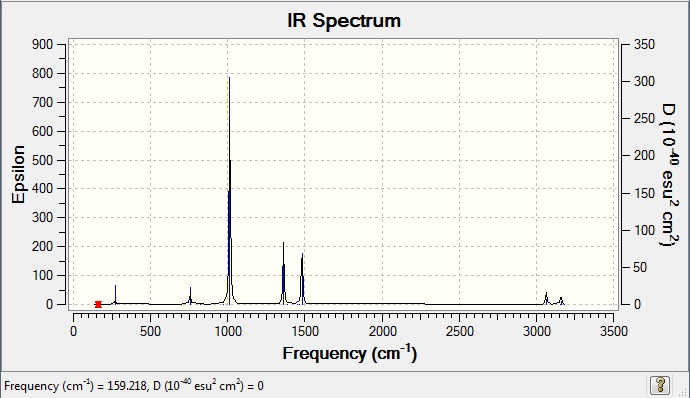
| wavenumber | Intensity | IR active? | type |
| 160 | 0 | no | bend |
| 195 | 0 | no | bend |
| 195 | 0 | no | bend |
| 195 | 0 | no | bend |
| 223 | 0 | no | bend |
| 223 | 0 | no | bend |
| 271 | 2 | yes (very very slight) | bend |
| 271 | 2 | yes (very very slight) | bend |
| 271 | 2 | yes (very very slight) | bend |
| 615 | 0 | no | symmetrical stretch |
| 756 | 4 | yes (very very slight) | bend |
| 756 | 4 | yes (very very slight) | bend |
| 756 | 4 | yes (very very slight) | bend |
| 824 | 0 | no | bend |
| 824 | 0 | no | bend |
| 824 | 0 | no | bend |
| 973 | 0 | no | bend |
| 973 | 0 | no | bend |
| 1013 | 78 | yes | bend |
| 1013 | 78 | yes | bend |
| 1013 | 78 | yes | bend |
| 1362 | 21 | yes | bend |
| 1362 | 21 | yes | bend |
| 1362 | 21 | yes | bend |
| 1389 | 0 | no | bend |
| 1454 | 0 | no | bend |
| 1454 | 0 | no | bend |
| 1454 | 0 | no | bend |
| 1462 | 0 | no | bend |
| 1462 | 0 | no | bend |
| 1481 | 26 | yes | bend |
| 1481 | 26 | yes | bend |
| 1481 | 26 | yes | bend |
| 3064 | 5 | yes (very very slight) | asymmetric stretch |
| 3064 | 5 | yes (very very slight) | asymmetric stretch |
| 3064 | 5 | yes (very very slight) | asymmetric stretch |
| 3066 | 0 | no | symmetric stretch |
| 3157 | 0 | no | symmetric stretch |
| 3157 | 0 | no | symmetric stretch |
| 3158 | 0 | no | symmetric stretch |
| 3158 | 0 | no | symmetric stretch |
| 3160 | 4 | yes (very slight) | symmetric stretch |
| 3160 | 4 | yes (very slight) | symmetric stretch |
| 3160 | 4 | yes (very very slight) | symmetric stretch |
MO Analysis
Pop analysis file: DOI:10042/194021
[S(Me)3]+
B3LYP/6-31G(d,p)level
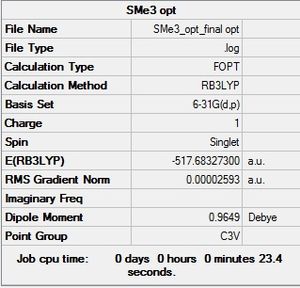
Optimisation file: here D-Space: DOI:10042/194012
| Geometry | Summary Data | Convergence Table | Jmol | |||
|---|---|---|---|---|---|---|
|
Item Value Threshold Converged? Maximum Force 0.000001 0.000015 YES RMS Force 0.000001 0.000010 YES Maximum Displacement 0.000050 0.000060 YES RMS Displacement 0.000016 0.000040 YES |
|
B3LYP/6-31G(d,p)level
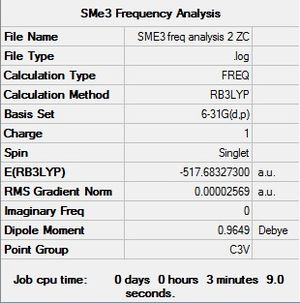
Frequency file: here D-Space:DOI:10042/194013
| summary data | low modes |
|---|---|
|
Low frequencies --- -6.5180 -6.2165 -6.2124 -0.0030 0.0039 0.0113 Low frequencies --- 163.0240 200.5040 200.5041 |
Vibrational Data
| wavenumber | Intensity | IR active? | type |
| 162 | 0 | no | bend |
| 200 | 0 | no | bend |
| 200 | 0 | no | bend |
| 255 | 0 | no | bend |
| 255 | 0 | no | bend |
| 285 | 0 | no | bend |
| 624 | 2 | yes (very very slight) | symmetrical stretch |
| 704 | 1 | yes (very very slight) | asymmetrical stretch |
| 704 | 1 | yes (very very slight) | asymmetrical stretch |
| 918 | 0 | no | bend |
| 958 | 1 | yes (very very slight) | bend |
| 958 | 1 | yes (very very slight) | bend |
| 1071 | 11 | yes | bend |
| 1071 | 11 | yes | bend |
| 1076 | 12 | yes | bend |
| 1371 | 0 | no | bend (umbrella motion of 2 methyl group) |
| 1371 | 0 | no | bend (umbrella motion of 2 methyl group) |
| 1408 | 2 | yes (very very slight) | bend (umbrella motion of all methyl group) |
| 1452 | 0 | no | bend (scissoring) |
| 1464 | 10 | yes | bend (scissoring of Me groups) |
| 1464 | 10 | yes | bend (scissoring of Me groups) |
| 1473 | 25 | yes | bend (scissoring of Me groups) |
| 1473 | 25 | yes | bend (scissoring of Me groups) |
| 1485 | 42 | yes | bend (scissoring of Me groups) |
| 3074 | 0 | no | symmetrical stretch |
| 3075 | 3 | yes (very very slight) | asymmetrical stretch |
| 3075 | 3 | yes (very very slight) | asymmetrical stretch |
| 3184 | 0 | no | symmetrical stretch |
| 3185 | 8 | yes | symmetrical stretch |
| 3185 | 8 | yes | symmetrical stretch |
| 3187 | 3 | yes (very very slight) | symmetrical stretch |
| 3187 | 2 | yes (very very slight) | asymmetrical stretch |
| 3187 | 2 | yes (very very slight) | asymmetrical stretch |
IR Spectrum
IR spectrum comparison
An interesting observation is that the symmetric stretches increase in frequency on varying the central element. The frequency increases through N to P and then to S. This is similar to what was observed with B and Ga and is due to the increase in atomic size (see discussion of Ga and B IR spectra)
MO Analysis
NBO Analysis
| [N(Me)4]+ | [P(Me)4]+ | [S(Me)3]+ | ||
|---|---|---|---|---|
| Charge Distribution range |  |
 |

| |
| Charge distribution of atoms in molecule | 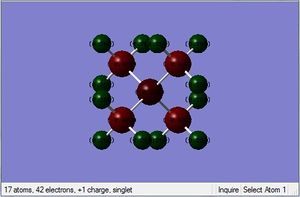 |
 |
|
| Atom | [N(Me)4]+ | [P(Me)4]+ | [S(Me)3]+ |
|---|---|---|---|
| C | -0.483 | -1.05 | -0.847 |
| H | 0.269 | 0.298 | 0.297 |
| X | -0.295 | 1.667 | 0.919 |
| [N(Me)4]+ | [P(Me)4]+ | [S(Me)3]+ | |
|---|---|---|---|
| Contribution from Carbon (%) | 34 | 60 | 49 |
| Contribution from Heteroatom (%) | 66 | 40 | 51 |
Discussion
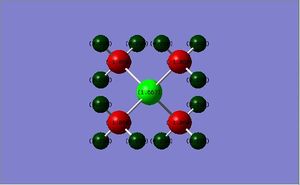
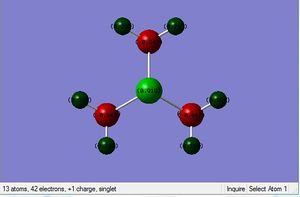
Looking at the charge distribution, carbon has the most electron density. This can be rationalised by considering the adjacent heteroatoms and their electronegativity relative to carbon. Although this is the case, the charge distribution goes against what we might expect, as carbon is more electron dense despite N being more electronegative. We can rationalise this by considering the neighbouring H atoms, in the C-H bond the carbon is more electronegative than hydrogen and this draws electron density towards the carbon atom.
Looking at the relative contributions we would expect the more electronegative atom to contribute most. This is indeed that case as we can see from the table. P contributes least to the C-X bond as it is less electronegative than C and this is also true for S. The results of the table of relative contributions, we would expect N to have the most negative charge however this is not the case, and infact C has the most negative charge despite N having the greatest contribution. This can be rationalized by considering the 3 neighboring H atoms which draw electron density towards the carbon. P is the most positive of the heteroatoms, followed by S. This can be explained as it contributes least to the C-X bond compared to N and S. P is also the least electronegative of the three. S is also partially positive, although less positive than P and again this can be explained because it contributes more to the C-X bond than P although both contribute less to the bond than carbon.
In general, as the charge on central atom decreases, the contribution of the central atom to the bond would increase. The charge on C atom is always negative in all 3 cases.
Traditional theory depicts the partial positive charge on the N atom when in reality this is shared between the H atoms. In N(CH3)4]+, the N atom has a slight negative charge of -0.29 which is inconsistent with the traditional theory and mechanism which predicts the positive charge on the N following donation of the lone pair. This discrepancy could be explained due to the high electronegativity of N. The charge distribution shows that the hydrogen atoms actually bear the positive charge not the nitrogen atom and this can be explained by the fact that the electrons in the C-H bond are drawn to the more electronegative carbon, and the carbon has its electrons drawn towards the more electronegative N atom in the C-N bond which leaves the H partially positive. Therefore the positive charge is actually shared between the 3 H atoms.
Discussion on [NR4]+ (R=alkyl)
[NR4]+ is traditionally depicted with a positive charge on N atom. Most mechanisms show that this species is obtained by the donation of a lone pair of electrons from NR3 to an alkyl group with one positive charge, forming a dative bond. As a result, 2 electrons in the new bond,would be equally shared between N and C atom, so the N atom would be short by one electron hence the positive charge would be placed on the N atom. However, the computational calculation indicated that the formal positive charge should be delocalised over all the H atoms since H atoms are the most electropositive atoms in this kind of species as shown through the NBO analysis. This discrepancy between traditional theory and the computational result can be accounted for as the computational methods take into account the relative electronegativities of the atoms.
Part 2: Influence of functional groups
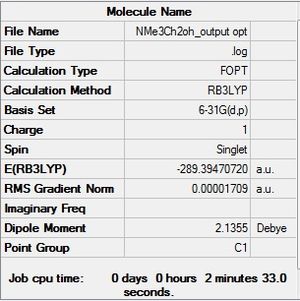
[N(Me)3(CH2OH)]+
Final Optimisation File: here D-Space: DOI:10042/194018
| summary data | convergence | Jmol | |||
|---|---|---|---|---|---|
|
         Item               Value     Threshold  Converged?
 Maximum Force            0.000004     0.000015     YES
 RMS     Force            0.000001     0.000010     YES
 Maximum Displacement     0.000016     0.000060     YES
 RMS     Displacement     0.000006     0.000040     YES
|
|
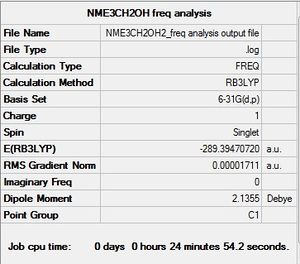
B3LYP/6-31G(d,p)level
Frequency file here: here
D-Space: DOI:10042/194019
| summary data | low modes |
|---|---|
|
Low frequencies --- -7.7885 -4.7712 -0.0004 0.0001 0.0008 2.9554 Low frequencies --- 131.2033 213.5539 255.6828 |
MO Analysis
Pop analysis file: DOI:10042/194020
[N(CH3)3(CH2CN)]+
B3LYP/6-31G(d,p)level
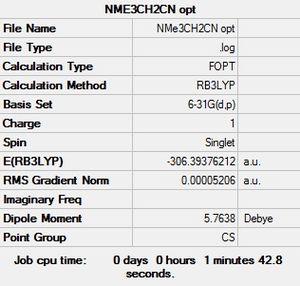
Optimisation file: here D-Space: DOI:10042/194014
| summary data | convergence | Jmol | |||
|---|---|---|---|---|---|
|
Item Value Threshold Converged? Maximum Force 0.000009 0.000015 YES RMS Force 0.000003 0.000010 YES Maximum Displacement 0.000052 0.000060 YES RMS Displacement 0.000015 0.000040 YES |
|
[N(CH3)3(CH2CN)]+
B3LYP/6-31G(d,p)level
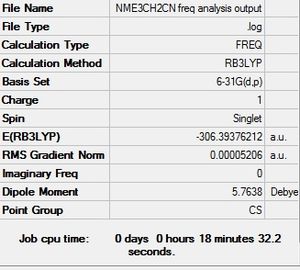
Frequency file: here D-Space: DOI:10042/194015
| summary data | low modes |
|---|---|
|
Low frequencies --- -3.4483 0.0005 0.0006 0.0010 4.3524 5.5928 Low frequencies --- 92.1416 154.3245 212.1231 |
MO Analysis
NBO Analysis
| [N(Me)3CN]+ | [N(Me)CH2OH]+ | |
|---|---|---|
| Charge Distribution range | 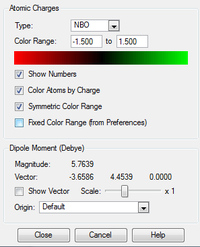 |

|
| Charge Distribution | 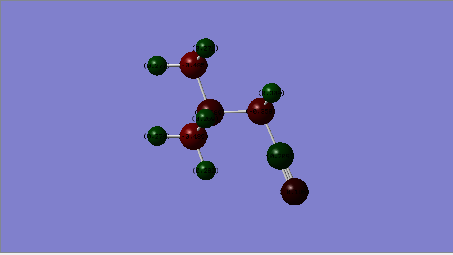 |
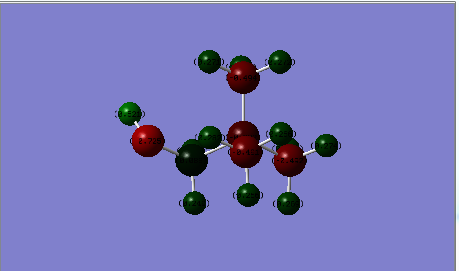
|
Charge Distribution Table
| Cation | Charge on N atom | Charge on C atoms | Charge on H atoms | Charge on O atom |
|---|---|---|---|---|
| [N(CH3)3(CH2OH)]+ | -0.322 central atom | 0.088 ('CH2OH), -0.491 ~ -0.494 (CH3) | 0.521 (OH), 0.237, 0,249 (CH2OH), 0.262-0.282 (CH3) | -0.725 |
| [N(CH3)3(CH2CN)]+ | -0.289 central atom, -0.186(CN) | -0.358(CH2CN),0.209, (CN), -0.358 ~-0.489 (CH3 | 0.269-0.282 (CH3, 0.309 (CH2CN) | N/A |
| [N(CH3)4]+ | -0.295 central atom | -0.483 | 0.269 | N/A |
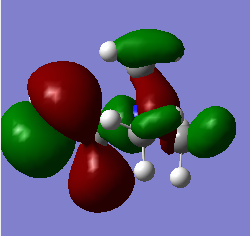
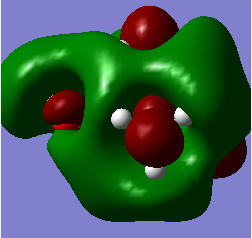
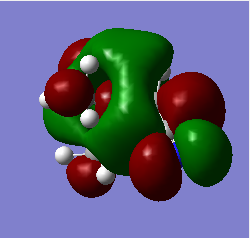
HOMO/LUMO
Energies
| [N(Me)4]+ | [N(CH3)3(CH2OH)]+ | [N(CH3)3(CH2CN)]+ | |
|---|---|---|---|
| HOMO | 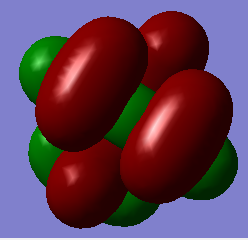 |
 |

|
| LUMO | 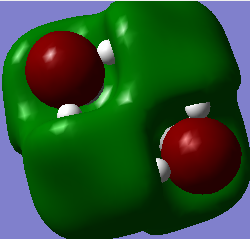 |
 |
|
| Molecule | HOMO (A.U.) | LUMO (A.U.) | Energy Gap (A.U.) |
|---|---|---|---|
| [N(CH3)4]+ | -0.57933 | -0.13308 | 0.44626 |
| [N(CH3)3(CH2OH)]+ | -0.48765 | -0.12460 | 0.36302 |
| [N(CH3)3(CH2CN)]+ | -0.50049 | -0.18182 | 0.31862 |
Q OH is an electron donating group and CN is an electron withdrawing group, What effect have these groups had on the charge distribution?
The electron withdrawing CN group has drawn electron density away from the adjacent carbons and this is shown when comparing the charges of the adjacent carbons: the methyl groups in proximity to the CN are more positive than those in proximity to the OH. The methyl carbons in proximity to the OH group are actually more negative than those in [N(CH3)4]+ which highlights the electron donating effects of the OH group. It is interesting to see however, that the OH also draws electron density away from the adjacent carbons as these are most positive at 0.08. This is because although OH group is electron donating through resonance, it is inductively electron withdrawing and draws electron density away from the carbons directly adjacent to this group.
Q Compare and contrast the HOMO and LUMO of[N(CH3)4]+ [N(CH3)3(CH2OH)]+ and [N(CH3)3(CH2CN)]+ has the energy of these orbitals moved?
The HOMO-LUMO gap decreased with the addition of the CN and OH groups respectively. This makes electron promotion from HOMO - LUMO easier and increases the reactivity of the molecule. [N(CH3)4]+ is the most stable as it has the largest HOMO-LUMO gap. The HOMO goes up for both OH and CN groups and this could be due to the increase in antibonding interactions.
Q How has the shape of the orbitals changed?
We can see that [N(CH3)4]+ has the most stable HOMO as it has the most bonding interactions. The HOMOs for [N(CH3)3(CH2OH)]+ and [N(CH3)3(CH2CN)]+ are less stable in comparison due to the increase in antibonding interactions and with the HOMO of [N(CH3)3(CH2OH)]+ being highest in energy as it has the most nodes. The LUMO of [N(CH3)4]+ is also the most stable as it is the most delocalised and has greater overlap. The LUMOs of the most electrom withdrawing groups are lowering in energy which is why [N(CH3)3(CH2CN)]+ 's LUMO is lower in energy than the LUMO of [N(CH3)3(CH2OH)]+. This also decreases the HOMO-LUMO gap and explains why [N(CH3)3(CH2CN)]+ is the most reactive.
Q What chemical impact could these changes have?
These changes can affect the chemical reactivity of a molecule:the smaller the energy gap between the HOMO and the LUMO, the more reactive the molecule. In this case, [N(CH3)3(CH2CN)]+ has the smallest HOMO- LUMO gap and so is the most reactive of the three.
Conclusion
In conclusion we have utlised various computational methods to analyse small molecules. It has been shown that using a higher basis set increases the accuracy of calculations. We have also seen the effects of changing both the central atom and ligands on physical properties of bonds and angles. In the mini project: Ionic Liquids, we have utlised computational methods to analyse small cations and have investigated the effects of adding electron donating and electron withdrawing groups to [NME4]+.
Acknowledgements
I would like to thank Dr Patricia Hunt for her guidance and advice throughout this project. I would also like to thank all the demonstrators,Bryan Ward and Precious Ugbogmah, for their help and support.
References
[1] http://staff.ustc.edu.cn/~luo971/2010-91-CRC-BDEs-Tables.pdf
[2] http://www.huntresearchgroup.org.uk/teaching/year2_mos.html#lecture4
[3] http://www.wiredchemist.com/chemistry/data/bond-energies-lengths
[4] Pauling, L. (1960) The Nature of the Chemical Bond. Cornell University Press. p.340-354
[5]Blanksby, S. J.; Ellison, G. B.; (2003). "Bond Dissociation Energies of Organic Molecules". Acc. Chem. Res. 36 (4): 255–263. doi:10.1021/ar020230d. PMID 12693923.

