Rep:Mod:mjf2310
Cope Rearrangement
Introduction
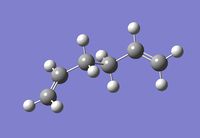
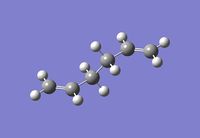
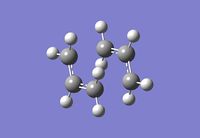
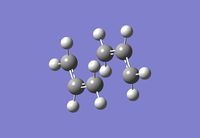
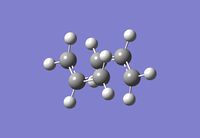
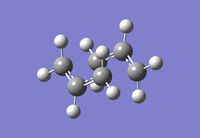
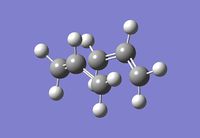
The cope rearrangement is a [3+3] sigmatropic reaction in a 1,5-diene. The transition state for this reaction either resembles the chair conformer of cyclohexane or the boat conformer. Both of these structures are shown in the image below.

1,5 anti Hexadiene
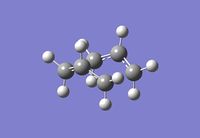
The anti conformer of Hexadiene was optimised at the HF/3-21G level. The completed optimisation file can be found on this link. From the symmetry point group and the total energy of the molecule, it is clear that the conformer that has been optimised is the anti1 conformer.
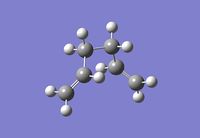
1,5 gauche Hexadiene
Optimisation was performed on a molecule of 1,5- hexadiene with a 'Gauche' type linkage, using the same basis set as the 'anti' conformer. The completed file can be found on this link. The point group and the total energy of the molecule indicate that the optimised is the gauche2 conformer.
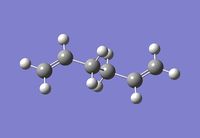
1,5- Hexadiene (Ci)
Optimisation (HF/3-21G)
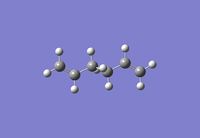
A 1,5-Hexadiene molecule with Ci symmetry was then constructed and optimised at the HF/3-21G level. The completed file can be found on this link. The total energy corresponds with the anti2 conformer.
Optimisation (DFT/6-31G*)
The same molecule was then optimised at the DFT/6-31G* level. The completed file can be found on this link
The basis set used in this optimisation is more accurate than the HF/3-21G basis set, which is why data between the two optimisations cannot be compared. However, geomtries of the optimised structures can be compared and since the 6-31G* basis set is more accurate, it is expected that the resulting geometry of the molecule will be more accurate. A table of the bond lengths and bond angles of the carbon chains of both optimised structures is shown below.
| 1, 5 Hexadiene Ci Bond Lengths (angstroms) | ||
|---|---|---|
| Bond | 6-31G* | 3-21G |
| C1 - C2 | 1.33352 | 1.31615 |
| C2 - C3 | 1.50421 | 1.50891 |
| C3 - C4 | 1.54808 | 1.55287 |
| C4 - C5 | 1.50421 | 1.50889 |
| C5 - C6 | 1.33352 | 1.31615 |
| 1, 5 Hexadiene Ci Bond Angles (°) | ||
|---|---|---|
| Angle | 6-31G* | 3-21G |
| C1 - C2 - C3 | 125.3 | 124.8 |
| C2 - C3 - C4 | 112.7 | 111.4 |
| C3 - C4 - C5 | 112.7 | 111.4 |
| C4 - C5 - C6 | 125.3 | 124.8 |
Frequency Analysis (DFT/6-31G*)
Frequency analysis was then performed on the optimised molecule, using the same basis set. The completed file can be found on this link
The low frequencies below show that the conformer structure is at an energy minimum and that there are no negative frequencies present.
 Low frequencies ---   -0.0012   -0.0008   -0.0007    1.2945    3.1483    9.3754
 Low frequencies ---   73.8320   80.7551  120.9284
A list of energies, (in au), taken from the .log file is shown below.
Sum of electronic and zero-point Energies=           -234.469213
 Sum of electronic and thermal Energies=              -234.461866
 Sum of electronic and thermal Enthalpies=            -234.460922
 Sum of electronic and thermal Free Energies=         -234.500797
Optimisation of Chair Transition State
All the following optimisation were performed at the HF/3-21G level of accuracy.
1st Optimisation
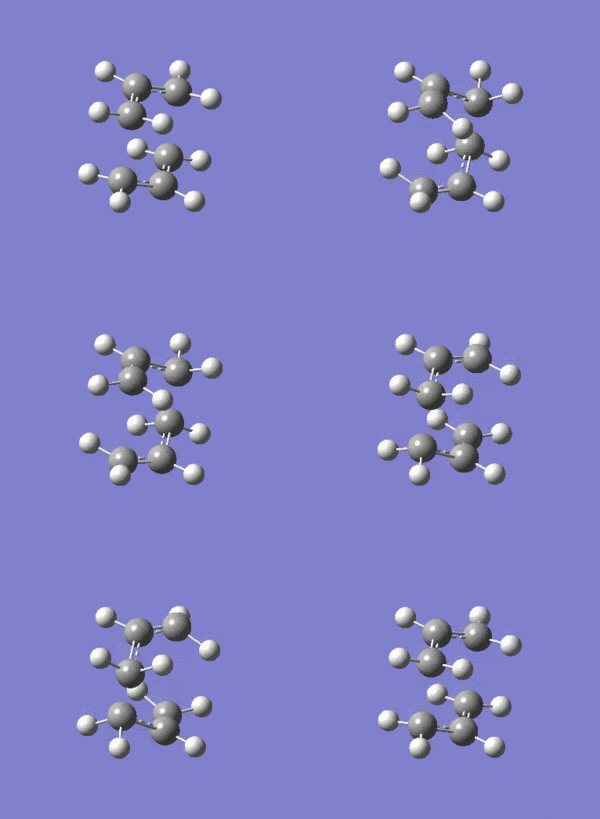
The transition structure was first optimised by using the Opt+Freq method, with optimisation to a transition structure (Berny), in Gaussview. The completed file can be found on this link. The job ran successfully as is demonstrated by the animation of the vibration at -817.90 cm-1, which is as expected for the Cope rearrangement.
2nd Optimisation
Starting with the same input file as the 1st optimisation, a second optimisation was run using the frozen coordinate method. This method freezes the terminal carbons in place and optimises the transition structure around them. The completed file can be found on this link. The distance between the two terminal carbon atoms was fixed at 2.29431 and 2.22066 angstroms.
3rd Optimisation
Using the structure from the second optimisation, a third optimisation was performed with the coordinates of the terminal carbons unfrozen, which enabled the distance between the terminal carbons to be optimised rather than fixed at 2.2 angstroms. The completed file can be found on this link. The distance between the terminal carbons was found to be 2.02038 and 2.01905 angstroms.
Optimisation of Boat Transition State
The boat transition state was then optimised using the QST2 method. The first calculation performed was an opt+freq job type, with the optimisation to a QST2 rather than a TS (Berny), as was calculated previously. The completed optimisation log file can be found on this link. From looking at the image from the checkpoint file of the optimised structure, (shown in results table below), it appears the calculation has failed since the transition state shown resembles a chair transition state rather than a boat transition state.
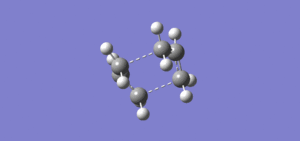
The geometry of the input molecule was then modified such that the structures were closer to that of the boat transition state. This was achieved by setting the central dihedral angle to 0° and the angle at the two ends of the chain was set to 100°. The optimisation was then run using the same method as above and the image of the checkpoint file below shows that the optimisation yielded a boat transition structure. The completed optimisation file can be found on this link. The low frequencies shown below confirm that there is only one imaginary frequency which corresponds to the cope rearrangement.
 Low frequencies --- -840.0247   -3.4691   -3.1288   -0.0011   -0.0007   -0.0007
 Low frequencies ---    2.4309  155.2101  381.8906
 ******    1 imaginary frequencies (negative Signs) ******
Intrinsic Reaction Coordinate
In order to accurately determine which product confomer is formed from the transition structures optimised previously, the Intrinsic Reaction Coordinate, (IRC), method was employed. Using this method, Gaussian follows the minimum energy path along the reaction coordinate and makes a series of small changes in geometry of the transition state in the direction where the gradient of the potential energy surface is the steepest. The resulting file shows a series of different structures and the structure with the minimum energy corresponds to the product of the reaction and hence can be used to determine which conformer is formed from the transition state.
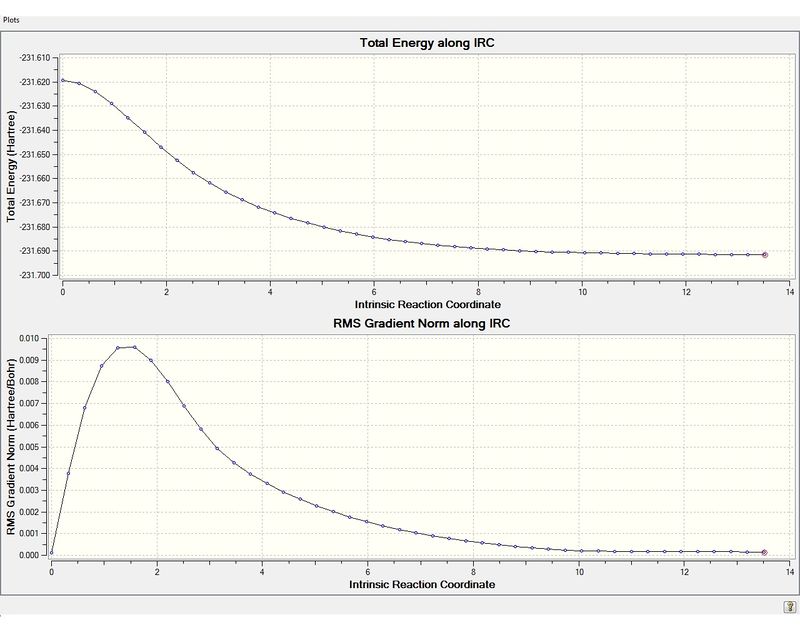
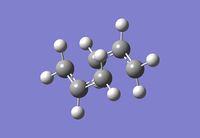
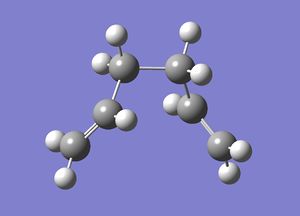
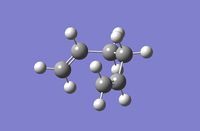
The IRC was performed on the chair transition state, which was optimised previously as described above. The first IRC method was performed with 44 steps and the force constant was calculated at each step. The completed file can be found on this link. Each step corresponds to a different strucutre and shown below is a summary of the results, a plot of the IRC path and an image of the lowest energy structure.
| 1st Lowest Energy Structure Data | |
|---|---|
| |
| File Type | .chk |
| Calculation Type | IRC |
| Calculation Method | |
| Basis Set | 3-21G |
| Final Energy (au) | -231.69157855 |
| RMS Gradient (au) | 0.00015231 |
| Dipole Moment (Debye) | 0.3630 |
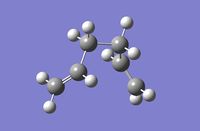
From the Root Mean Squared gradient graph it is clear that the lowest energy structure, (shown in image below: number 44), is not at a minimum as the RMS plot is still decreasing and has not flattened out. Therefore the IRC was run again, this time with 200 steps. The completed file can be found on this link. Although 200 steps were specified only 44 steps were yielded from the calculation since the structure at the 43rd step corresponds to the minimum energy structure. The 43rd step, (circled), in the RMS plot is clearly the minimum energy structure. An image of the lowest energy structure, (step 43), is shown below as well as the data for this structure. From the data supplied in the appendix it can be concluded that this structure is conformer gauche4. Therefore the conformer that results from the chair transition state is gauche4.

| 2nd Lowest Energy Structure Data | |
|---|---|
| |
| File Type | .chk |
| Calculation Type | IRC |
| Calculation Method | |
| Basis Set | 3-21G |
| Final Energy (au) | -231.69153000 |
| RMS Gradient (au) | 0.00006942 |
| Dipole Moment (Debye) | |
Activation Energies
In order to calculate and compare the activation energies of the chair and boat transition states, both optimised molecules must first be reoptimised at the higher level of accuracy, DFT/6-31G*.
The 3rd optimised chair file was used and reoptimised at this higher level. The completed file can be found on this link and the 'item' from the log file, is shown below.
         Item               Value     Threshold  Converged?
 Maximum Force            0.000058     0.000450     YES
 RMS     Force            0.000019     0.000300     YES
 Maximum Displacement     0.000750     0.001800     YES
 RMS     Displacement     0.000164     0.001200     YES
 Predicted change in Energy=-2.106536D-07
 Optimization completed.
    -- Stationary point found.
Frequency analysis was then performed on the optimised structure. The completed file can be found on this link and a table of results is shown below.
The same process was performed on the boat transition state. Firstly, it was optimised at the DFT/6-31G* level, the completed file can be found on this link, then a frequency analysis was performed on it, which can be found on this link.
         Item               Value     Threshold  Converged?
 Maximum Force            0.000017     0.000450     YES
 RMS     Force            0.000004     0.000300     YES
 Maximum Displacement     0.000719     0.001800     YES
 RMS     Displacement     0.000173     0.001200     YES
 Predicted change in Energy=-3.499470D-08
 Optimization completed.
    -- Stationary point found.
| Summary Energies | ||||||||||
|---|---|---|---|---|---|---|---|---|---|---|
| HF/3-21G | B3LYP/6-31G* | |||||||||
| Electronic Energy (au) | Sum of electronic and zero-point energies (au)/ 0K | Sum of electronic and thermal energies (au)/ 298K | Activation Energy (au) / 298K (0K) | Activation Energy (kcal/mol) / 298K (0K) | Electronic Energy (au) | Sum of electronic and zero-point energies (au)/ 0K | Sum of electronic and thermal energies (au)/ 298K | Activation Energy (au) / 298K (0K) | Activation Energy (kcal/mol) / 298K (0K) | |
| Chair TS | -231.61932148 | -231.466699 | -231.461340 | -0.071227 (-0.072841) | -44.69565477 (-45.70845591) | -234.55698243 | -234.414933 | -234.409008 | -0.052858 (-0.05428) | -33.16892358 (-34.0612428) |
| Boat TS | -231.60280239 | -231.450928 | -231.445299 | -0.087268 (-0.088612) | -54.76154268 (-55.60491612) | -234.5409304 | -234.402339 | -234.396005 | -0.065861 (-0.066874) | -41.32843611 (-41.96410374) |
| Hexadiene anti2 | -231.69253529 | -231.539540 | -231.532567 | - | - | -234.61171035 | -234.469213 | -234.461866 | - | - |
Diels-Alder Cycloaddition
Introduction
The diels-alder reaction is a [4+2] concerted cycloaddition between a diene and a dienophile. For the reaction to be allowed the reactants must be symmetric which ensures that the orbital overlap between the diene and dienophile is sufficient.
Butadiene and Ethylene
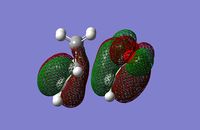
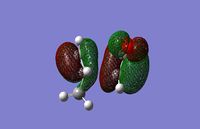
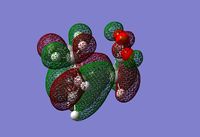
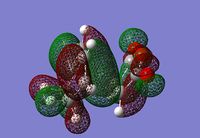
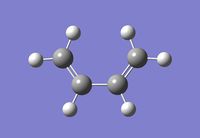
A molecule of cis-butadiene was optimised at the semi-empirical AM1 level. The completed file can be found on this link. Below is an image of the HOMO and LUMO of the optimised structure.
| cis-Butadiene Optimisation Data | |
|---|---|
| |
| File Type | .log |
| Calculation Type | FOPT |
| Calculation Method | RAM1 |
| Basis Set | ZDO |
| Final Energy (au) | 0.04879719 |
| RMS Gradient (au) | 0.00001745 |
| Dipole Moment (Debye) | 0.0414 |
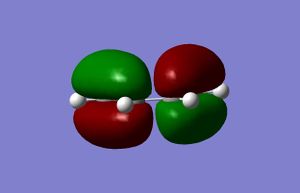

From the images above, it can be seen that the HOMO is antisymmetric with regards to the plane perpendicular to the plane of the molecule, and the LUMO is symmetric in relation to the same plane.
Transition State
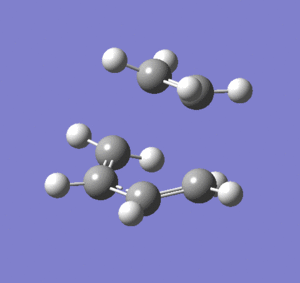
To optimise the transition state, the frozen coordinate method was employed. The interfragment distance was set to 2.2 angstroms and the rest of the molecule was optimised to a transition state at the HF/3-21G level of accuracy. Following this the interfragment distance was then optimised. The completed file can be found on this link. Shown below is the input file, a summary of the results and an image of the optimised transition state.
The optimised inter-fragment distance was found to be 2.20294 angstroms.
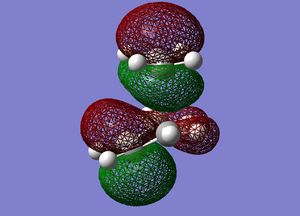
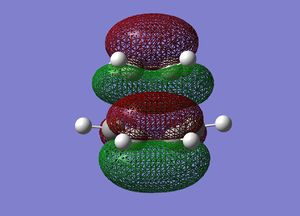
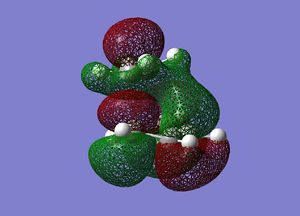
Frequency analysis was then performed on the optimised transition state to confirm the presence of only 1 imaginary frequency, (at -818.0 cm-1). The completed file can be found on this link. An image of the motion of this vibrational mode is shown below. The animation below confirms that the transition state characterised is for the Diels-Alder reaction.

Cyclohexadiene and Maleic Anhydride
A molecule of cyclohexadiene was optimised at the HF/3-21G level, the completed file can be found on this link. A molecule of maleic anhydride was then optimised using the same basis set, the completed file can be found on this link.
Transition State
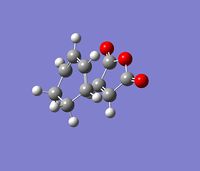
The two optimised molecules were arranged so that the interfragment distance was 2.2 angstroms, an optimisation to a TS(Berny) and a frequency analysis was then performed on this molecule at the HF/321G level/. The exo form was optimised first, using the SCAN and the completed file can be found on this link. The low frequencies data extracted from the .log file shows that there is only one imaginary frequency which confirms the presence of a transition state. The animation of the 1 imaginary vibrational frequency of the exo form is shown in the table below. The optimised interfragment distance in the transition state was found to be 2.26065 angstroms.
Low frequencies --- -647.4729   -2.2892   -0.8256   -0.0009   -0.0008   -0.0006
 Low frequencies ---    1.6264   42.3320  131.3858
 ******    1 imaginary frequencies (negative Signs) ******
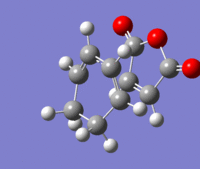
The same procedure was then carried out on the endo form. The completed file can be found on this link and the file was also published to D-space here [1]. and an animation of the one imaginary frequency is shown in the table below. The optimised interfragment distance in the transition state was found to be 2.26065 angstroms.
Both of the transition states were then reoptimised, using the SCAN, at the higher level of accuracy of DFT/6-31G*. The exo transition state was published to D-space here [2], and the completed file can be found on this link. The endo transition state was published to D-space here [3], and the completed file can be found on this link.
The reactants were then also reoptimised using the 6-31G basis set, in order to calculate more accurate activation energies. The completed cyclohexadiene file can be found on this link and the completed maleic anhydride file can be found on this link.
 Low frequencies --- -647.5215   -1.6910   -1.0853    0.0003    0.0004    0.0008
 Low frequencies ---    0.4671   42.4426  131.4365
 ******    1 imaginary frequencies (negative Signs) ******
Shown below is a table of the data obtained from the opt+freq calculations carried out on the exo and endo transition state. The energies in italics represent the data obtained from the 3-21G basis set and the other energies are those obtained from the 6-31G* basis set. The activation energies were obtained from subtracting the energy of the transition state from the combined energies of the reactants, (maleic anhydride and cyclohexadiene).
Discussion
Literature reports experimental formation of the endo product in 99% yield [1], and the data computed above shows that the endo transition state is the lowest in energy and has the smallest activation energy, therefore the first conclusion that can be made is that this particular diels-alder reaction proceeds under kinetic control. Furthermore, the animation of the vibrational modes of each transition state confirm that the reaction is concerted and all bonds are broken/made simultaneously in one step.
One possible explanation for the regioselectivity observed is the steric hindrance experienced in the exo form between the O=C-O-C=O region of the maleic anhydride and the sp3 carbons of the cyclohexadiene. This steric hindrance prevents the two fragments from interacting at the optimal distance for maximal valence orbital overlap. The inter-fragment distance calculated and shown in the table above, validates this argument.
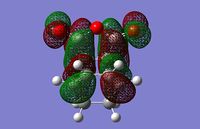
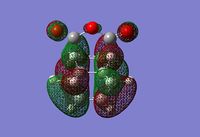
Another possible explanation for the endo transition state being lower in energy is the secondary orbital effect. The secondary orbital effect is the favourable interaction between the pi systems, which are not involved in bonding, of the cyclohexadiene and the maleic anhydride. This is demonstrated in the image below.
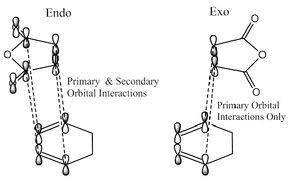
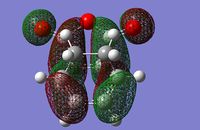
However, from examination of the HOMO of the endo transition state, the interaction between the pi systems is out of phase and there is therefore nodal plane between the two fragments which suggests the secondary orbital effect is not present. The apparent absence of the secondary orbital effect is an example of the power of computational chemistry in challenging theories attempting to rationalise regioselectivity and relative energies of transition states.
References
- ↑ R. Gleiter, M. C. Bohm, Pure & Appl.Chem., 1983, 55, 237—244

