Rep:Mod:mjf1311
Module 2: Part One
Introduction
Basic Gaussian: Creating and Optimising a molecule of BH3
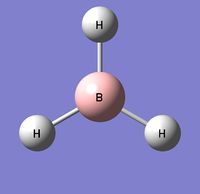
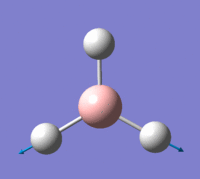
Familiarisation with Gaussian began by creating a molecule of BH3 and setting the B-H bond lengths to 1.5 angstroms.

1st Optimisation of BH3
Optimisation of the structural parameters of a molecule by Gaussian is acheived by Gaussian finding solutions to the Schrodinger equation at different nuclear coordinates. The basis of the Born-Oppenheimer approximation is that nuclei are much larger and heavier than electrons, therefore the nuclei can be considered as being fixed in space compared to the electrons. Under this approximation, the Schrodinger equation can be solved for the electrons and the fixed nuclei to give an energy dependent on nuclear coordinates. The optimised structure is the one in which the nuclear coordinates correspond to a minimum in the energy. Gaussian determines this minimum energy structure by analysing different nuclear coordinates in an iterative manner.
The BH3 molecule created was then optimised through Gaussian by using the B3LYP method and the 3-21G Basis set. The completed optimisation file can be found on this link. Using the inquiry function, the optimised B-H bond length was found to be 1.94 angstroms, and the optimised H-B-H bond angle was 120°. A summary of the optimised data is shown in the table below.
The section of text below was taken fron the 'real' output of the optimisation by Gaussian and indicates that the job truly had converged.
 Item               Value     Threshold  Converged?
 Maximum Force            0.000413     0.000450     YES
 RMS     Force            0.000271     0.000300     YES
 Maximum Displacement     0.001610     0.001800     YES
 RMS     Displacement     0.001054     0.001200     YES
 Predicted change in Energy=-1.071764D-06
 Optimization completed.
    -- Stationary point found.
                           ----------------------------
                           !   Optimized Parameters   !
                           ! (Angstroms and Degrees)  !
 --------------------------                            --------------------------
 ! Name  Definition              Value          Derivative Info.                !
 --------------------------------------------------------------------------------
 ! R1    R(1,2)                  1.1935         -DE/DX =    0.0004              !
 ! R2    R(1,3)                  1.1935         -DE/DX =    0.0004              !
 ! R3    R(1,4)                  1.1935         -DE/DX =    0.0004              !
 ! A1    A(2,1,3)              120.0            -DE/DX =    0.0                 !
 ! A2    A(2,1,4)              120.0            -DE/DX =    0.0                 !
 ! A3    A(3,1,4)              120.0            -DE/DX =    0.0                 !
 ! D1    D(2,1,4,3)            180.0            -DE/DX =    0.0                 !
 --------------------------------------------------------------------------------
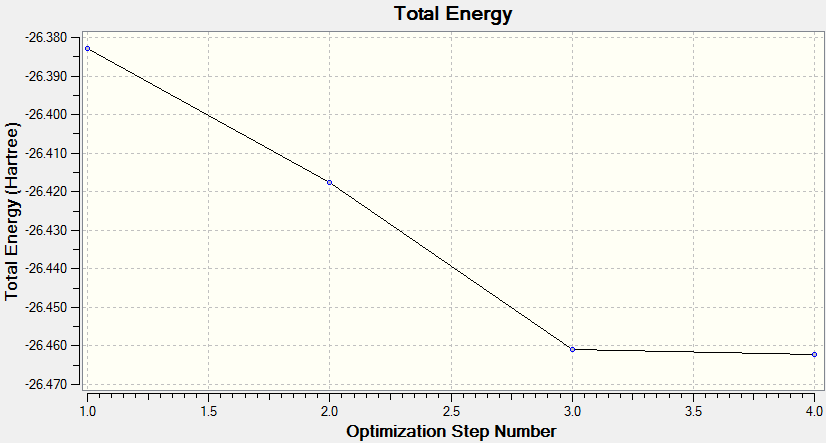
Two graphical plots of the optimisation data are shown below.
The first is a plot of Total Energy of the BH3 molecule against Optimisation Step Number. This graph shows, at each point, a structure of BH3 which is increasingly closer to the equilibrium structure. Gaussian essentially traverses the Potential Energy Surface of the molecule until a stable point is reached at which the total energy is at a minimum.
The second is a plot of Root Mean Squared Gradient against Optimisation Step Number. This gradient corresponds to forces acting on the molecule since force is equal to the gradient of E against R, (nuclear position). These forces are intramolecular forces which are present when the nuclei and electrons are not in equilibrium with each other, e.g. nuclear-nuclear repulsion, nuclear-electron attraction, electron-electron interactions.
The final optimisation step number, (step number 4), has the lowest total energy and corresponds to a gradient of zero which indicates no forces are acting upon the molecule and that the nuclei and electrons are in equilibrium, i.e. the fully optimised BH3 structure, with structural parameters as stated above.
2nd Optimisation of BH3
The optimised structure of BH3 calculated above was then used as a precursor for optimisation using a larger basis set. The basis set used in this case was 6-32G(d,p) with B3LYP being used as the method again. The completed optimisation file can be found on this link. The optimised B-H bond lengths using this basis set were found to be 1.19 angstroms, and the optimised H-B-H bond angle was 120°. A summary of the optimised data is shown in the table below.
The section of text below was taken fron the 'real' output of the optimisation by Gaussian and indicates that the job truly had converged.
 Item               Value     Threshold  Converged?
 Maximum Force            0.000433     0.000450     YES
 RMS     Force            0.000284     0.000300     YES
 Maximum Displacement     0.001713     0.001800     YES
 RMS     Displacement     0.001121     0.001200     YES
 Predicted change in Energy=-1.113480D-06
 Optimization completed.
    -- Stationary point found.
                           ----------------------------
                           !   Optimized Parameters   !
                           ! (Angstroms and Degrees)  !
 --------------------------                            --------------------------
 ! Name  Definition              Value          Derivative Info.                !
 --------------------------------------------------------------------------------
 ! R1    R(1,2)                  1.1914         -DE/DX =    0.0004              !
 ! R2    R(1,3)                  1.1914         -DE/DX =    0.0004              !
 ! R3    R(1,4)                  1.1914         -DE/DX =    0.0004              !
 ! A1    A(2,1,3)              120.0            -DE/DX =    0.0                 !
 ! A2    A(2,1,4)              120.0            -DE/DX =    0.0                 !
 ! A3    A(3,1,4)              120.0            -DE/DX =    0.0                 !
 ! D1    D(2,1,4,3)            180.0            -DE/DX =    0.0                 !
 --------------------------------------------------------------------------------
It should be noted that comparisons between observables, e.g. Total Energy, for the two optimisations are not possible because comparisons can only be accurately made when the same basis set is used for the optimisation.
TlBr3 Optimisation
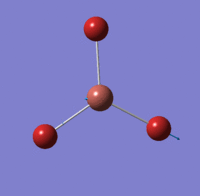
A major advantage of using computational chemistry is demonstrated in the analysis of this molecule, since Thallium is highly toxic so the structural properties of it can be investigated without having to handle hazardous chemicals.
The basis set used was LanL2DZ which is a medium level basis set. The Gaussview input file was submitted to the HPC server and the completed optimisation, which can be found on this link, was published to D-space which can be found here [1]. Using Gaussian Tl - Br bond lengths were found to be 2.65 angstroms and the Br - Tl - Br bond angle was 120°. The calculated bond length is close to the literature value of 2.512 angstroms [1], which demonstrates that the optimisation calculation using Gaussview has a high level of accuracy.
A table summarising the results is shown below.
The Item shown below was extracted from the log file and shows that the optimisation worked properly.
         Item               Value     Threshold  Converged?
 Maximum Force            0.000002     0.000450     YES
 RMS     Force            0.000001     0.000300     YES
 Maximum Displacement     0.000022     0.001800     YES
 RMS     Displacement     0.000014     0.001200     YES
 Predicted change in Energy=-6.084009D-11
 Optimization completed.
    -- Stationary point found.
                           ----------------------------
                           !   Optimized Parameters   !
                           ! (Angstroms and Degrees)  !
 --------------------------                            --------------------------
 ! Name  Definition              Value          Derivative Info.                !
 --------------------------------------------------------------------------------
 ! R1    R(1,2)                  2.651          -DE/DX =    0.0                 !
 ! R2    R(1,3)                  2.651          -DE/DX =    0.0                 !
 ! R3    R(1,4)                  2.651          -DE/DX =    0.0                 !
 ! A1    A(2,1,3)              120.0            -DE/DX =    0.0                 !
 ! A2    A(2,1,4)              120.0            -DE/DX =    0.0                 !
 ! A3    A(3,1,4)              120.0            -DE/DX =    0.0                 !
 ! D1    D(2,1,4,3)            180.0            -DE/DX =    0.0                 !
 --------------------------------------------------------------------------------
BBr3 Optimisation
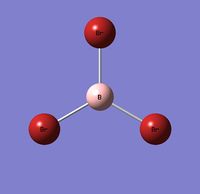
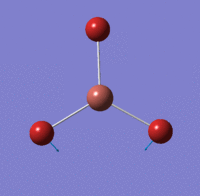
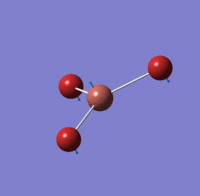
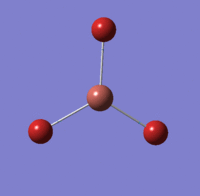
The Gaussview input file was submitted to the HPC server and the completed optimisation was published to D-space[2], and can be found on this link
A summary of the results obtained is shown below. The B - Br bond length was calculated as 1.93 angstroms and the Br - B - Br bond length was calculated as 120°.
The Item shown below was extracted from the log file and shows that the optimisation worked properly.
Item               Value     Threshold  Converged?
 Maximum Force            0.000008     0.000450     YES
 RMS     Force            0.000005     0.000300     YES
 Maximum Displacement     0.000046     0.001800     YES
 RMS     Displacement     0.000030     0.001200     YES
 Predicted change in Energy=-5.266345D-10
 Optimization completed.
    -- Stationary point found.
                           ----------------------------
                           !   Optimized Parameters   !
                           ! (Angstroms and Degrees)  !
 --------------------------                            --------------------------
 ! Name  Definition              Value          Derivative Info.                !
 --------------------------------------------------------------------------------
 ! R1    R(1,2)                  1.934          -DE/DX =    0.0                 !
 ! R2    R(1,3)                  1.934          -DE/DX =    0.0                 !
 ! R3    R(1,4)                  1.934          -DE/DX =    0.0                 !
 ! A1    A(2,1,3)              120.0            -DE/DX =    0.0                 !
 ! A2    A(2,1,4)              120.0            -DE/DX =    0.0                 !
 ! A3    A(3,1,4)              120.0            -DE/DX =    0.0                 !
 ! D1    D(2,1,4,3)            180.0            -DE/DX =    0.0                 !
 --------------------------------------------------------------------------------
 GradGradGradGradGradGradGradGradGradGradGradGradGradGradGradGradGradGrad

                          Input orientation:
 ---------------------------------------------------------------------
 Center     Atomic      Atomic             Coordinates (Angstroms)
 Number     Number       Type             X           Y           Z
 ---------------------------------------------------------------------
      1          5           0        0.000000    0.000000    0.000000
      2         35           0        0.000000    1.933957    0.000000
      3         35           0        1.674856   -0.966979    0.000000
      4         35           0       -1.674856   -0.966979    0.000000
 ---------------------------------------------------------------------
Structural Comparison
Shown below is a table of the optimised bond lengths for the three different molecules described above, as calculated by Gaussian. Boron and Thallium are both in group 3, however Thallium is lower down this group therefore it's valence orbitals are larger and more diffuse than those on Boron. Consequently, there is a poorer orbital overlap between Tl and Br than B and Br which leads to an increase in bond length when changing the central element to Thallium from Boron. Furthermore, since Zeff decreases down a group, due to shielding, the coulombic interaction between the central element and the ligand decreases down a group, which further contributes to the increase in bond length in changing the central element to Thallium from Boron.
H and Br are similar in that they both only require one electron to completely fill the valence orbitals and as such they both bond covalently to the Boron centre by sharing a pair of electrons in the overlap between the Boron 2p and the 1s and 4p orbitals of Hydrogen and Bromine respectively. However, Bromine is much further down the periodic table than Hydrogen and therefore has a much larger atomic radius than Hydrogen which results in poorer orbital overlap between the valence orbitals. In addition, Hydrogen has a much larger charge density than Bromine, since Br has a lower Zeff , which means the coulombic interaction between Hydrogen and Boron is larger and consequently the bond length is shorter than the B-Br bond length.
Gaussview does not always draw bonds in structures, despite the expectation that a bond is present. This is because Gaussview bases the presence of bonds purely on distance between the two nuclei. A bond is defined as a favourable electrostatic interaction between the nuclei and electrons of two or more atoms, so although a bond is not drawn in Gaussview, it does not necessarily mean the two atoms are weakly just that the bond length is larger than the maximum bond length as defined by Gaussview.
| Molecule | Bond Length (angstroms) |
|---|---|
| BH3 | 1.19 |
| BBr3 | 1.93 |
| TlBr3 | 2.65 |
BH3 Vibrational Analysis
The starting point for the frequency analysis was on optimised BH3 molecule using the 6-31G(d,p) basis set, the completed optimisation file can be found on this link and the 'item' from the optimisation log file is shown below along with a summary table.
| Frequency Analysis of BH3 Data | |
|---|---|
| File Type | .log |
| Calculation Type | FOPT |
| Calculation Method | RB3LYP |
| Basis Set | 6-31G(d,p) |
| Final Energy (au) | -26.62 |
| RMS Gradient (au) | 0.00000296 |
| Dipole Moment (Debye) | 0 |
| Point Group | D3H |
| Job cpu Time | 13.0 seconds |
| B-H Bond Length | 1.19 angstroms |
| H-B-H Bond Angle | 120° |
         Item               Value     Threshold  Converged?
 Maximum Force            0.000006     0.000450     YES
 RMS     Force            0.000003     0.000300     YES
 Maximum Displacement     0.000023     0.001800     YES
 RMS     Displacement     0.000011     0.001200     YES
 Predicted change in Energy=-1.996522D-10
 Optimization completed.
    -- Stationary point found
Low frequencies ---   -0.9432   -0.8611   -0.0054    5.7455   11.7246   11.7625
 Low frequencies --- 1162.9963 1213.1826 1213.1853
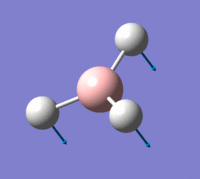
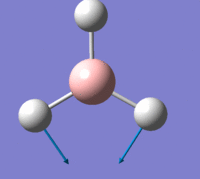
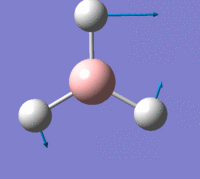
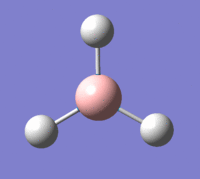
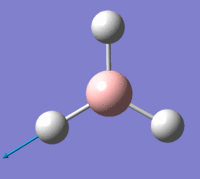
Shown below is a table describing motions that make up each vibrational mode and the resulting symmetry point group.
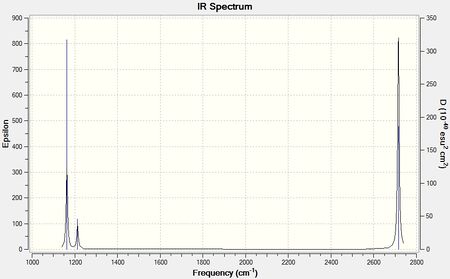
Shown below is an infrared spectrum as predicted by Gaussview. Despite there being 6 vibrational modes, described in the table above, there are only 3 peaks present in the predicted spectrum. This is due to the fact that vibrational modes 2 and 3 are degenerate, as are vibrational modes 5 and 6, so only one peak is exhibited for each of these pairs of degenerate vibrational modes. Also the motions of each H in vibrational mode 4 cancel each other out in terms of dipole moment, so overall there is no change in dipole moment, resulting in the vibrational mode being IR inactive.
TlBr3 Vibrational Analysis
Using the same procedure described above, vibrational analysis was performed on the TlBr3 optimised previously, the frequency calculation was submitted to the HPC and the completed file published to D-space[3]. A summary table of the optimised TlBr3 molecule is shown below.
| Frequency Analysis of TlBr3 Data | |
|---|---|
| File Type | .log |
| Calculation Type | FREQ |
| Calculation Method | RB3LYP |
| Basis Set | LANL2DZ |
| Final Energy (au) | -91.22 |
| RMS Gradient (au) | 0.00000088 |
| Dipole Moment (Debye) | 0 |
| Point Group | D3H |
| Job cpu Time | 13.0 seconds |
| B-H Bond Length | 2.65 angstroms |
| H-B-H Bond Angle | 120° |
Shown below is the 'item', the low frequency data both from the log file and a table describing the vibrational modes as calculated by Gaussview. From the low frequency data in the log file, it is clear the lowest 'real' normal mode is at 46.4289 cm-1
         Item               Value     Threshold  Converged?
 Maximum Force            0.000002     0.000450     YES
 RMS     Force            0.000001     0.000300     YES
 Maximum Displacement     0.000022     0.001800     YES
 RMS     Displacement     0.000011     0.001200     YES
 Predicted change in Energy=-5.660901D-11
 Optimization completed.
    -- Stationary point found.
 Low frequencies ---   -3.4213   -0.0026   -0.0004    0.0015    3.9367    3.9367
 Low frequencies ---   46.4289   46.4292   52.1449
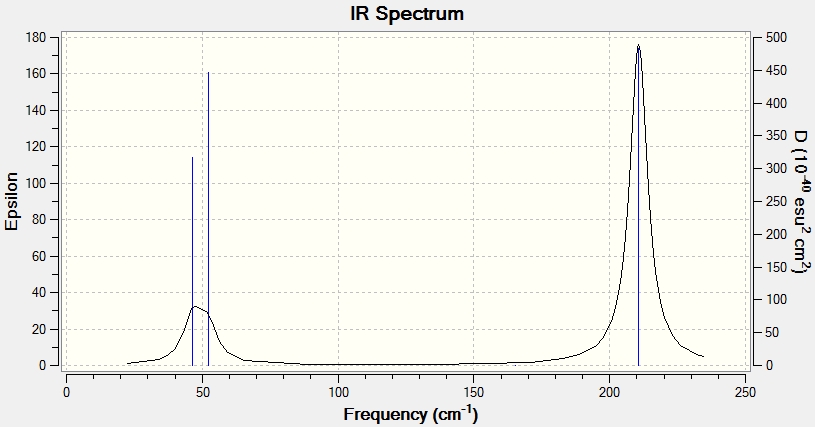
Shown below is the IR spectrum as predicted by Gaussian. There are less peaks than expected for precisely the same reasons as those described in the BH3 frequency analysis.
Vibrational Frequency Comparison
| Vibrational Frequency (cm-1) | ||
|---|---|---|
| Vibrational Mode | TlBr3 Frequency (cm-1) | BH3 Frequency (cm-1) |
| 1 | 46 | 1163 |
| 2 | 46 | 1213 |
| 3 | 52 | 1213 |
| 4 | 165 | 2582 |
| 5 | 211 | 2716 |
| 6 | 211 | 2716 |
Vibrational frequency is directly proportional to bond strength, so the data shown in the table of the vibrational modes, as calculated by Gaussview, demonstrates that the B-H bonds in BH3 are an order of magnitude stronger than the Tl-Br bonds in TlBr3. This observation can be explained by looking at the reduced mass of the bonds. Reduced mass is given by:
(m1m2) / (m1 + m2)
where m1 and m2 are the mass of each atom in the bond. Bond energy is inversely proportional to reduced mass, therefore since Tl - Br bonds will have a much larger reduced mass than the B - H bonds, due to Tl and Br being much heavier atoms than B and H, it is expected that the Tl - Br bonds are weaker than the B - H bonds and hence exhibit vibrational modes at a lower frequency, which is what is observed.
Furthermore, from the analysis of the optimised structures of both TlBr3 and BH3 carried out above, it was observed that the B-H bond length is much shorter than the Tl-Br bond length, which also indicates the expectation for B - H bonds to be stronger than Tl- Br bonds.
Comparing the frequency analyses, the modes have been reordered in the TlBr3 and BH3 calculations. In the case of BH3 the vibrational mode with the lowest wavenumber is the mode with A2 symmetry, which in the case of TlBr3 is vibrational mode number 3. Also the first pair of degenerate vibrational modes have the lowest wavenumber in TlBr3, whereas in BH3 the same degenerate modes are numbers 2 and 3. One possible explanation for this observation is again the difference in reduced mass between the two molecules. Since Br are much heavier ligands than H, the energy required to move all 3 ligands above and below the plane, as in the [A2"] vibrational mode, is much larger for TlBr3 than BH3, which is possibly what causes the reordering of vibrational modes.
Both spectra contain the same number of peaks, and both contain a vibrational mode which is IR inactive.
The peaks corresponding to the two pairs of degenerate vibrational modes in each spectra, lie at different energies to each other due to the energy required in each motion. The pair of degenerate modes at the higher wavenumbers are higher energy than the other pair because these vibrational modes are due to a stretching motion which requires contraction and elongation of the Centre - Ligand bonds, which requires much more energy than the bending side-to-side motion of the ligands that makes up the other pair of degenerate modes.
Basis sets used by Gaussian all differ in quality and accuracy, therefore the basis set used for the optimisation of the structure and the frequency analysis must be identical to ensure both calculations are completed to the same level of accuracy.
The frequencies represent the vibrational modes of the molecule, which are equivalent to 3N-6, and the 'low frequencies' represent the negative frequencies resulting from the '-6' part.
BH3 Molecular Orbitals
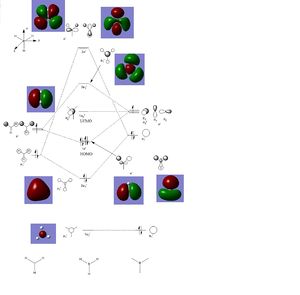
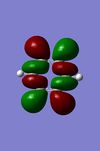
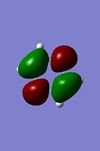
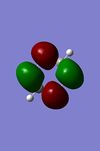
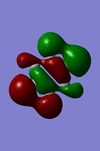
Population analysis was then performed on the BH3 molecule optimised previously, using a 6-31G(d,p) basis set. The file was published to D-space [4]. Screenshots of the visualised molecular orbitals, calculated by Gaussview, are shown in a table below, as well as a MO diagram including orbitals drawn from LCAO method along with the 'real' Molecular Orbitals calculated from Gaussview.
The differences between the orbitals calculated by both theories are not significant, which demonstrates the good level of accuracy of qualitative MO theory.
| Population Analysis | ||
|---|---|---|
| Energy Level | MO (Gaussview) | Symmetry |
| LUMO+3 | 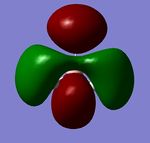 |
2e' |
| LUMO+2 |  |
2e' |
| LUMO+1 |  |
3a1' |
| LUMO | 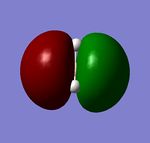 |
1a2 |
| HOMO | 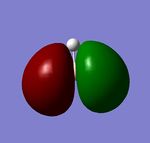 |
1e' |
| HOMO-1 |  |
1e' |
| HOMO-2 |  |
2a'1 |
| HOMO-3 | 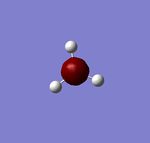 |
1a'1 |
NBO Analysis of NH3
Optimisation of NH3
A molecule of NH3 was optimised using the 6-31G(d,p) basis set, the completed file can be found on this link
 Item               Value     Threshold  Converged?
 Maximum Force            0.000024     0.000450     YES
 RMS     Force            0.000012     0.000300     YES
 Maximum Displacement     0.000088     0.001800     YES
 RMS     Displacement     0.000056     0.001200     YES
 Predicted change in Energy=-1.777718D-09
 Optimization completed.
    -- Stationary point found.
                           ----------------------------
                           !   Optimized Parameters   !
                           ! (Angstroms and Degrees)  !
 --------------------------                            --------------------------
 ! Name  Definition              Value          Derivative Info.                !
 --------------------------------------------------------------------------------
 ! R1    R(1,2)                  1.018          -DE/DX =    0.0                 !
 ! R2    R(1,3)                  1.018          -DE/DX =    0.0                 !
 ! R3    R(1,4)                  1.018          -DE/DX =    0.0                 !
 ! A1    A(2,1,3)              105.7413         -DE/DX =    0.0                 !
 ! A2    A(2,1,4)              105.7486         -DE/DX =    0.0                 !
 ! A3    A(3,1,4)              105.7478         -DE/DX =    0.0                 !
 ! D1    D(2,1,4,3)           -111.8631         -DE/DX =    0.0                 !
 --------------------------------------------------------------------------------
Frequency Analysis of NH3
Frequency analysis was then performed on the optimised NH3 molecule. The completed frequency file can be found on this link
| Frequency Analysis of NH3 Data | |
|---|---|
| File Type | .log |
| Calculation Type | FREQ |
| Calculation Method | RB3LYP |
| Basis Set | 6-31G(d,p) |
| Final Energy (au) | -56.56 |
| RMS Gradient (au) | 0.00000890 |
| Dipole Moment (Debye) | 1.85 |
| Point Group | C1 |
| Job cpu Time | 14.0 seconds |
         Item               Value     Threshold  Converged?
 Maximum Force            0.000020     0.000450     YES
 RMS     Force            0.000008     0.000300     YES
 Maximum Displacement     0.000075     0.001800     YES
 RMS     Displacement     0.000039     0.001200     YES
 Predicted change in Energy=-1.485764D-09
 Optimization completed.
    -- Stationary point found.
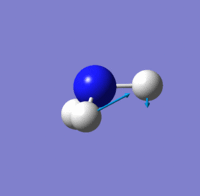
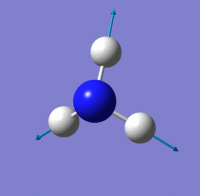
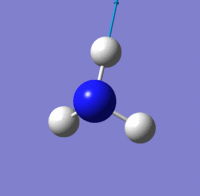
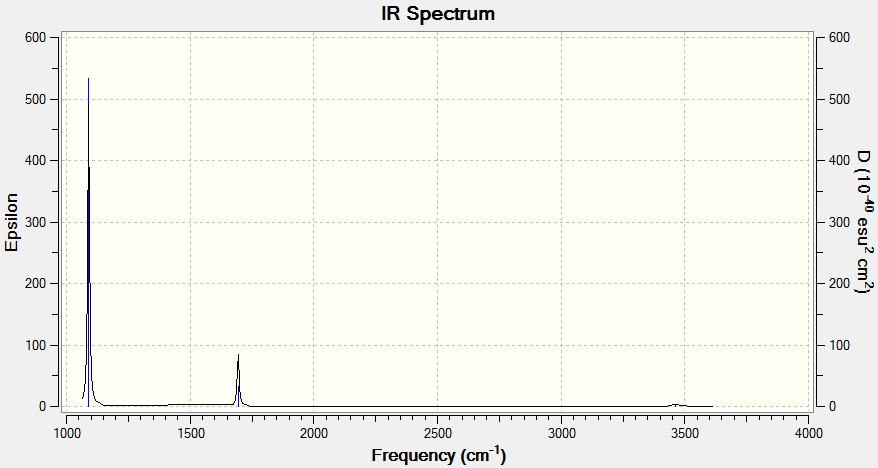
 Low frequencies ---  -10.2451   -0.0007    0.0013    0.0015    9.1071   14.6705
 Low frequencies --- 1089.3141 1693.9158 1693.9487
Population Analysis of NH3
Population analysis was then performed, the completed file can be found on this link
| Frequency Analysis of NH3 Data | |
|---|---|
| File Type | .log |
| Calculation Type | SP |
| Calculation Method | RB3LYP |
| Basis Set | 6-31G(d,p) |
| Final Energy (au) | -56.56 |
| RMS Gradient (au) | |
| Dipole Moment (Debye) | 1.85 |
| Point Group | C1 |
| Job cpu Time | 6.0 seconds |
| 'Real' Molecular Orbitals of (NH3) | |||
|---|---|---|---|
| Orbital Energy Level | MO | Orbital Energy (au) | |
| LUMO + 2 | 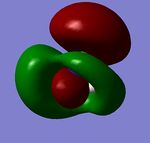 |
-14.33 | |
| LUMO + 1 |  |
-0.86 | |
| LUMO |  |
-0.47 | |
| HOMO |  |
-0.47 | |
| HOMO - 1 |  |
-0.27 | |
| HOMO - 2 | 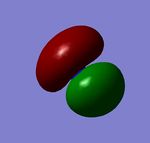 |
0.02 | |
| HOMO - 3 |  |
0.09 | |
| HOMO - 4 |  |
0.09 | |
NBO Analysis
Using the .log file from the population analysis calculation, (rather than the .chk file which is used for MO analysis), natural bond orbital analysis was performed on the ammonia molecule. The charge distribution in the image below is represented by colours. Bright green indicates highly positive charge and bright red indicates highly negative charge, the charge limits associated with these colours are in the range -1.0 to 1.0

The image below shows the same charge distribution as the image above, but using numbers rather than a colour scheme. The specific NBO charge for the Nitrogen atom is -1.125 and for the Hydrogen atoms it is 0.375.
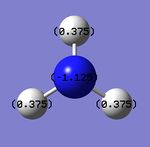
The charge distribution numbers Gaussview assigned to each atom can be found in the log file, as shown below.
 Summary of Natural Population Analysis:

                                       Natural Population
                Natural  -----------------------------------------------
    Atom  No    Charge         Core      Valence    Rydberg      Total
 -----------------------------------------------------------------------
      N    1   -1.12515      1.99982     6.11104    0.01429     8.12515
      H    2    0.37505      0.00000     0.62250    0.00246     0.62495
      H    3    0.37505      0.00000     0.62250    0.00246     0.62495
      H    4    0.37505      0.00000     0.62249    0.00246     0.62495
 =======================================================================
The section below, also extracted from the .log file, shows key information about the bonding.
(Occupancy)   Bond orbital/ Coefficients/ Hybrids
 ---------------------------------------------------------------------------------
     1. (1.99909) BD ( 1) N   1 - H   2
                ( 68.83%)   0.8297* N   1 s( 24.87%)p 3.02( 75.05%)d 0.00(  0.09%)
                                           -0.0001 -0.4986 -0.0059  0.0000 -0.2910
                                            0.0052  0.8155  0.0277  0.0000  0.0000
                                            0.0281  0.0000  0.0000  0.0032  0.0082
                ( 31.17%)   0.5583* H   2 s( 99.91%)p 0.00(  0.09%)
                                           -0.9996  0.0000  0.0072 -0.0289  0.0000
     2. (1.99909) BD ( 1) N   1 - H   3
                ( 68.83%)   0.8297* N   1 s( 24.86%)p 3.02( 75.05%)d 0.00(  0.09%)
                                            0.0001  0.4986  0.0059  0.0000  0.2910
                                           -0.0052  0.4077  0.0138  0.7062  0.0240
                                            0.0140  0.0243  0.0076  0.0033  0.0031
                ( 31.17%)   0.5583* H   3 s( 99.91%)p 0.00(  0.09%)
                                            0.9996  0.0000 -0.0072 -0.0145 -0.0250
     3. (1.99909) BD ( 1) N   1 - H   4
                ( 68.83%)   0.8297* N   1 s( 24.87%)p 3.02( 75.05%)d 0.00(  0.09%)
                                            0.0001  0.4986  0.0059  0.0000  0.2909
                                           -0.0052  0.4077  0.0138 -0.7062 -0.0239
                                            0.0140 -0.0243 -0.0076  0.0033  0.0031
                ( 31.17%)   0.5583* H   4 s( 99.91%)p 0.00(  0.09%)
                                            0.9996  0.0000 -0.0072 -0.0145  0.0250
     4. (1.99982) CR ( 1) N   1           s(100.00%)
                                            1.0000 -0.0002  0.0000  0.0000  0.0000
                                            0.0000  0.0000  0.0000  0.0000  0.0000
                                            0.0000  0.0000  0.0000  0.0000  0.0000
     5. (1.99721) LP ( 1) N   1           s( 25.38%)p 2.94( 74.52%)d 0.00(  0.10%)
                                            0.0001  0.5036 -0.0120  0.0000 -0.8618
                                            0.0505  0.0000  0.0000  0.0000  0.0000
                                            0.0000  0.0000  0.0000 -0.0269  0.0155
 Natural Bond Orbitals (Summary):

                                                            Principal Delocalizations
           NBO                        Occupancy    Energy   (geminal,vicinal,remote)
 ====================================================================================
 Molecular unit  1  (H3N)
     1. BD (   1) N   1 - H   2          1.99909    -0.60417
     2. BD (   1) N   1 - H   3          1.99909    -0.60417
     3. BD (   1) N   1 - H   4          1.99909    -0.60416
     4. CR (   1) N   1                  1.99982   -14.16768
     5. LP (   1) N   1                  1.99721    -0.31756  24(v),16(v),20(v),17(v)
NH3BH3 Association Energies
Optimisation
The ammonia borane molecule was first optimised at the b3lyp/6-31G(d,p) level. The completed optimisation file can be found in this link.
Frequency
Frequency analysis was then carried out on the optimised ammonia borane molecule, the completed freqeuncy file can be found on this link. The low frequencies below exhibit a short range of values and show that no negative values are present.
         Item               Value     Threshold  Converged?
 Maximum Force            0.000108     0.000450     YES
 RMS     Force            0.000057     0.000300     YES
 Maximum Displacement     0.000663     0.001800     YES
 RMS     Displacement     0.000352     0.001200     YES
 Predicted change in Energy=-1.757863D-07
 Optimization completed.
    -- Stationary point found.
 Low frequencies ---   -0.0012   -0.0006   -0.0004   20.2370   23.3829   32.6010
 Low frequencies ---  265.1966  632.2316  639.5001
Association Energy
The bond energy/dissociation energy is calculated as the difference in energy between the ammonia borane molecule and the linear combination of the ammonia and borane molecules, i.e. ΔE=E(NH3BH3)-[E(NH3)+E(BH3)]. ΔE = -83.23 - (-56.56 + -26.62) = - 0.052 au, which is 135.47 kJ mol-1
| Energy Comparisons | ||
|---|---|---|
| Molecule | Energy (au) | Energy (kJ mol-1) |
| NH3BH3 | -83.23 | |
| NH3 | -56.56 | |
| BH3 | -26.62 | |
References
- ↑ J. Glaser and G. Johansson, Acta Chemica Scandinavica 1982, 36a, 125-135
Module 2: Part Two - Aromaticity Mini Project
Aromatic compounds are defined as planar, with a conjugated delocalised system of pi electrons. For a molecule to be aromatic it must have 4n+2 pi electrons. This mini project involves investigating aromaticity, particularly how this relates to the MO picture of molecular bonding. Conformers, vibrations and MOs of benzene and its analogues, including pyridinium cation, boratabenzene anion and borazing, are analysed below.
Benzene
Optimisation
Benzene was optimised using the 6-31G(d,p) basis set and the method used was RB3LYP. The completed optimisation file can be found on this link. The C - C bond length was found to be 1.40 angstroms, the C - H bond length was 1.09 and the H-C-C bond angle was 120°.
         Item               Value     Threshold  Converged?
 Maximum Force            0.000212     0.000450     YES
 RMS     Force            0.000085     0.000300     YES
 Maximum Displacement     0.001099     0.001800     YES
 RMS     Displacement     0.000330     0.001200     YES
 Predicted change in Energy=-5.196758D-07
 Optimization completed.
    -- Stationary point found.
Frequency Analysis
Frequency analysis was then performed on the optimised benzene molecule, using the HPC and the completed frequency file was submitted to D-Space. [5]. Frequency analysis was carried to ensure the benzene molecule structure energy was a minimum, this is confirmed by the range of low frequencies and the fact that there are no negative low frequencies.
| Frequency Analysis of Benzene Data | |
|---|---|
| File Type | .log |
| Calculation Type | FREQ |
| Calculation Method | RB3LYP |
| Basis Set | 6-31G(d,p) |
| Final Energy (au) | -232.26 |
| RMS Gradient (au) | 0.00009549 |
| Dipole Moment (Debye) | 0.00 |
| Point Group | C1 |
| Job cpu Time | 1 minute 31 seconds |
 Low frequencies ---  -15.6262  -14.5752  -13.9310   -0.0004    0.0004    0.0009
 Low frequencies ---  414.0693  414.1436  620.9613
         Item               Value     Threshold  Converged?
 Maximum Force            0.000190     0.000450     YES
 RMS     Force            0.000093     0.000300     YES
 Maximum Displacement     0.000972     0.001800     YES
 RMS     Displacement     0.000372     0.001200     YES
 Predicted change in Energy=-4.902140D-07
 Optimization completed.
    -- Stationary point found.
NBO Analysis
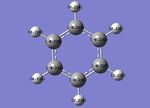
Population Analysis was then carried out and published to d-space [6]. The charge distribution of Benzene is represented by colours in the image on the left below, the colour range is -1.0 to 1.0, (the same range as used for the ammonia molecule above), with bright green indicating highly positive charge and bright red indicating highly negative charge. The central image below shows the same charge distribution represented by numbers. The numbered charge distribution shows that each carbon atom and each hydrogen atom has the same charge, but of opposite sign, (0.239). This initial observation could be explained by invoking delocalisation of pi electrons across benzene since this shows that all the hydrogen atoms and carbon atoms share equal charge, which provides some evidence to the fact that benzene is an aromatic compound.

| Population Analysis of Benzene Data | |
|---|---|
| File Type | .log |
| Calculation Type | DP |
| Calculation Method | RB3LYP |
| Basis Set | 6-31G(d,p) |
| Final Energy (au) | -232.26 |
| RMS Gradient (au) | |
| Dipole Moment (Debye) | 0.00 |
| Point Group | C1 |
| Job cpu Time | 1 minute 5.7 seconds |
MO Analysis
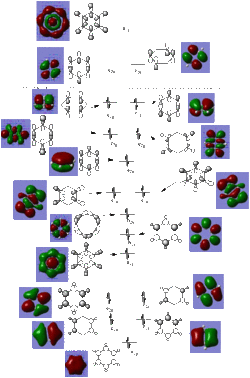
The 'real' molecular oribtals of benzene, up to the LUMO + 2 level, are shown in the table below. The first 6 molecular orbitals, i.e. lowest energy, have been omitted since these are core molecular orbitals.
The MO diagram constructed below further indicates the aromaticity of Benzene. The totally pi orbital, (HOMO-4), clearly shows delocalisation across the whole molecule, one of the criteria for aromaticity. Furthermore, the number of occupied pi orbitals in the MO diagram is 3, (HOMO-4, HOMO-1 and HOMO), and given that each MO can formally hold 2 electrons, the number of pi electrons is 6 which is 4n+2 which also provides evidence for the aromaticity of benzene.
Boratobenzene Anion
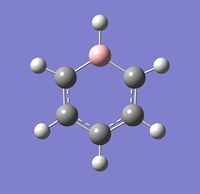
The first isoelectronic analgoue of benzene to be analysed is boratobenzene, which is a benzene molecule with a B-H unit substituted for a C-H unit, with a charge of -1.
Optimisation
Optimisation was performed using the same basis set as benzene, i.e. 6-31G(d,p). The completed file was published to d-space[7].
         Item               Value     Threshold  Converged?
 Maximum Force            0.000159     0.000450     YES
 RMS     Force            0.000069     0.000300     YES
 Maximum Displacement     0.000733     0.001800     YES
 RMS     Displacement     0.000264     0.001200     YES
 Predicted change in Energy=-5.765670D-07
 Optimization completed.
    -- Stationary point found.
What becomes immediately clear from the table of results above is that the bond lengths around the ring are no longer equal and the bond angles around the ring are no longer equal, as compared with Benzene. This can be explained by the orbital mismatch between the Boron and Carbon atoms due to the fact that Boron is in group 3 whereas Carbon is in group 4, so different sized orbitals leads to poorer orbital overlap.
Frequency Analysis
The completed file was published to D-Space [8]. The negative to positive small range of low frequencies confirms that the optimised molecule has an energy corresponding to a minimum.
| Frequency Analysis of Boratobenzene Data | |
|---|---|
| File Type | .log |
| Calculation Type | FREQ |
| Calculation Method | RB3LYP |
| Basis Set | 6-31G(d,p) |
| Final Energy (au) | -219.02 |
| RMS Gradient (au) | 0.00015676 |
| Dipole Moment (Debye) | 2.85 |
| Point Group | C1 |
| Job cpu Time | 11 minutes 33.2 seconds |
         Item               Value     Threshold  Converged?
 Maximum Force            0.000438     0.000450     YES
 RMS     Force            0.000157     0.000300     YES
 Maximum Displacement     0.000855     0.001800     YES
 RMS     Displacement     0.000392     0.001200     YES
 Predicted change in Energy=-7.110884D-07
 Optimization completed.
    -- Stationary point found.
 Low frequencies ---   -6.8479    0.0003    0.0008    0.0012    3.2611    5.6252
 Low frequencies ---  371.2616  404.4992  565.1640
NBO Analysis
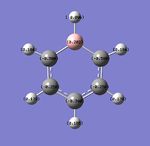
Population analysis was performed and the completed file published to d-space[9]. The two images below show the charge distribution for each atom of Boratabenzene. The image on the left represents charge with colour with a range of -1.0 to 1.0 and bright green corresponding to highly positive charge, bright red highly negative charge and black neutral. The central image shows the same charge distribution represented numerically.

| Population Analysis of Boratabenzene Data | |
|---|---|
| File Type | .log |
| Calculation Type | SP |
| Calculation Method | RB3LYP |
| Basis Set | 6-31G(d,p) |
| Final Energy (au) | -219.02 |
| RMS Gradient (au) | |
| Dipole Moment (Debye) | 2.85 |
| Point Group | C1 |
| Job cpu Time | 1 minute 8.7 seconds |
MO Analysis
The real MO's were computed using Gaussian, however only 3 have been chosen to compare with the same 3 Benzene MO's computed previously. The 3 orbitals chosen are all pi orbitals are the HOMO, the orbital 1 energy level down from HOMO and the orbital 4 energy levels down from the HOMO.
| 'Real' Molecular Orbitals of Boratabenzene | |||
|---|---|---|---|
| Orbital Energy Level | MO | Orbital Energy (au) | |
| HOMO (π - bonding) | 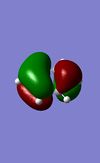 |
0.01 | |
| HOMO - 1 (π - bonding) |  |
-0.04 | |
| HOMO - 4 (totally π - bonding) |  |
-0.13 | |
Pyridinium Cation
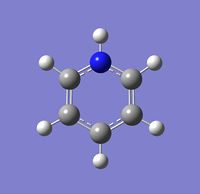
The next benzene analogue to be investigated is pyridinium, which has an N-H unit substituted for a C-H unit. The pyridinium cation, which carries a charge of +1, is used as this is isoelectronic with benzene.
Optimisation
completed file was published to d-space [10]
         Item               Value     Threshold  Converged?
 Maximum Force            0.000064     0.000450     YES
 RMS     Force            0.000023     0.000300     YES
 Maximum Displacement     0.000624     0.001800     YES
 RMS     Displacement     0.000158     0.001200     YES
 Predicted change in Energy=-6.417661D-08
 Optimization completed.
    -- Stationary point found.
Frequency Analysis
The completed file was published to d-space [11]. The low frequencies indicate the structure is at an energy minimum.
         Item               Value     Threshold  Converged?
 Maximum Force            0.000129     0.000450     YES
 RMS     Force            0.000033     0.000300     YES
 Maximum Displacement     0.000789     0.001800     YES
 RMS     Displacement     0.000228     0.001200     YES
 Predicted change in Energy=-6.601184D-08
 Optimization completed.
    -- Stationary point found.
 Low frequencies ---   -9.4980   -5.2670   -0.0007    0.0001    0.0003    3.9992
 Low frequencies ---  391.9055  404.3499  620.1997
NBO Analysis
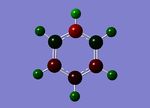
The completed file was published to d-space [12]. The two images below show the charge distribution for each atom of the Pyridinium cation. The image on the left represents charge with colour with a range of -1.0 to 1.0 and bright green corresponding to highly positive charge, bright red highly negative charge and black neutral. The central image shows the same charge distribution represented numerically.

MO Analysis
The same three 'real' molecular orbitals were then visualised from the .fchk file using Gaussview and are shown in the table below.
| 'Real' Molecular Orbitals of Pyridinium Cation | |||
|---|---|---|---|
| Orbital Energy Level | MO | Orbital Energy (au) | |
| HOMO (π - bonding) |  |
-0.48 | |
| HOMO - 1 (π - bonding) |  |
-0.51 | |
| HOMO - 4 (totally π - bonding) |  |
-0.64 | |
Borazine
Optimisation
completed file was published to d-space [13]
         Item               Value     Threshold  Converged?
 Maximum Force            0.000117     0.000450     YES
 RMS     Force            0.000036     0.000300     YES
 Maximum Displacement     0.000380     0.001800     YES
 RMS     Displacement     0.000103     0.001200     YES
 Predicted change in Energy=-1.237443D-07
 Optimization completed.
    -- Stationary point found.
Frequency Analysis
the completed file was published to d-space [14]. The low frequencies indicate the structure is at an energy minimum.
 Low frequencies ---   -3.8105    0.0001    0.0006    0.0008    0.6417    6.8524
 Low frequencies ---  289.6158  289.6928  404.1964
         Item               Value     Threshold  Converged?
 Maximum Force            0.000205     0.000450     YES
 RMS     Force            0.000070     0.000300     YES
 Maximum Displacement     0.000370     0.001800     YES
 RMS     Displacement     0.000133     0.001200     YES
 Predicted change in Energy=-1.289729D-07
 Optimization completed.
    -- Stationary point found.
NBO Analysis
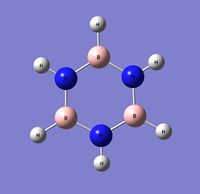
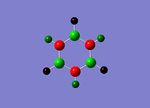
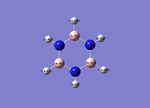
Population analysis was then carried out, the completed file was published to d-space.[15]. The two images below show the charge distribution for each atom of Borazine. The image on the left represents charge with colour with a range of -1.0 to 1.0 and bright green corresponding to highly positive charge, bright red highly negative charge and black neutral. The central image shows the same charge distribution represented numerically.
MO Analysis
The same three 'real' molecular orbitals were then visualised from the .fchk file using Gaussview and are shown in the table below.
| 'Real' Molecular Orbitals of Borazine | |||
|---|---|---|---|
| Orbital Energy Level | MO | Orbital Energy (au) | |
| HOMO (π - bonding) |  |
-0.28 | |
| HOMO - 1 (π - bonding) |  |
-0.28 | |
| HOMO - 4 (totally π - bonding) |  |
-0.36 | |
Comparison
NBO's
Firstly, in the case of Boratabenzene, from both images it can be observed that the Boron atom carries a slight positive charge, and the adjacent carbon atoms carry a negative charge. This can be explained by the fact that Boron is more electropositive than Carbon, the negative charge on carbon decreases in intensity moving around the ring until it is at its lowest at Cpara, this is due to the fact that the carbons are increasingly further away from the electropositive Boron atom. The difference in electronegativity between Boron and Hydrogen is only small, which is why the hydrogen atom bonded to the Boron atom carries a very small negative charge and is practically uncharged.
Electronegativity difference between Carbon and the Heteroatom can also be used to explain the charge distribution in the Pyridinium molecule. Nitrogen carries a relatively large negative charge because Nitrogen withdraws electron density from the adjacent carbon atoms (Cortho), since Nitrogen is more electronegative than Carbon. The electronegativity of Nitrogen shows very little effect on the meta carbons as these carbons carry a charge which is very similar to the charge of a carbon in benzene. However the para carbon atom carries a charge which is lower than that of a 'normal' benzene carbon, which suggests the inductive effect of Nitrogen is also felt by the para carbons across the ring.
Considering the Borazine charge distribution, it shows that each Boron and Nitrogen atom carry the same respective charges as do the Hydrogen atoms bonded to each B and N. The Boron atoms carry a positive charge and the Nitrogen atoms a negative charge, this is as to be expected since Boron is electropositive with respect to Nitrogen and vice versa. The difference in electronegativity between Nitrogen and Boron is greater than the electronegativity difference between both Nitrogen and Carbon and Boron and Carbon, this is demonstrated by the fact that the Nitrogen atoms carry a larger negative charge in Borazine than they do in the Pyridinium cation and that the Boron atoms carry a larger positive charge in Borazine than they do in the Boratabenzene anion.
MO's
| 'real' HOMO of Benzene Analogues | ||||
|---|---|---|---|---|
| Benzene | Boratabenzene Anion | Pyridinium Cation | Borazine | |
 |
 |
 |

| |
| Orbital Energy (au) | -0.25 | 0.01 | -0.48 | -0.28 |
| 'real' HOMO - 1 of Benzene Analogues | ||||
|---|---|---|---|---|
| Benzene | Boratabenzene Anion | Pyridinium Cation | Borazine | |
 |
 |
 |

| |
| Orbital Energy (au) | -0.25 | -0.03 | -0.51 | -0.28 |
| 'real' HOMO - 4 of Benzene Analogues | ||||
|---|---|---|---|---|
| Benzene | Boratabenzene Anion | Pyridinium Cation | Borazine | |
 |
 |
 |

| |
| Orbital Energy (au) | -0.36 | -0.13 | -0.64 | -0.36 |
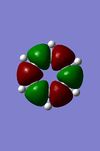
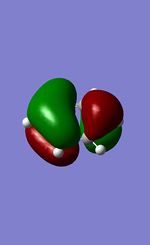
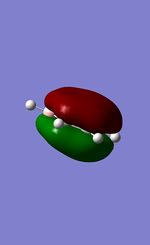
The last table shows the totally pi bonding molecular orbitals of benzene and its 3 analogues. The first observation that can be made is the large areas of delocalisation above and below the plane of the ring and the single nodal plane present in the plane of the ring, this delocalisation is one of the defining factors of aromaticity. In similarity to Benzene, the Borazine delocalised electron cloud is evenly distributed across the ring. One possible explanation for this is that although Boron and Nitrogen do not have identical electronegativities, because there is an even number of both different atoms, the electronegativity difference effectively cancels out, resulting in an even electronic distribution, similar to that of Benzene.
Conversely, the pi cloud in Pyridinium and Boratabenzene is distorted and not evenly distributed across all atoms. Although Nitrogen has a lone pair, this is not involved in the aromaticity of Pyridinium and the electron withdrawing effect of Nitrogen is why the electron cloud is polarised towards Nitrogen. The same effect is reponsible for the distorted electron cloud in Boratabenzene, however Carbon is more electronegative than Boron so there is an area of reduced electron density at the heteroatom in Boratabenzene.
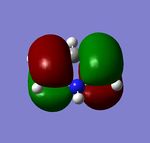
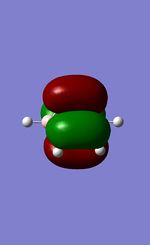
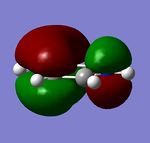
Electronegativity differences across the 3 benzene analogues are also exhibited in the energies of each molecular orbital. Orbital energy depends directly on the electronegativity of the atomic orbitals, the lower the electronegativity, the lower in energy the atomic orbitals are and hence the molecular orbitals. This can be observed from the fact that the Boratabenzene MO has the least negative orbital energy since it is the least electronegative hetereoatom, and the oppositte is true for the pyridinium cation MO. Borazine and Benzene have an identical orbital energy, which further provides evidence for the argument that the electronegativity difference within Borazine effectively 'cancels each other out'.
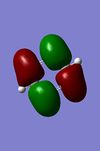
The first two tables show the HOMO and the HOMO-1 orbitals of the benzene analogues. All of these are Pi-type orbtials and each one shows two nodal planes, one in the plane of the ring and the other perpendicular. The trend in orbital energies and distribution of pi electrons across the ring observed is analogous to that described above and the same electronegativity arguments can be made to explain these trends. The HOMO orbital of Benzene and Borazine consists of two double degenerate orbitals, however this degeneracy is lost in the HOMO orbitals of Pyridinium and Boratabenzene, because in both cases, the atomic orbitals from which the MO's are constructed are at different energies, (due to the electronegativity difference present when a heteroatom is incorporated into the ring), which results in a different ordering of MO's in the MO diagram of Boratabenzene and Pyridinium compared with Benzene and Borazine.


