
Rep:Mod:jg2710
BH3 Molecule

Creation and Optimization of BH3
A BH3 molecule was selected in Gaussview templates. All three B-H bond lengths were altered to 1.53, 1.54 and 1.55Å. Optimization were undertaken in Gaussian with the following protocols:
- Method: B3LYP, DFT, LSDA
- Basis Set: 3-21G
- Calculation: OPT
| B-H Bond Length (Å) | H-B-H Bond Angle |
|---|---|
| 1.19 | 120.0 |
| 1.19 | 120.0 |
| 1.19 | 120.0 |
H-B-H bond angles of ca. 120.0o reflect the sp2 hybridization of the trigonal planar BH3 molecule. Optimized B-H lengths are all similar values of 1.19Å. Kawaguchi recognises the B-H bond length in Borane to be 1.19Å experimentally.[1] The value produced using computation appears to stand up to experimental scrutiny.
- File Type: .log
- Calculation Type: FOPT
- Calculation Method: RB3LYP
- Basis Set: 3-21G
- E(RB3LYP):-26.46226429 a.u.
- RMS Gradient Norm: 0.00008851 a.u.
- Dipole Moment: 0.00 Debye
- Point Group: CS
- Job cpu time: 19 seconds
Point groups show discrepancies to real-world data. BH3 is D3h, however no dipole is calculated, contrarry to the CS point group.
Item Value Threshold Converged?
Maximum Force 0.000220 0.000450 YES
RMS Force 0.000106 0.000300 YES
Maximum Displacement 0.000940 0.001800 YES
RMS Displacement 0.000447 0.001200 YES
Predicted change in Energy=-1.672478D-07
Optimization completed.
-- Stationary point found.
----------------------------
! Optimized Parameters !
! (Angstroms and Degrees) !
-------------------------- --------------------------
! Name Definition Value Derivative Info. !
--------------------------------------------------------------------------------
! R1 R(1,2) 1.1948 -DE/DX = -0.0002 !
! R2 R(1,3) 1.1947 -DE/DX = -0.0002 !
! R3 R(1,4) 1.1944 -DE/DX = -0.0001 !
! A1 A(2,1,3) 120.0157 -DE/DX = 0.0 !
! A2 A(2,1,4) 119.986 -DE/DX = 0.0 !
! A3 A(3,1,4) 119.9983 -DE/DX = 0.0 !
! D1 D(2,1,4,3) 180.0 -DE/DX = 0.0 !

--------------------------------------------------------------------------------
Root-mean-squared optimization plot
The top graph shows the steady decrease in system energy as B-H decrease in length as bond optimization calculations are computed. This process involved a six-step reduction in energies. This is as expected, B-H bonds were initially manually set to 1.53, 1.54 and 1.55Å and optimization and then calculation using Gaussview showed the minimal energy structure of BH3 was about 1.19Å. The bottom graph shows the decrease in root-mean-squared gradient as shows the data tends to zero, meaning the molecule has been optimized to have B-H bonds at their energy minima. Whilst the final optimized bond conformation does not yield a RMS value of exactly zero it a very close, suggesting stable-state bond equilibrium between the nuceli has effectively been reached and very little, if any, forces are shifting the atoms. Convergence is also identified by all criteria in the Item Table above and fully optimized structure of borane can be assumed complete.
Improved 6-31G(d,p) Basis-Set
Input:
- Method: B3LYP, DFT
- Basis Set: 6-31G(d,p)
- Calculation: OPT
Output:
- File Type = .log
- Calculation Type = FOPT
- Calculation Method = RB3LYP
- Basis Set = 6-31G(d,p)
- E(RB3LYP) = -26.61532358 a.u.
- RMS Gradient Norm = 0.00008206 a.u.
- Dipole Moment = 0.00 Debye
- Point Group = CS
- Job cpu time: 0 days 0 hours 10 minutes 26.0 seconds
 Item Value Threshold Converged?
Maximum Force 0.000204 0.000450 YES
RMS Force 0.000099 0.000300 YES
Maximum Displacement 0.000875 0.001800 YES
RMS Displacement 0.000418 0.001200 YES
Predicted change in Energy=-1.452109D-07
Optimization completed.
-- Stationary point found.
----------------------------
! Optimized Parameters !
! (Angstroms and Degrees) !
-------------------------- --------------------------
! Name Definition Value Derivative Info. !
--------------------------------------------------------------------------------
! R1 R(1,2) 1.1928 -DE/DX = -0.0002 !
! R2 R(1,3) 1.1926 -DE/DX = -0.0002 !
! R3 R(1,4) 1.1924 -DE/DX = 0.0 !
! A1 A(2,1,3) 120.0146 -DE/DX = 0.0 !
! A2 A(2,1,4) 119.9866 -DE/DX = 0.0 !
! A3 A(3,1,4) 119.9988 -DE/DX = 0.0 !
! D1 D(2,1,4,3) 180.0 -DE/DX = 0.0 !

--------------------------------------------------------------------------------
RMS Gradient Norm=0.00008206 a.u. shows the optimization has resulted in a very small, effectively zero, value for energy against inter-nuclei distance plots. Whilst the final optimized bond conformation does not yield a RMS value of exactly zero it a very close, suggesting stable-state bond equilibrium between the nuceli has effectively been reached and very little, if any, forces are shifting the atoms. Convergence is also identified by all criteria in the Item Table above and fully optimized structure of borane can be assumed complete. Above shows forces have converged, incremental changes in bond distances do not effect energy values at this point. Optimizations have been completed to yield low-energy minima for bonds in the molecule.
| B-H Bond Length (Å) | H-B-H Bond Angle |
|---|---|
| 1.19 | 120.0 |
| 1.19 | 120.0 |
| 1.19 | 120.0 |
Bond lengths and angles here are only marginally different here that to the previous optimization. As before both angles and lengths calculated reflect real-world values of angles and bond lengths as shown in the previous section against literature values.
BH3 Basis Set Comparison
| Basis Set | E(RB3LYP) (a.u.) | E(RB3LYP) (kJmol-1) |
|---|---|---|
| 3-21G | -26.4622643 | -69476.67 |
| 6-31G(d,p) | -26.6153236 | -69878.53 |
| dE | 0.1530593 | 401.86 |
Altering the basis set from 3-21G to 6-31G(d,p) yields a significantly different (ca. 402 kJmol-1) energy value for the molecule. Although direct comparison is not possible with differing basis sets we can see the significant changes that arise when a more optimized basis set is executed. Bond lengths and angles in both BH3 optimizations are very similar. It should be noted variation can be due to rounding errors in calculations as well as differences that basis sets apply.
GaBr3

Input:
- Symmetry Fixed: D3h
- Method: B3LYP, DFT
- Basis Set: LanL2DZ
- Job Type: OPT
LanL2DZ basis set utilizes a D95V basis set for simpler first row atoms and Los Alamos ECP, pseudo potentials, on heavier elements in order to simplify calculations of the core non-valence electrons.
Output:
- File Type = .log
- Calculation Type = FOPT
- Calculation Method = RB3LYP
- Basis Set = LANL2DZ
- E(RB3LYP) = -41.70082494 a.u.
- RMS Gradient Norm = 0.00023596 a.u.
- Dipole Moment = 0 Debye
- Point Group = D3H
- Job cpu time: 0 days 0 hours 0 minutes 19.0 seconds.
.log Output File[2]
Item Value Threshold Converged?
Maximum Force 0.000000 0.000450 YES
RMS Force 0.000000 0.000300 YES
Maximum Displacement 0.000003 0.001800 YES
RMS Displacement 0.000002 0.001200 YES
Predicted change in Energy=-1.282673D-12
Optimization completed.
-- Stationary point found.
----------------------------
! Optimized Parameters !
! (Angstroms and Degrees) !
-------------------------- --------------------------
! Name Definition Value Derivative Info. !
--------------------------------------------------------------------------------
! R1 R(1,2) 2.3502 -DE/DX = 0.0 !
! R2 R(1,3) 2.3502 -DE/DX = 0.0 !
! R3 R(1,4) 2.3502 -DE/DX = 0.0 !
! A1 A(2,1,3) 120.0 -DE/DX = 0.0 !
! A2 A(2,1,4) 120.0 -DE/DX = 0.0 !
! A3 A(3,1,4) 120.0 -DE/DX = 0.0 !
! D1 D(2,1,4,3) 180.0 -DE/DX = 0.0 !

--------------------------------------------------------------------------------
Root-mean-squared optimization plot
RMS Gradient Norm=0.00023596 a.u. shows the optimization has resulted in a very small, effectively zero, value for energy against inter-nuclei distance plots. Whilst the final optimized bond conformation does not yield a RMS value of exactly zero it a very close, suggesting stable-state bond equilibrium between the nuceli has effectively been reached and very little, if any, forces are shifting the atoms. Convergence is also identified by all criteria in the Item Table above and fully optimized structure of GaBr3 can be assumed complete. Above shows forces have converged, incremental changes in bond distances do not effect energy values at this point. Optimizations have been completed to yield low-energy minima for bonds in the molecule.
| Ga-Br Bond Length (Å) | Br-Ga-Br Bond Angle |
|---|---|
| 2.35 | 120.0 |
| 2.35 | 120.0 |
| 2.35 | 120.0 |
Exact angles of ideal 120.0o between each Ga-Br bonds are expected experimentally, however constraining the molecule prior to calculation at D3h forces calculations to not deviate from this ideal angle, previous BH3 calculations did not yield ideal trigonal planar structure for the same D3h point group structure due to symmetry not being constrained. This symmetry factor is also represented by the lack of dipole compared to previous computations, the dipole is a result of symmetry of all the unimolecular ligands and their symmetrical environments cancelling dipolarity in the molecule. In previous models slight deviations from this perfectly idealized symmetrical model causes as slight dipole. Although BH3 has very similar angles, close to the ideal, the deviation is due to incremental errors/rounding error during the calculation and a restriction of the basis set-however rounding error will be the contributing factor.
All angles in GaBr3 are identical, for the exact same reason of conforming to D3h symmetry. Experimental bond lengths for Ga-Br are at 2.35Å.[3] This confirms the computed value is very close to experimental data, differing by a very small amount. The approximations implemented in this calculation have yielded very little error for this molecule. Wells et al. have also shown the Ga-Br bond length in metal complexes to be around 2.32Å.[4] Which supports a very similar value to that extracted from the CRC handbook and adds further validity to calculated Ga-Br bond distances.
BBr3

Input:
- Method: B3LYP, DFT
- Basis Set: GEN (Boron: 6-31G(d,p), Bromine: LanL2DZ)
- Additional Keyword: pseudo=read gfinput
- Calculation: OPT
Individual basis sets for the small Boron and larger Bromine atoms are designated under GEN basis set and sub-sets. LanL2DZ allows for psuedo-potentials of all non-valence core-electrons in the atom to simplify electrons and treat then as negative potentials.
Output:
- File Type= .log
- Calculation Type= FOPT
- Calculation Method= RB3LYP
- Basis Set= Gen
- E(RB3LYP)= -64.43645051 a.u.
- RMS Gradient Norm= 0.00001118 a.u.
- Dipole Moment= 0.00 Debye
- Point Group= CS
- Job cpu time: 0 days 0 hours 0 minutes 43.8 seconds.
.log Output File[5]
Item Value Threshold Converged?
Maximum Force 0.000020 0.000450 YES
RMS Force 0.000011 0.000300 YES
Maximum Displacement 0.000078 0.001800 YES
RMS Displacement 0.000044 0.001200 YES
Predicted change in Energy=-1.118315D-09
Optimization completed.
-- Stationary point found.
----------------------------
! Optimized Parameters !
! (Angstroms and Degrees) !
-------------------------- --------------------------
! Name Definition Value Derivative Info. !
--------------------------------------------------------------------------------
! R1 R(1,2) 1.9339 -DE/DX = 0.0 !
! R2 R(1,3) 1.934 -DE/DX = 0.0 !
! R3 R(1,4) 1.9339 -DE/DX = 0.0 !
! A1 A(2,1,3) 119.9968 -DE/DX = 0.0 !
! A2 A(2,1,4) 119.9967 -DE/DX = 0.0 !
! A3 A(3,1,4) 120.0064 -DE/DX = 0.0 !
! D1 D(2,1,4,3) 180.0 -DE/DX = 0.0 !
--------------------------------------------------------------------------------
Root-mean-squared optimization plot
RMS Gradient Norm=0.00001118 a.u. shows the optimization has resulted in a very small, effectively zero, value for energy against inter-nuclei distance plots. Whilst the final optimized bond conformation does not yield a RMS value of exactly zero it a very close, suggesting stable-state bond equilibrium between the nuceli has effectively been reached and very little, if any, forces are shifting the atoms. Convergence is also identified by all criteria in the Item Table above and fully optimized structure of BBr3 can be assumed complete. Above shows forces have converged, incremental changes in bond distances do not effect energy values at this point. Optimizations have been completed to yield low-energy minima for bonds in the molecule.
| B-Br Bond Length (Å) | Br-B-Br Bond Angle |
|---|---|
| 1.93 | 120.0 |
| 1.93 | 120.0 |
| 1.93 | 120.0 |
Bond angles of ca. 120.0o again reflect the D3h trigonal planar nature of the molecule and all molecules calculated thus far. Bond lengths of ca. 1.93Å are similar to experimental values by Krossing and Santiso-Quinones of 1.90Å in BBr3.[6] The CRC gives the bond length in the same molecule as 1.89Å.[7] Suggesting real-world values for the B-Br bond in BH3 have been accurately calculated in the above model
BH3, BBr3, and GaBr3 Analysis
| Molecule | Mean M-X Bond Length (Å) | Mean X-M-X Bond Angle |
|---|---|---|
| GaBr3 | 2.35 | 120.0 |
| BH3* | 1.19 | 120.0 |
| BBr3 | 1.93 | 120.0 |
(*) BH3 optimized with Improved 6-31G(d,p) Basis-Set
M= B, Ga X= H, Br
All molecules yield bond angles of 120.0o, ideal trigonal planar bond angle separation that puts all ligand atoms as far apart as possible, reducing intramolecular repulsion. This is the idealized angle separation of a central sp2 hybridized coordination center and is achieved by the three computed molecules as they each have uni-molecular ligand groups of either H or Br.
Energies of all molecules above cannot be compared due to differing force fields and basis-sets involved in their calculation. Instead bond length and angle analysis can be ascertained and the molecules analysed in that respect.
Ligands

Upon analyzing BH3* and BBr3 we can see the effects of changing ligand. When bromine is the ligand the bond length is a longer and weaker bond in the molecule. Hydrogen is smaller and less electronegative that bromine. As a result hydrogen is has less steric repulsion compared to Bromine. However both Ga and B are electron deficient atoms in the complex and have an empty p-orbital (shown in red above) that can accept electron density via π-donation of the ligands. Hydrogen has no p-orbitals and therefore lacks this interaction. Bromine has p-orbitals and enough electron density to donate to the empty p-orbital, increasing bond order in the B/Ga-Br bond and shortening/strengthening. This same phenomena applies to Ga and its empty p-orbital. As shown in the Molecular Orbital diagram, the electrons in the atomic p-orbital of Bromine gain stability by interaction with the empty Boron atomic orbital forming a stabilized molecular orbital and a stabilized molecular orbital. Since only two electrons are involved the net effect is stabilization and increased bond order. BBr3 and GaBr3 benefit from this stabilization energy (E2) three times per molecule whereas BH3 gains no stability in this way.

Bromine is part of the 4th period along with Ga. Boron is in the first period. The expected overlap of the Br and Ga atoms is well matched due to the size of the atoms. The match in size and energy of the atoms means their orbitals will overlap more and create more stability/strength in the Ga-Br bond compared to B-Br. If we compare BBr3 and BH3 B-H bonds will have better overlap due to their similarity in atomic and therefore orbital sizes compared to B-Br. Boron and Hydrogen also have very similar electronegativity (χ(B)=2.0, χ(H)=2.1). This similar orbital energy is also favorable when considering orbital overlap. Bromine has a rather similar electronegativity to boron (χ(Br)=2.8) and so orbital overlap will not be due unfavorable due to mismatches of energies.
Overall the lack of steric repulsions due to the close proximity of the ligands around a small Boron atom and better orbital overlap of the similar sized Hydrogen compared to the large mismatched energy and size of Bromine ligand; means B-H bonds are stronger and shorter and outweigh the lack of p-orbitals to donate electron density into the empty Borone p-orbital, that Bromine offers.
Central Atom
To compare the central atom, GaBr3 and BBr3 are assessed. The Ga-Br bonds are considerably larger than B-Br. Boron and Gallium both belong to the Group 13/Boron Group in the Periodic Table. These atoms are electron deficient with only 1 electron occupying the p-orbital in the atoms valence shell. Boron is smaller than Gallium, however trends in atom radii are not smooth due to the introduction of the d-orbitals in Gallium. Both atoms can form the required M3+ state and tri-substitution with hydrogen or halogens require dimerization in order to allow stability of the molecule and satisfy the electron density in the molecule. Whilst both molecules exist as dimers and therefore will have bridging ligand groups resulting in low bond order 3c-2e interactions resulting in longer/weaker bonds; all experimental/literature data provided gives bond lengths for a single molecule which lacks the weakened M-Br bonds in dimers. The small size of boron causes potential issues if bulky ligand groups occupy its vacant sites as clashing between them may cause instability. However hydrogen, but not bromine, is small enough that this phenomena should not cause significant instability in the molecule. Furthermore extension of the orbital overlap mismatch mentioned in the above section applies here for the same reasons.
Whilst there may be electronic repulsions of larger Br ligands around the small B central atom the sheer size of the Ga atom results in a large distance between Ga and Br. The addition of a p-orbital and d-orbital in Ga compared to B results in a very large atomic radii meaning the internuclei distance is further in this bond and by extension weaker.
Analysis of Bonding in Gaussian
Gaussian/Gaussview assume a bond is formed if the internuclei distance between two atoms is within a certain distance threshold. If the distance is above this Gaussian/Gaussview does not consider the interaction to be a bond. Whilst in general this accurately determines the interactions of two atoms well; there are drawbacks and potentials exceptions to the rule. IUPAC defines a chemical bond as the "forces acting between two atoms or group that leads to a stable independent molecular entity...a region between nuclei of constant potential contours that allows the potential energy to improve substantially...". The definition continues to encompass covalent, ionic and even weaker bonds that link two molecules such as O2 to O4. The concept of a formal bond, stems around the overlap of two orbitals for covalent bonding. The symmetry of these orbital overlaps then defines the type of bond: sigma, pi, delta, etc. Ionic bonding on the other hand involves redox-type reactions in order to bond and complete electronic configurations of each atom.
Hydrogen bonding, despite the name, is considered a stabilizing association rather than a bond. IUPAC defines it as "...considered as an electrostatic interaction, heightened by the small size of hydrogen, which permits proximity of the interacting dipoles or charges...". No sigma, pi or delta-type overlap of bonding orbitals is maintained in this interaction and therefore the H-bonding is defines as an interaction of associative properties rather than a formal bond. H-bonding tends to be of a larger distance than sigma bonding and its analogs and is not detected as a bond by Gaussian.
Because ionic and covalent bonding is a close-range electron interaction, the assumption of threshold value for Gaussian holds true. However non-formal-bonding distances can occur between atoms that is well within the bonding range of two atoms. Emer et al. have synthesized molecules that force H--H interactions that are not bonding in a molecule to within 2Å. Whilst the bond order and amount of bonds hydrogen can form prevents any more than one bond to hydrogen, the study shows that atoms can be forces very near to each other and not be bonding. Whilst non-bonding interactions of this magnitude are unlikely are require a very rigid molecule, it shows it is possible to be within a bond distance threshold limit, like that in Gaussian and not be bonding.[8]
The longest C-C bond discovered by Schreiner et al. only manages to produce a bond length of 1.704Å, which Gaussian permits as a bond.[9] This large bond length is caused by significant steric strain/hindrance and any further bond distance results in dissociation of the bond. When Gaussian does not show a bond between two atoms, most of the time this will be an accurate representation of electronic interactions. Whilst there may be some small overlap of orbitals between the two nuceli; there will most often not be enough electron density to form a reasonably strong stabilizing effect of the potential energy of an independent molecule with the two atoms bonded from a far distance. Bonding requires good orbital overlap and good energy matching of these orbitals. Therefore large internuclei distance results in poor orbital overlap and the bond, or interaction, is likely to be very weak; if existing at all.
Frequency Analysis
Frequency Analysis for BH3
Input:
- Method: B3LYP, DFT, LSDA
- Basis Set: 6-31G(d,p)
- Calculation: FREQ
Output:
- File Type = .log
- Calculation Type = FREQ
- Calculation Method = RB3LYP
- Basis Set = 6-31G(d,p)
- E(RB3LYP) = -26.61532358 a.u.
- RMS Gradient Norm = 0.00 a.u.
- Dipole Moment = 0.0003 Debye
- Point Group = CS
- Job cpu time: 0 days 0 hours 0 minutes 6.0 seconds
.log file for BH3 frequency analysis
E(RB3LYP) in exactly the same for frequency analysis as optimization analysis, taken previously for BH3. The structures for both analyses are therefore the same.
Item Value Threshold Converged?
Maximum Force 0.000189 0.000450 YES
RMS Force 0.000082 0.000300 YES
Maximum Displacement 0.000784 0.001800 YES
RMS Displacement 0.000317 0.001200 YES
Predicted change in Energy=-1.377853D-07
Optimization completed.
-- Stationary point found.
RMS Gradient Norm of 0.00008196 a.u. shows the molecule has effectively optimized with a root-mean-squared value of near zero shows the structure is very near the point of energy minima. Convergence of all items in the item table above confirms the molecule has been optimized.
 Low frequencies --- -0.0010 -0.0004 0.0001 33.8248 41.5750 43.6814
Low frequencies --- 1163.5015 1213.4681 1213.5876
Values of first row low frequencies above deviates significantly from zero. Calculations were repeated however the BH3 molecule was now restrained and optimized to D3h symmetry by invoking keyword:int=ultrafine scf=conver=9 to constrain the molecule, initial attempts resulted in changes to symmetry of C3H.
Output for D3h optimization:
- File Type = .log
- Calculation Type = OPT
- Calculation Method = RB3LYP
- Basis Set = 6-31G(d,p)
- E(RB3LYP) = -26.61532341 a.u.
- RMS Gradient Norm = 0.00009654 a.u.
- Dipole Moment = 0.00 Debye
- Point Group = D3H
- Job cpu time: 0 days 0 hours 0 minutes 18.0 seconds
Output for D3h Frequency Analysis:
- File Type = .log
- Calculation Type = FREQ
- Calculation Method = RB3LYP
- Basis Set = 6-31G(d,p)
- E(RB3LYP) = -26.61532364 a.u.
- RMS Gradient Norm = 0.00000071 a.u.
- Dipole Moment = 0.00 Debye
- Point Group = D3H
- Job cpu time: 0 days 0 hours 0 minutes 27.0 seconds
.log file for BH3 frequency analysis
 Item Value Threshold Converged?
Maximum Force 0.000001 0.000450 YES
RMS Force 0.000001 0.000300 YES
Maximum Displacement 0.000006 0.001800 YES
RMS Displacement 0.000003 0.001200 YES
Predicted change in Energy=-1.173379D-11
Optimization completed.
-- Stationary point found.
The very low RMS gradient shows optimization is effectively zero and accurate, convergence in the item table confirms this. E(RB3LYP)value has changed slightly however only by a small amount of decimal places, we can therefore assume structure has remained effectively the same-the difference is due to restriction of D3h symmetry during the optimization process. This is confirmed by the lack of dipole due to the symmetry of the point group.
Low frequencies --- -10.1940 -10.1821 -3.1776 -0.0008 0.0579 0.4920
Low frequencies --- 1162.9850 1213.1461 1213.1463
Low frequency analysis yields near-zero motions of center of mass. The largest frequency is -10cm-1 and is reasonable. Below are the frequencies of the molecule with symmetry labels:
 1 2 3
A2" E' E'
Frequencies -- 1162.9850 1213.1461 1213.1463
Red. masses -- 1.2531 1.1072 1.1072
Frc consts -- 0.9986 0.9600 0.9600
IR Inten -- 92.5671 14.0555 14.0549

Atom AN X Y Z X Y Z X Y Z
1 5 0.00 0.00 0.16 -0.10 0.00 0.00 0.00 0.10 0.00
2 1 0.00 0.00 -0.57 0.81 0.00 0.00 0.00 0.08 0.00
3 1 0.00 0.00 -0.57 0.14 0.39 0.00 -0.39 -0.59 0.00
4 1 0.00 0.00 -0.57 0.14 -0.39 0.00 0.39 -0.59 0.00

 4 5 6
A1' E' E'
Frequencies -- 2582.5447 2715.6778 2715.6788
Red. masses -- 1.0078 1.1273 1.1273
Frc consts -- 3.9603 4.8985 4.8985
IR Inten -- 0.0000 126.3333 126.3273

Atom AN X Y Z X Y Z X Y Z
1 5 0.00 0.00 0.00 0.11 0.00 0.00 0.00 0.11 0.00
2 1 0.00 0.58 0.00 0.02 0.00 0.00 0.00 -0.81 0.00
3 1 0.50 -0.29 0.00 -0.60 0.36 0.00 0.36 -0.19 0.00
4 1 -0.50 -0.29 0.00 -0.60 -0.36 0.00 -0.36 -0.19 0.00
BH3 Animated Vibrations
| # | Vibration Form | Frequency (cm-1) | Intensity (ε) | Symmetry D3h Point Group |
|---|---|---|---|---|
| 1 |  All H atoms move up a down together in a concerted fashion as the central B atom remains stationary |
1163 | 93 | A2" |
| 2 |  Two H atoms moving in roughly equal-but-opposite directions whilst the final H moves with greater magnitude in one direction. All H movement occurs in the same plane whilst B stains motionless. |
1213 | 14 | E' |
| 3 |  Two H atoms move in the same lane towards each other with the same magnitude. The remaining H and B atoms remain stationary. |
1213 | 14 | E' |
| 4 |  All 3 H atoms move concerted in the same plane with the same magnitude away from the central, motionless B atom. |
2583 | 0 | A1' |
| 5 |  Two H atoms move with equal magnitude in a non-concerted/alternating fashion in the same plane. One H moves towards the stationary B atom, whilst the other H moves away from B. When one H is at its nearest point to B the other is at its further point from B, vice versa. B and the remaining H are stationary. |
2716 | 126 | E' |
| 6 |  All H atoms move in the same plane and away from stationary B. Two H atoms move in equal magnitudes away from B in a concerted fashion. The other H moves with more magnitude in an alternate fashion to the other H atoms. When the single H is at its further from B the other H atoms are at their nearest to B, vice versa. |
2716 | 126 | E' |
IR detection requires a dipole in order to be detectable in IR spectroscopy. Therefore vibrational modes such as 4 where also atoms move concertedly with the same directionality and magnitude cancel dipoles induced by stretching of the B-H bond. This is further confirmed but an Infrared Value of 0cm-1 Despite B and H having in-equivalent electronegativities and therefore a dipole, the symmetrical nature of the BH3 cancels the overall dipole of the molecule. The difference in electronegativity between B and H is the reason why all other asymmetrical vibrational modes (1, 2, 3 and 5) are IR active as the overall dipoles are not cancelled out. Furthermore the degenerate, same-symmetry vibrational modes of E' in modes 5 and 6. They have the same frequency and are detected at the same place in IR spectra, they will most likely appear as one degenerate signal rather than two. Thus only 3 peaks are seen in the spectrum.
Frequency analysis for GaBr3
Input files for this FREQ calculation were from the resulting optimized output file of GaBr3 optimization previously.
Input:
- Symmetry Fixed: D3h
- Method: B3LYP, DFT
- Basis Set: LanL2DZ
- Job Type: FREQ
Output:[10]
- File Type = .log
- Calculation Type = FREQ
- Calculation Method = RB3LYP
- Basis Set = LANL2DZ
- E(RB3LYP) = -41.70082783 a.u.
- RMS Gradient Norm = 0.00000011 a.u.
- Dipole Moment = 0 Debye
- Point Group = D3H
- Job cpu time: 0 days 0 hours 0 minutes 12.3 seconds.
Item Value Threshold Converged?
Maximum Force 0.000000 0.000450 YES
RMS Force 0.000000 0.000300 YES
Maximum Displacement 0.000002 0.001800 YES
RMS Displacement 0.000001 0.001200 YES
Predicted change in Energy=-6.142796D-13
Optimization completed.

-- Stationary point found.
E(RB3LYP) values for both OPT (in above section) and FREQ are very similar. We can assume with confidence that structure has been maintained and IR interpretation of the data is valid. Retention of non-dipolar D3h point groups in the output summary file show that fixed symmetric structure was maintained. Continued use of psuedo-potentials was also maintained. RMS Gradient Norm = 0.00000011 a.u. confirms the molecule was optimized to a near-zero gradient optimization. This is confirmed by the convergence in the item table.
 Low frequencies --- -0.5252 -0.5247 -0.0024 -0.0010 0.0235 1.2011
Low frequencies --- 76.3744 76.3753 99.6982
Low frequency analysis of the first row so near-zero values for motion at center of mass and this data can be interpreted with confidence of its validity.
 1 2 3
E' E' A2"
Frequencies -- 76.3744 76.3753 99.6982
Red. masses -- 77.4211 77.4212 70.9513
Frc consts -- 0.2661 0.2661 0.4155
IR Inten -- 3.3447 3.3447 9.2161
Atom AN X Y Z X Y Z X Y Z
1 31 -0.39 0.00 0.00 0.00 -0.39 0.00 0.00 0.00 0.89
2 35 0.63 0.00 0.00 0.00 -0.41 0.00 0.00 0.00 -0.26
3 35 -0.15 0.45 0.00 0.45 0.37 0.00 0.00 0.00 -0.26
4 35 -0.15 -0.45 0.00 -0.45 0.37 0.00 0.00 0.00 -0.26
4 5 6
A1' E' E'
Frequencies -- 197.3371 316.1825 316.1863
Red. masses -- 78.9183 72.2067 72.2066
Frc consts -- 1.8107 4.2531 4.2532
IR Inten -- 0.0000 57.0704 57.0746
Atom AN X Y Z X Y Z X Y Z
1 31 0.00 0.00 0.00 0.82 0.00 0.00 0.00 0.82 0.00
2 35 0.00 0.58 0.00 -0.01 0.00 0.00 0.00 -0.47 0.00
3 35 0.50 -0.29 0.00 -0.35 0.20 0.00 0.20 -0.12 0.00

4 35 -0.50 -0.29 0.00 -0.35 -0.20 0.00 -0.20 -0.12 0.00
GaBr3 Animated Vibrations
| # | Vibration Form | Frequency (cm-1) | Intensity (ε) | Symmetry D3h Point Group |
|---|---|---|---|---|
| 1 |  All atoms move in same plane, the B atom moves side ways. One H atom moves to bend the B-H bond, whilst the other 2 H atoms move alternately, 1 H towards B whilst the other moves away from B, vice versa. |
76 | 3 | E' |
| 2 |  All atoms move the in the plane. 2 H atoms move concertedly away from one another with same magnitude. The remaining B and H atom move with same magnitude so that this B-H interaction is constant. This B and H atom move towards the two H atoms but with less magnitude in the same plane. |
76 | 3 | E' |
| 3 |  Atoms are moving in the same plane, perpendicular to the motions in 1 and 2. B moves in the opposite direction to all three H's and with greater magnitude. All 3 H atoms move concerted with the same magnitude and direction. |
100 | 9 | A2" |
| 4 |  B is stationary. All three H's move concerted with the same magnitude away from the central B atom. All actions occur in same plane. |
197 | 0 | A1' |
| 5 |  One H is stationary, B moves with largest magnitude perpendicular to the stationary H atoms B-H bond. The other two H atoms move alternatively with less magnitude than B. As one H atom is furthest away from B, the other is closest, vice versa. |
316 | 57 | E' |
| 6 |  All atoms move in the same plane. B and one H move concertedly towards each other with same magnitude. The other two H atoms move concertedly away from B with less magnitude. |
316 | 57 | E' |
6 vibrational modes are present, however only 3 signals appear in the IR. This is because mode 4 is IR inactive due to the symmetrical stretch of the mode cancelling out a dipole which is require for IR to detect it. Further more 1+2 and 5+6 are degenerate modes and will have the same energy so appear at the same frequency on a IR spectra.
Frequency Analysis Comparison of BH3 and GaBr3
| BH3 | GaBr3 | |||||
| Mode | Frequency (cm-1) | IR (cm-1) | Point Group | Frequency (cm-1) | IR (cm-1) | Point Group |
| 1 | 1163 | 93 | A2" | 76 | 3 | E' |
| 2 | 213 | 14 | E' | 76 | 3 | E' |
| 3 | 1213 | 14 | E' | 100 | 9 | A2" |
| 4 | 2583 | 0 | A1' | 197 | 0 | A1' |
| 5 | 2713 | 126 | E' | 316 | 57 | E' |
| 6 | 2716 | 126 | E' | 316 | 57 | E' |
Both molecules possess the same symmetry groups: 4x E', A2" and A1'. This is rationalized by the overall symmetry of both molecules being D3h and therefore its orbitals possessing the same symmetries, and by extension degeneracy. Overall the frequency values for BH3 are larger than GaBr3. High frequency (and also IR wavenumber signal) means higher energy in the bond vibration.
E=hv (h=planck's constant, v=frequency) and E=hc/λ=hcw (c=speed of light constant, λ=wavelength, w=wavenumber). Increasing v or w here increases E.
This larger energy suggests that the bonds are stronger in BH3 than GaBr3. this is supported by the bond length analysis made previously. Ga-Br mean bond length was calculated and supported experimentally to be 2.35Å where as B-H bonds were found to be 1.19Å. The shorter bonds coincide with stronger bonds and the difference was rationalized to be due to the large size of the Ga atom compared to Br, affecting both sterics and orbital overlap. This means more energy is required to vibrate the stronger B-H bond and therefore its vibrational energies will be higher than Ga-Br vibrations-and by extension have higher frequencies and wavenumbers in the spectra.
There is clearly a reordering of the modes when comparing the first three modes of both molecules molecular orbital symmetry. In BH3 the A2" vibration is the more energetic than the 2xE' vibrational modes, whereas in GaBr3 it is less energetic than the 2xE' modes. Upon inspection of these three modes for both molecules we see that the B atom is stationary in all three whereas the Ga atom shows displacement vectors for all three vibrational modes. Focusing on the A2" mode, when in the planar D3h structure there is good orbital overlap between the H/Br ligands and the central B/Ga atom. However hydrogen only has a s-orbital available. Therefore in the bonding molecular orbital, bending the molecule via vibrations to a more C3v like molecule, there is equal change in overlap with Br and H. However Br ligands have the available p-orbitals (in bonding conformation). When the GaBr3 molecule is bent towards a C3v symmetry molecular orbital the p-orbitals experience a greater amount of interaction-previously in the D3h mode of the molecule (ineraction of black-phase). This is a favorable interaction and therefore the energy of this mode is lower in GaBr3 compared to BH3.

Because the two molecules have the same point group symmetries for all vibrational modes, they also have similar IR spectrum signals due to the IR inactive A1' and degenerate E1 modes. Therefore only 3 peaks are seen in both. 2 peaks to the left hand side of the spectrum and 1 peak to the right. The two peaks (E1' degenerate and A2") to the left hand side of the spectrum for both molecules are significantly lower energy than the single peak (E') on the right hand side. It should be noted the IR inactive A1' mode is also higher in energy. This is because the two peaks (2xE1' and A2") are lower energy bending modes and the higher energy signal correspond to degenerate 2xE1' stretching vibrations. Stretching requires more energy as orbital overlap is decreasing and therefore appears at higher frequencies/energy on the IR spectrum.
The same method and basis sets need to be utilized for optimization and frequency analysis calculations. If the same method, basis and keywords are not invoked the structure/configuration of the molecule may change during FREQ calculations and give invalid results as the molecule will no longer be optimized. Changing basis sets means different assumptions are being made about the molecule in order improve or simplify calculations. Therefore if the basis set is different for FREQ and OPT calculations, different assumptions are being made and the output values for each allocations will give incorrect results.
6 different vibrations were detected for both molecules. Using the 3n-6 rule, where n=3 here, yields 3. Therefore as shown in the IR spectrum of both, 3 IR active signals are detected. The first row of "low frequencies", which needs to be a near-zero value corresponds to the movement of individual atoms. Perfect optimization will assume that the motion center of mass at each atom is zero with respect to other nuceli. This is the Born-Oppenheimer approximation where the Schrodinger equation for electrons can assume nuclei are motionless due to there large size. They therefore act like particles compared to the wave-particle duality of small mass species like electrons. This greatly simplifies calculations and idealized optimizations will have followed the Born-Oppenheimer approximation perfectly to reduce first-row low frequencies to zero. The second row of low frequencies are the motions of the individual vibrational modes, shown previously.
NBO Analysis for BH3
Input files for this ENERGY calculation were from the resulting optimized output file of BH3 optimization previously.
Input:
- Job Type: ENERGY
- Keyword: pop=full
- NBO: Full NBO
Output:
- File Type = .log
- Calculation Type = SP
- Calculation Method = RB3LYP
- Basis Set = RB3LYP
- E(RB3LYP) = -26.61532358 a.u.
- RMS Gradient Norm = 0.00000011 a.u.
- Dipole Moment = 0 Debye
- Point Group = CS
- Job cpu time: 0 days 0 hours 0 minutes 7.0 seconds.
No item table available
.log file for BH3 NBO analysis

The differences between LCAO MOs and the real MOs are very small. Side by side the rationalization from LCAO to real MO is obvious. There are clear distinctions between in and out of phase orbitals that create nodes in real MOs. Whilst LCAO theory does not give a picture of the overall MO for the whole molecule, as in real MOs, it can be easily rationalized. For example the second most stable MO in the diagram above has a LCAO that has all 3H and B in the same phase, bonding. Instead of separate atomic orbitals around each atom the real MO shows a bonding, single-phase orbital around the entire molecule that can easily be rationalized when looking at the all-in-phase LCAO. This shows qualitatively that using LCAO to postulate real MO can be very accurate and with good interpretation of the LCAO a rational diagram of an MO can be formed using LCAO theory and it imitates real MOs very accurately.
The real MOs computed were able to, like the LCAO method, identify degenerate molecular orbitals along with the non-bonding a2" orbital. The main difference between the two MO diagrams are in the fact that the LCAO diagrams show the orbitals are individual atomic orbitals, as its name suggests, rather than a combined overall orbital as in real MOs.
NH3 Analysis

Input:
- Method: B3LYP, DFT
- Basis Set: 6-31G(d,p)
- Calculation: OPT
Output:
- File Type = .log
- Calculation Type = FOPT
- Calculation Method = RB3LYP
- Basis Set = 6-31G(d,p)
- E(RB3LYP) = -56.55776872 a.u.
- RMS Gradient Norm = 0.00000136 a.u.
- Dipole Moment = 1.85 Debye
- Point Group = C1
- Job cpu time: 0 days 0 hours 0 minutes 7.0 seconds.
 Item Value Threshold Converged?
Maximum Force 0.000004 0.000015 YES
RMS Force 0.000001 0.000010 YES
Maximum Displacement 0.000008 0.000060 YES
RMS Displacement 0.000004 0.000040 YES
Predicted change in Energy=-1.775888D-11
Optimization completed.
-- Stationary point found.
----------------------------
! Optimized Parameters !
! (Angstroms and Degrees) !
-------------------------- --------------------------
! Name Definition Value Derivative Info. !
--------------------------------------------------------------------------------
! R1 R(1,2) 1.018 -DE/DX = 0.0 !
! R2 R(1,3) 1.018 -DE/DX = 0.0 !
! R3 R(1,4) 1.018 -DE/DX = 0.0 !
! A1 A(2,1,3) 105.7447 -DE/DX = 0.0 !
! A2 A(2,1,4) 105.7444 -DE/DX = 0.0 !
! A3 A(3,1,4) 105.7443 -DE/DX = 0.0 !
! D1 D(2,1,4,3) -111.8636 -DE/DX = 0.0 !
--------------------------------------------------------------------------------
.log file for NH3 optimization
RMS gradient of zero and confirmed convergence of the item table suggests the molecule has been fully optimized to a low energy minima under the basis set and method provided above. This output file was then used for frequency analysis in the calcualtion below.
Input:
- Method: B3LYP, DFT
- Basis Set: 6-31G(d,p)
- Calculation: FREQ
Output:
- File Type = .log
- Calculation Type = FREQ
- Calculation Method = RB3LYP
- Basis Set = 6-31G(d,p)
- E(RB3LYP) = -56.55776872 a.u.
- RMS Gradient Norm = 0.00000124 a.u.
- Dipole Moment = 1.85 Debye
- Point Group = C1
- Job cpu time: 0 days 0 hours 0 minutes 9.0 seconds.
.log file for NH3 frequency analysis
 Item Value Threshold Converged?
Maximum Force 0.000003 0.000450 YES
RMS Force 0.000001 0.000300 YES
Maximum Displacement 0.000007 0.001800 YES
RMS Displacement 0.000003 0.001200 YES
Predicted change in Energy=-1.692007D-11
Optimization completed.

-- Stationary point found.
Convergence of items and continued RMS gradient of zero shows the same configuration is present here in the FREQ calculation as the OPT calculation. E(RB3LYP) is the same for FREQ and OPT calculations therefore structure/configuration of the NH3 molecule is the same as differences in energies would have suggested a different organization of electrons and nuclei in the molecule.
Low frequencies ---   -9.2109   -8.1223   -6.2020   -0.0012   -0.0008    0.0012
 Low frequencies --- 1089.3374 1693.9211 1693.9250
Low frequencies of first row show that ammonia has been optimized as the frequencies are near zero. No negative frequencies are present in the bottom row showing optimization has occurred correctly and given viable results.
 1 2 3
A A A
Frequencies -- 1089.3374 1693.9211 1693.9250
Red. masses -- 1.1800 1.0644 1.0644
Frc consts -- 0.8250 1.7995 1.7995
IR Inten -- 145.4308 13.5574 13.5575
Atom AN X Y Z X Y Z X Y Z
1 7 0.12 0.00 0.00 0.00 0.07 0.00 0.00 0.00 -0.07
2 1 -0.53 -0.21 0.00 0.26 0.15 0.01 0.00 0.00 0.76
3 1 -0.53 0.11 0.18 -0.13 -0.54 0.39 0.23 -0.39 0.08
4 1 -0.53 0.11 -0.18 -0.13 -0.53 -0.39 -0.22 0.40 0.08
4 5 6
A A A
Frequencies -- 3461.3887 3589.9232 3589.9605
Red. masses -- 1.0272 1.0883 1.0883
Frc consts -- 7.2514 8.2639 8.2641
IR Inten -- 1.0592 0.2697 0.2698
Atom AN X Y Z X Y Z X Y Z
1 7 0.04 0.00 0.00 0.00 0.08 0.02 0.00 -0.02 0.08
2 1 -0.18 0.55 0.00 0.30 -0.73 0.01 -0.08 0.20 0.02
3 1 -0.18 -0.27 -0.47 -0.22 -0.25 -0.47 -0.22 -0.28 -0.45

4 1 -0.18 -0.27 0.47 -0.08 -0.08 0.18 0.30 0.37 -0.63
NBO Analysis

-1.000 to 1.000 charge range. The electronegative N atom is red whereas the electropositive H atoms are green, as is expected in polarities of this molecule.

Above shows the charge numbers on each atom. N(-1.125) and 3H(0.375, 0.375, 0.375). If we add all these charges together the overall charge is zero. This is a suspected result as the overall molecule is neutral in both the computation and real world experimental data.
Summary of Natural Population Analysis:
Natural Population
Natural -----------------------------------------------
Atom No Charge Core Valence Rydberg Total
-----------------------------------------------------------------------
N 1 -1.12514 1.99982 6.11103 0.01429 8.12514
H 2 0.37505 0.00000 0.62250 0.00246 0.62495
H 3 0.37505 0.00000 0.62250 0.00246 0.62495
H 4 0.37505 0.00000 0.62250 0.00246 0.62495
=======================================================================
* Total * 0.00000 1.99982 7.97852 0.02166 10.00000
 NATURAL BOND ORBITAL ANALYSIS:

Occupancies Lewis Structure Low High
Occ. ------------------- ----------------- occ occ
Cycle Thresh. Lewis Non-Lewis CR BD 3C LP (L) (NL) Dev
=============================================================================
1(1) 1.90 9.99428 0.00572 1 3 0 1 0 0 0.00
-----------------------------------------------------------------------------

Structure accepted: No low occupancy Lewis orbitals

--------------------------------------------------------
Core 1.99982 ( 99.991% of 2)
Valence Lewis 7.99447 ( 99.931% of 8)
================== ============================
Total Lewis 9.99428 ( 99.943% of 10)
-----------------------------------------------------
Valence non-Lewis 0.00000 ( 0.000% of 10)
Rydberg non-Lewis 0.00572 ( 0.057% of 10)
================== ============================
Total non-Lewis 0.00572 ( 0.057% of 10)
--------------------------------------------------------
(Occupancy) Bond orbital/ Coefficients/ Hybrids
---------------------------------------------------------------------------------
1. (1.99909) BD ( 1) N 1 - H 2
( 68.83%) 0.8297* N 1 s( 24.86%)p 3.02( 75.05%)d 0.00( 0.09%)
-0.0001 -0.4986 -0.0059 0.0000 -0.2910
0.0052 0.8155 0.0277 0.0000 0.0000
0.0281 0.0000 0.0000 0.0032 0.0082
( 31.17%) 0.5583* H 2 s( 99.91%)p 0.00( 0.09%)
-0.9996 0.0000 0.0072 -0.0289 0.0000
2. (1.99909) BD ( 1) N 1 - H 3
( 68.83%) 0.8297* N 1 s( 24.86%)p 3.02( 75.05%)d 0.00( 0.09%)
0.0001 0.4986 0.0059 0.0000 0.2910
-0.0052 0.4077 0.0138 0.7062 0.0240
0.0140 0.0243 0.0076 0.0033 0.0031
( 31.17%) 0.5583* H 3 s( 99.91%)p 0.00( 0.09%)
0.9996 0.0000 -0.0072 -0.0145 -0.0250
3. (1.99909) BD ( 1) N 1 - H 4
( 68.83%) 0.8297* N 1 s( 24.86%)p 3.02( 75.05%)d 0.00( 0.09%)
0.0001 0.4986 0.0059 0.0000 0.2909
-0.0052 0.4077 0.0138 -0.7062 -0.0240
0.0140 -0.0243 -0.0076 0.0033 0.0031
( 31.17%) 0.5583* H 4 s( 99.91%)p 0.00( 0.09%)
0.9996 0.0000 -0.0072 -0.0145 0.0250
4. (1.99982) CR ( 1) N 1 s(100.00%)
1.0000 -0.0002 0.0000 0.0000 0.0000
0.0000 0.0000 0.0000 0.0000 0.0000
0.0000 0.0000 0.0000 0.0000 0.0000
5. (1.99721) LP ( 1) N 1 s( 25.38%)p 2.94( 74.52%)d 0.00( 0.10%)
0.0001 0.5036 -0.0120 0.0000 -0.8618
0.0505 0.0000 0.0000 0.0000 0.0000
0.0000 0.0000 0.0000 -0.0269 0.0155
6. (0.00000) RY*( 1) N 1 s( 99.98%)p 0.00( 0.02%)d 0.00( 0.00%)
7. (0.00000) RY*( 2) N 1 s(100.00%)
8. (0.00000) RY*( 3) N 1 s( 0.03%)p99.99( 99.97%)d 0.01( 0.00%)
9. (0.00000) RY*( 4) N 1 s( 0.00%)p 1.00(100.00%)d 0.00( 0.00%)
10. (0.00000) RY*( 5) N 1 s( 0.00%)p 1.00(100.00%)d 0.00( 0.00%)
11. (0.00000) RY*( 6) N 1 s( 0.00%)p 1.00( 0.12%)d99.99( 99.88%)
12. (0.00000) RY*( 7) N 1 s( 0.00%)p 1.00( 0.12%)d99.99( 99.88%)
13. (0.00000) RY*( 8) N 1 s( 0.00%)p 1.00( 0.01%)d99.99( 99.99%)
14. (0.00000) RY*( 9) N 1 s( 0.01%)p 4.42( 0.06%)d99.99( 99.92%)
15. (0.00000) RY*(10) N 1 s( 0.00%)p 1.00( 0.03%)d99.99( 99.97%)
16. (0.00112) RY*( 1) H 2 s( 72.77%)p 0.37( 27.23%)
0.0038 0.8530 0.5218 -0.0017 0.0000
17. (0.00045) RY*( 2) H 2 s( 26.59%)p 2.76( 73.41%)
-0.0017 0.5157 -0.8435 -0.1501 0.0001
18. (0.00034) RY*( 3) H 2 s( 0.00%)p 1.00(100.00%)
0.0000 0.0000 0.0001 0.0000 1.0000
19. (0.00000) RY*( 4) H 2 s( 0.72%)p99.99( 99.28%)
20. (0.00112) RY*( 1) H 3 s( 72.77%)p 0.37( 27.23%)
0.0038 0.8530 0.5218 0.0009 0.0015
21. (0.00045) RY*( 2) H 3 s( 26.59%)p 2.76( 73.41%)
-0.0017 0.5157 -0.8435 0.0750 0.1300
22. (0.00034) RY*( 3) H 3 s( 0.00%)p 1.00(100.00%)
0.0000 0.0000 -0.0001 0.8660 -0.5000
23. (0.00000) RY*( 4) H 3 s( 0.72%)p99.99( 99.28%)
24. (0.00112) RY*( 1) H 4 s( 72.77%)p 0.37( 27.23%)
0.0038 0.8531 0.5218 0.0009 -0.0015
25. (0.00045) RY*( 2) H 4 s( 26.59%)p 2.76( 73.41%)
-0.0017 0.5157 -0.8435 0.0750 -0.1300
26. (0.00034) RY*( 3) H 4 s( 0.00%)p 1.00(100.00%)
0.0000 0.0000 0.0000 0.8660 0.5000
27. (0.00000) RY*( 4) H 4 s( 0.72%)p99.99( 99.28%)
28. (0.00000) BD*( 1) N 1 - H 2
( 31.17%) 0.5583* N 1 s( 24.86%)p 3.02( 75.05%)d 0.00( 0.09%)
( 68.83%) -0.8297* H 2 s( 99.91%)p 0.00( 0.09%)
29. (0.00000) BD*( 1) N 1 - H 3
( 31.17%) 0.5583* N 1 s( 24.86%)p 3.02( 75.05%)d 0.00( 0.09%)
( 68.83%) -0.8297* H 3 s( 99.91%)p 0.00( 0.09%)
30. (0.00000) BD*( 1) N 1 - H 4
( 31.17%) 0.5583* N 1 s( 24.86%)p 3.02( 75.05%)d 0.00( 0.09%)
( 68.83%) -0.8297* H 4 s( 99.91%)p 0.00( 0.09%)
 Natural Bond Orbitals (Summary):

Principal Delocalizations
NBO Occupancy Energy (geminal,vicinal,remote)
====================================================================================
Molecular unit 1 (H3N)
1. BD ( 1) N 1 - H 2 1.99909 -0.60417
2. BD ( 1) N 1 - H 3 1.99909 -0.60417
3. BD ( 1) N 1 - H 4 1.99909 -0.60417
4. CR ( 1) N 1 1.99982 -14.16767
5. LP ( 1) N 1 1.99721 -0.31757
Association Energies: Ammonia-Borane
sr |
Input:
- Method: B3LYP, DFT
- Basis Set: 6-31G(d,p)
- Calculation: OPT
- Keywords: opt=tight nosymm geom=connectivity int=ultrafine scf=conver=9
Output:
- File Type = .log
- Calculation Type = FOPT
- Calculation Method = RB3LYP
- Basis Set = 6-31G(d,p)
- E(RB3LYP) = -83.22468911 a.u.
- RMS Gradient Norm = 0.00000125 a.u.
- Dipole Moment = 5.56 Debye
- Point Group = C1
- Job cpu time: 0 days 0 hours 1 minutes 24.0 seconds.
.log file for BH3NH3 optimization
Item Value Threshold Converged?
Maximum Force 0.000002 0.000015 YES
RMS Force 0.000001 0.000010 YES
Maximum Displacement 0.000023 0.000060 YES
RMS Displacement 0.000010 0.000040 YES
Predicted change in Energy=-8.987776D-11
Optimization completed.

-- Stationary point found.
Zero value RMS gradient and convergence of all item graph criteria prove the molecule has been optimized to an energy minima.
- Method: B3LYP, DFT
- Basis Set: 6-31G(d,p)
- Calculation: FREQ
- Keywords: opt=tight nosymm geom=connectivity int=ultrafine scf=conver=9
Output:
- File Type = .log
- Calculation Type =FREQ
- Calculation Method = RB3LYP
- Basis Set = 6-31G(d,p)
- E(RB3LYP) = -83.22468911 a.u.
- RMS Gradient Norm = 0.00000124 a.u.
- Dipole Moment = 5.56 Debye
- Point Group = C1
- Job cpu time: 0 days 0 hours 0 minutes 50.0 seconds.
.log file for BH3NH3 optimization
E(RB3LYP) values are equal for FREQ and OPT calculations, therefore we can assume with confidence that the structure/configuration of the molecule is unchanged and optimized still.
Item Value Threshold Converged?
Maximum Force 0.000004 0.000450 YES
RMS Force 0.000001 0.000300 YES
Maximum Displacement 0.000022 0.001800 YES
RMS Displacement 0.000010 0.001200 YES
Predicted change in Energy=-1.090052D-10
Optimization completed.

-- Stationary point found.
Zero value RMS gradient and convergence of all item graph criteria prove the molecule has been optimized to an energy minima.
 Low frequencies --- -3.2075 -2.7298 -0.0013 -0.0008 -0.0005 3.7088

Low frequencies --- 263.3406 632.9624 638.4413
First row low frequencies shows near-zero values therefore we can assume the molecule has been optimized correctly from vibration analysis. Second row frequencies are all positive and so regular, valid and reasonable IR signals further confirming correct optimization.
1 2 3
A A A
Frequencies -- 263.3406 632.9624 638.4413
Red. masses -- 1.0078 5.0022 1.0452
Frc consts -- 0.0412 1.1808 0.2510
IR Inten -- 0.0000 14.0115 3.5501
Atom AN X Y Z X Y Z X Y Z
1 1 0.00 0.00 -0.36 -0.29 0.03 0.00 0.46 0.11 0.00
2 1 0.00 -0.32 0.18 -0.29 -0.02 -0.03 -0.23 0.14 -0.02
3 1 0.00 0.32 0.18 -0.29 -0.02 0.03 -0.22 0.14 0.02
4 1 0.00 0.00 -0.45 0.36 0.00 0.00 0.59 0.17 0.00
5 1 0.00 0.39 0.22 0.36 0.00 0.00 -0.29 0.20 0.02
6 1 0.00 -0.39 0.22 0.36 0.00 0.00 -0.30 0.20 -0.01
7 7 0.00 0.00 0.00 0.36 0.00 0.00 0.00 -0.05 0.00
8 5 0.00 0.00 0.00 -0.48 0.00 0.00 0.00 -0.03 0.00
4 5 6
A A A
Frequencies -- 638.4971 1069.1627 1069.1758
Red. masses -- 1.0452 1.3347 1.3347
Frc consts -- 0.2510 0.8989 0.8989
IR Inten -- 3.5468 40.5062 40.5107
Atom AN X Y Z X Y Z X Y Z
1 1 -0.01 0.00 0.15 0.63 0.04 0.00 -0.01 0.00 0.17
2 1 -0.39 -0.02 0.12 -0.32 0.14 -0.06 -0.54 -0.06 0.07
3 1 0.40 0.02 0.12 -0.31 0.14 0.06 0.55 0.05 0.07
4 1 -0.01 0.00 0.21 -0.45 -0.07 0.00 0.00 0.00 -0.13
5 1 0.51 0.01 0.18 0.22 -0.11 -0.03 -0.39 -0.02 -0.08
6 1 -0.50 -0.02 0.18 0.23 -0.11 0.02 0.38 0.03 -0.08
7 7 0.00 0.00 -0.05 0.00 0.11 0.00 0.00 0.00 0.11
8 5 0.00 0.00 -0.03 0.00 -0.14 0.00 0.00 0.00 -0.14

7 8 9
Association Analysis
Below are the E(RB3LYP) in a.u./Hartree units with the same methods and basis sets.
- E(NH3)= -56.55777 a.u.
- E(BH3)= -26.61532 a.u.
- E(NH3BH3)= -83.22469 a.u.
ΔE=E(NH3BH3)-[E(NH3)+E(BH3)].
Therefore ΔE=-0.05160 a.u.= -140 kJ/mol
Analysis of the same association energy by Mo et al. yields a ΔE value of -28.2 kcal/mol or -117.989 kJ/mol using a similar basis set of MP2 level with 6-31G(d).[11]. Although we should avoid comparing output data of different basis sets the two are very similar and yield similar energies. This at least shows that calculated values above are similar to those carried out by others. The CRC handbook yilds a B-N disccotiation value of the diatomic BN molecule to be +377.9 ± 8.7 kJ/mol and therefore the association energy will be -377.9kJ/mol.[12] This is very different compared to values computed. However the B-N bond in boron nitride is in a different environment compared to ammonia borane and the effect of hydrogens on the structure, the molecule is at its most stable in a staggered conform, will affect the association energy of the molecule.
Whilst the values of calculated and experimental are different by some margin the magnitude of bond association is correct. We can therefore view this result as reasonable reliable as the magnitude of calculated association energy isn't so outlandish that it differs by an order of magnitude. As shown in the CRC handbook bond energies tend to be in the magnitude of 1.0x10² kJ/mol and the calculated value of B-N bond energy reflects that.
Benzene and its Isoelectronic Analogues

Benzene, Pyridinium, Boratabenzene and Borazine are all isoelectric molecules. All molecules have electrons paired and therefore are all have singlet multiplicity due to the charged nature of each molecule. Benzene is used here as a reference to which we can analyse the introduction of B and N atoms to the ring and assess the effect this has on the structures and electronic nature of the cyclic aromatics.
Benzene

Optimization
Input:
- Method: B3LYP, DFT
- Basis Set: 6-31G(d,p)
- Calculation: OPT
- Symmetry: Confined to D6h, previous attempts yielded unconverged FREQ calculations later on with C1 symmetry
Output:
- File Type = .log
- Calculation Type = FOPT
- Calculation Method = RB3LYP
- Basis Set = 6-31G(d,p)
- E(RB3LYP) = -232.25821387 a.u.
- RMS Gradient Norm = 0.00008450 a.u.
- Dipole Moment = 0.00 Debye
- Point Group = D6H
- Job cpu time: 0 days 0 hours 0 minutes 12.0 seconds.
.log file for C6H6 optimization
         Item               Value     Threshold  Converged?
 Maximum Force            0.000199     0.000450     YES
 RMS     Force            0.000081     0.000300     YES
 Maximum Displacement     0.000847     0.001800     YES
 RMS     Displacement     0.000299     0.001200     YES
 Predicted change in Energy=-4.636871D-07
 Optimization completed.
    -- Stationary point found.
RMS gradient value of effectively zero shows the molecule has optimized to a low energy minima. The point group is incorrect however a lack of dipole (0.00 Debye) shows this has no serious effect on calculations, further proof of optimization is visible in full convergence of all item table criteria above.
Frequency Analysis
Input:
- Method: B3LYP, DFT
- Basis Set: 6-31G(d,p)
- Calculation: FREQ
- Symmetry: Confined to D6h, previous attempts yielded unconverged FREQ calculations later on with C1symmetry
Output:
- File Type = .log
- Calculation Type = FREQ
- Calculation Method = RB3LYP
- Basis Set = 6-31G(d,p)
- E(RB3LYP) = -232.25821387 a.u.
- RMS Gradient Norm = 0.00008452 a.u.
- Dipole Moment = 0.00 Debye
- Point Group = D6H
- Job cpu time: 0 days 0 hours 0 minutes 30.0 seconds.
.log file for C6H6 frequency analysis
         Item               Value     Threshold  Converged?
 Maximum Force            0.000199     0.000450     YES
 RMS     Force            0.000085     0.000300     YES
 Maximum Displacement     0.000806     0.001800     YES
 RMS     Displacement     0.000346     0.001200     YES
 Predicted change in Energy=-4.349367D-07
 Optimization completed.
    -- Stationary point found.
Convergence of all item criteria and RMS gradient of zero show optimization has been maintained. Furthermore E(RB3LYP) values for both OPT and FREQ calculations are the same showing configuration of the molecule has remained constant.
 Low frequencies ---   -4.6046   -4.6046   -0.0087   -0.0040   -0.0040    9.6590
 Low frequencies ---  413.9386  413.9386  621.1428
Low values first row "low frequencies" show the molecule was properly optimized as all values are near-zero showing the benzene molecule is/very near energy minima. Second row values are rational, positive vibrational frequencies and correct optimization can be assumed.
NBO Analysis
Input files for this ENERGY calculation were from the resulting optimized output file of C6H6 optimization previously.
Input:
- Job Type: ENERGY
- Keyword: pop=full
- NBO: Full NBO
Output:
- File Type = .log
- Calculation Type = SP
- Calculation Method = RB3LYP
- Basis Set = 6-31G(d,p)
- E(RB3LYP) = -232.25821387 a.u.
- RMS Gradient Norm = Unspecified
- Dipole Moment = 0.00 Debye
- Point Group = D6H
- Job cpu time: 0 days 0 hours 0 minutes 7.0 seconds.
No item table available
.log file for C6H6 energy calculation

Charge limits -1.000 (bright red) to +1.000 (bright green).
The overall charge value numbers cancel out to zero, this can be rationalized by the fact that benzene is a neutral molecule with no unaccounted charges, providing further conformation of correct calculations of charge. Green H atoms above highlight highlight that compared to C atoms there is less electron density at the H atoms. The consistent colour of both the H and C atoms show that electron density is the same for every H and C atom. this further supports the theorized model of benzene where electron density is delocalized and shared equally around the ring (above and below) via p-orbital overlap in a shared nodal plane leading to pi-bonding around the conjugated model. All these principles are supported via the numerical diagram below.

Numerical data from NBO analysis shows the natural charge of C in benzene is -2.39 and by extension H is +2.39 considering there are equal numbers of H and C atoms. This shows electron density is mostly localized towards the conjugated carbons. This is as expected considering the electron rich density of the carbon-carbon double bonds present and aromatic nature of benzene, delocalizing electron density about the ring, above and below the C ring plane. Therefore H atoms lose electron density via induction and the delocalization of pi electrons in benzene occurs predominately above and below the C ring rather then the outstretching H atoms around the cyclic molecule.
Analysis hybridization from the log file shows the following:
       (Occupancy)   Bond orbital/ Coefficients/ Hybrids
 ---------------------------------------------------------------------------------

     2. (1.66514) BD ( 2) C   1 - C   2
                ( 50.00%)   0.7071* C   1 s(  0.00%)p 1.00( 99.96%)d 0.00(  0.04%)
                                            0.0000  0.0000  0.0000  0.0000  0.0000
                                            0.0000  0.0000  0.0000  0.9997 -0.0133
                                            0.0000  0.0096 -0.0170  0.0000  0.0000
                ( 50.00%)   0.7071* C   2 s(  0.00%)p 1.00( 99.96%)d 0.00(  0.04%)
                                            0.0000  0.0000  0.0000  0.0000  0.0000
                                            0.0000  0.0000  0.0000  0.9997 -0.0133
                                            0.0000 -0.0195 -0.0002  0.0000  0.0000

     4. (1.98305) BD ( 1) C   1 - H   7
                ( 62.04%)   0.7876* C   1 s( 29.57%)p 2.38( 70.39%)d 0.00(  0.04%)
                                           -0.0003  0.5437  0.0126 -0.0010  0.0000
                                            0.0000  0.8388 -0.0146  0.0000  0.0000
                                            0.0000  0.0000  0.0000 -0.0166 -0.0105
                ( 37.96%)   0.6161* H   7 s( 99.95%)p 0.00(  0.05%)
                                            0.9997  0.0014  0.0000 -0.0228  0.0000
Where 62% of the bond is being contributed by electrons from carbon in the C-H bond with a hybridization of 30% s and 70% p. Where as 38% of the bonding character is provided by the H atom with 100% s character. Expected hybridization of the C atoms in benzene is sp2 (33% s, 66% p orbital character) with the remaining p-orbital partaking the pi-bonding. These percentages are roughly similar to those calculated int he log file and show hybridization of the carbons are sp2-like. 2. shows both carbon atoms with complete p-character, this corresponds to the orbital that has not been hybridized. Both orbitals contributed equally to the bond via p-orbitals, this is the pi-bonding via p-orbital overlap with a nodal plane.
Second order perturbation theory yields three interesting sets of results:
Second Order Perturbation Theory Analysis of Fock Matrix in NBO Basis

     Threshold for printing:   0.50 kcal/mol
                                                                              E(2)  E(j)-E(i) F(i,j)
         Donor NBO (i)                     Acceptor NBO (j)                 kcal/mol   a.u.    a.u.
 ===================================================================================================
   2. BD (   2) C   1 - C   2        /113. BD*(   2) C   3 - C   4           20.43    0.28    0.068
   2. BD (   2) C   1 - C   2        /118. BD*(   2) C   5 - C   6           20.43    0.28    0.068
   8. BD (   2) C   3 - C   4        /107. BD*(   2) C   1 - C   2           20.43    0.28    0.068
   8. BD (   2) C   3 - C   4        /118. BD*(   2) C   5 - C   6           20.43    0.28    0.068
  13. BD (   2) C   5 - C   6        /107. BD*(   2) C   1 - C   2           20.43    0.28    0.068
  13. BD (   2) C   5 - C   6        /113. BD*(   2) C   3 - C   4           20.43    0.28    0.068
These values are particularly higher than any other interaction in the table. Six C-C interactions are higher energy difference between acceptor and donor NBO in approximation energies of the Fock Matrix for calculating the value of energy. They are significantly larger than any other Donor-Acceptor NBO value difference. The filled carbon orbitals are acting as a donor and interacting with a bonding pair of electrons in the adjacent carbon. This interaction is a strengthen interaction of the C-C bond and the interaction of a filled orbitals and bonding pair of electrons in the adjacent carbon suggests a pi-bond is present via strong electron delocalization, hence the E(2)>20kcal/mol. The 3 sets of data show 3 double bonds in a conjugated arrangement and confirm the conjugated ring system of alkene bonds to form an aromatic species in benzene.
MO Analysis

N.B. Diagram not to scale
Above in the central MO diagram of benzene (core molecular orbitals 1-6 are not included) the LCAOs were predicted/rationalized from the computed real MOs. It should be noted that energies of the above diagram are not accurate and are ranked from lowest to highest energy values of each orbitals, but not in a quantitative fashion. Symmetry labels were provided via the accompanying log file. As before with BH3 the LCAOs reflect the MOs very well. The a2u orbital below the HOMO-LUMO dotted line show the pi-bonding interactions of p-orbitals sharing a nodal plane. The drawn LCAO shows all p-orbitals in the same phase orientation above and below the plane (H orbitals are not involved) and this is reflected by the delocalization of electron density being above and below the ring-plane.

However in the real MO the electron density of the filled p-orbitals are not localized to each carbon atom by spread about the entire ring (above and below) with a nodal plane at the ring-plane. This interaction is a bonding MO and the analogous anti-bonding MOs which have p-orbital overlap above and below the ring (above the HOMO-LUMO line), e2u and b2g, are empty; having no effect on the bond order of the molecule. So the pi-bonding in benzene is therefore very stable. This spread of electron density around round the entire aromatic model rather than located at three alkene sights suggests why benzene is, for example, more inert than cyclohexene to bromination. The localization of electron density and therefore the electrophilic/nucleophilic sights are evenly spread about the ring so addition requires different routes for substitution.
Pyridinium

Optimization
Input:
- Method: B3LYP, DFT
- Basis Set: 6-31G(d,p)
- Calculation: OPT
- Keywords: opt=tight scf=conver=9 int=ultrafine
- Charge: +1
- Multiplicity: Singlet
- Symmetry: Confined to C2V, previous attempts yielded unconverged FREQ calculations later on with C1 symmetry
Output:
- File Type = .log
- Calculation Type = FOPT
- Calculation Method = RB3LYP
- Basis Set = 6-31G(d,p)
- E(RB3LYP) = -248.66806092 a.u.
- RMS Gradient Norm = 0.00000183 a.u.
- Dipole Moment = 1.87 Debye
- Point Group = C2V
- Job cpu time: 0 days 0 hours 1 minutes 31.0 seconds.
.log file for C5N1H6+ optimization
         Item               Value     Threshold  Converged?
 Maximum Force            0.000003     0.000015     YES
 RMS     Force            0.000001     0.000010     YES
 Maximum Displacement     0.000007     0.000060     YES
 RMS     Displacement     0.000002     0.000040     YES
 Predicted change in Energy=-7.084994D-11
 Optimization completed.

    -- Stationary point found.
RMS gradient value of zero shows optimization via Gaussview has reached a energy minima for structural configuration. C2v point group symmetry shows structure was maintained from restrictions initially applied. This constraint was invoked due to yield better optimization values for frequency analysis later. Convergence of all sections of the item table suggest the molecule was correctly optimized through calculation.
Frequency Analysis
Input:
- Method: B3LYP, DFT
- Basis Set: 6-31G(d,p)
- Calculation: FREQ
- Keywords: opt=tight scf=conver=9 int=ultrafine
Output:
- File Type = .log
- Calculation Type = FREQ
- Calculation Method = RB3LYP
- Basis Set = 6-31G(d,p)
- E(RB3LYP) = -248.66806092 a.u.
- RMS Gradient Norm = 0.00000159 a.u.
- Dipole Moment = 1.87 Debye
- Point Group = C2V
- Job cpu time: 0 days 0 hours 2 minutes 18.0 seconds.
.log file for C6H6 frequency analysis
E(RB3LYP) has remained constant during this calculation when looking back to OPT output values above. RMS gradient is a near zero value and all items have converged in the item table suggesting optimization has been maintained since the prior calculation.
         Item               Value     Threshold  Converged?
 Maximum Force            0.000005     0.000450     YES
 RMS     Force            0.000002     0.000300     YES
 Maximum Displacement     0.000007     0.001800     YES
 RMS     Displacement     0.000003     0.001200     YES
 Predicted change in Energy=-6.021058D-11
 Optimization completed.
    -- Stationary point found.
 Low frequencies ---   -9.3813   -2.9587   -0.0007   -0.0007   -0.0003    0.9801
 Low frequencies ---  391.9009  404.3429  620.1997
Low frequency values of the first row show near-zero values suggesting the molecule was properly optimized. Furthermore all vibrational frequencies of the molecules are positive, which is a rational result and strengthens the validity of results calculated.
NBO Analysis
Input files for this ENERGY calculation were from the resulting optimized output file of C5N1H6+ optimization previously.
Input:
- Job Type: ENERGY
- Keyword: pop=full opt=tight scf=conver=9 int=ultrafine
- NBO: Full NBO
Output:
- File Type = .log
- Calculation Type = SP
- Calculation Method = RB3LYP
- Basis Set = 6-31G(d,p)
- E(RB3LYP) = -248.66806092 a.u.
- RMS Gradient Norm = Unspecified
- Dipole Moment = 1.8723 Debye
- Point Group = C2V
- Job cpu time: 0 days 0 hours 1 minutes 56.0 seconds.
No item table available
.log file for C5N1H6 energy calculation

Charge limits -1.000 to +1.000
The sum of all charges adds to +1 as expected considering the charge of the overall molecule to maintain isoelectronic configuration to benzene. Charge distribution is no longer equal for all C/H in the ring. Those closest to the N atom have less electron density and if carbons, are a darker red; or if hydrogens are a lighter green. Both the dark red/green compared to benzene show electron density are withdrawn from both these atoms more than in benzene. This is reflected by the more positive values of charge density found on atoms nearest nitrogen. Carbons meta to Nitrogen show the most electron density. This coincides with known reactivity of the pyridine molecule where electrophillic substitution on the molecule results in attachment at the C3 carbon due to its strong electron density and therefore is the favored site for electron deficient electrophiles. This is a result of both resonance and induction within the molecule.
      (Occupancy)   Bond orbital/ Coefficients/ Hybrids
 ---------------------------------------------------------------------------------

     2. (1.61444) BD ( 2) C   1 - C   2
                ( 52.23%)   0.7227* C   1 s(  0.00%)p 1.00( 99.94%)d 0.00(  0.06%)
                                            0.0000  0.0000  0.0000  0.0000  0.9997
                                           -0.0068  0.0000  0.0000  0.0000  0.0000
                                           -0.0159  0.0191  0.0000  0.0000  0.0000
                ( 47.77%)   0.6912* C   2 s(  0.00%)p 1.00( 99.94%)d 0.00(  0.06%)
                                            0.0000  0.0000  0.0000  0.0000  0.9995
                                           -0.0175  0.0000  0.0000  0.0000  0.0000
                                           -0.0153 -0.0196  0.0000  0.0000  0.0000

     4. (1.97822) BD ( 1) C   1 - H   6
                ( 64.83%)   0.8052* C   1 s( 31.78%)p 2.15( 68.19%)d 0.00(  0.03%)
                                           -0.0003  0.5636  0.0138 -0.0005  0.0000
                                            0.0000  0.7228 -0.0181 -0.3989  0.0072
                                            0.0000  0.0000 -0.0110 -0.0129 -0.0024
                ( 35.17%)   0.5930* H   6 s( 99.94%)p 0.00(  0.06%)
                                            0.9997  0.0016  0.0000 -0.0208  0.0116
     6. (1.98862) BD ( 1) C   2 - N  12
                ( 36.68%)   0.6057* C   2 s( 28.13%)p 2.55( 71.74%)d 0.00(  0.13%)
                                           -0.0001  0.5293 -0.0334 -0.0013  0.0000
                                            0.0000 -0.7417 -0.0277  0.4042  0.0563
                                            0.0000  0.0000 -0.0252 -0.0247 -0.0070
                ( 63.32%)   0.7957* N  12 s( 36.56%)p 1.73( 63.41%)d 0.00(  0.03%)
                                           -0.0001  0.6046 -0.0037  0.0006  0.0000
                                            0.0000  0.7069  0.0132 -0.3659  0.0187
                                            0.0000  0.0000 -0.0107 -0.0129  0.0007
    10. (1.82446) BD ( 2) C   3 - N  12
                ( 28.54%)   0.5343* C   3 s(  0.00%)p 1.00( 99.83%)d 0.00(  0.17%)
                                            0.0000  0.0000  0.0000  0.0000  0.9991
                                            0.0132  0.0000  0.0000  0.0000  0.0000
                                            0.0394  0.0102  0.0000  0.0000  0.0000
                ( 71.46%)   0.8453* N  12 s(  0.00%)p 1.00( 99.98%)d 0.00(  0.02%)
                                            0.0000  0.0000  0.0000  0.0000  0.9999
                                            0.0036  0.0000  0.0000  0.0000  0.0000
                                           -0.0077 -0.0128  0.0000  0.0000  0.0000
Analyses of hybridization of the molecule shows C-H bonds bonds have 65% of the bond from carbon with (32% s and 68% p character) with the reaming bond donation provided by 100% s character hydrogen. The hybridization of carbon has remained roughly the same at a sp2 orbital character. More interestingly is the C-N ring bond. 37% of the bond is from carbon with nitrogen providing the rest. Carbon hybridization has altered to 28% s-character and 72% p-character, Nitrogen has 37% s-character and 63% p. The carbon adjacent to Nitrogen is becoming more sp3-like in its nature. 2. shows both carbon atoms with complete p-character, this corresponds to the orbital that has not been hybridized. Both orbitals contributed equally to the bond via p-orbitals, this is the pi-bonding via p-orbital overlap with a nodal plane. 10. shows this very same pi-orbital interaction and means the nitrogen ion is involved in the conjugation and therefore aromaticity of the molecule.
 Second Order Perturbation Theory Analysis of Fock Matrix in NBO Basis

 Threshold for printing: 0.50 kcal/mol
 E(2) E(j)-E(i) F(i,j)
 Donor NBO (i) Acceptor NBO (j) kcal/mol a.u. a.u.
 ===================================================================================================
 2. BD ( 2) C 1 - C 2 /117. BD*( 2) C 4 - C 5 20.71 0.30 0.073
10. BD ( 2) C 3 - N 12 /107. BD*( 2) C 1 - C 2 20.53 0.39 0.081
12. BD ( 2) C 4 - C 5 /115. BD*( 2) C 3 - N 12 47.08 0.20 0.089
N.B. For analyses of NBO and MOs, see comparison section.
The above shows data sets show donation of electron density to the adjacent carbon as expected in a conjugated aromatic system and 3 alkene bonds are present. Therefore N is involved in the aromatic conjugated system of the molecule.
Boratabenzene

Optimization
Input:
- Method: B3LYP, DFT
- Basis Set: 6-31G(d,p)
- Calculation: OPT
- Keywords: opt=tight scf=conver=9 int=ultrafine
- Charge: -1
- Multiplicity: Singlet
- Symmetry: Confined to C2V, previous attempts yielded unconverged FREQ calculations later on with C1 symmetry
Output:
- File Type = .log
- Calculation Type = FOPT
- Calculation Method = RB3LYP
- Basis Set = 6-31G(d,p)
- E(RB3LYP) = -219.02052299 a.u.
- RMS Gradient Norm = 0.00000518 a.u.
- Dipole Moment = 2.85 Debye
- Point Group = C2V
- Job cpu time: 0 days 0 hours 7 minutes 48.0 seconds.
.log file for C5B1H6- optimization
         Item               Value     Threshold  Converged?
 Maximum Force            0.000010     0.000015     YES
 RMS     Force            0.000003     0.000010     YES
 Maximum Displacement     0.000041     0.000060     YES
 RMS     Displacement     0.000012     0.000040     YES
 Predicted change in Energy=-6.966598D-10
 Optimization completed.
    -- Stationary point found.
Convergence of all criteria in the item table and RMS gradient of zero confirm the molecule has been optimized to a low energy minima. C2V point group symmetry was restricted in order to reduce low frequencies later in frequency analysis and correctly optimize the molecule.
It is interesting to note that the above image for Boratabenzene shows there is no conjugation of doubles bonds about the two carbons adjacent to Boron. This is a drawback of Gaussview whereby the bond length is too long to be a formal double bond. However MO analyses later on proves pi electron delocalization is occurring at these atoms and that it is contributing to the pi-bonds.
Frequency Analysis
Input:
- Method: B3LYP, DFT
- Basis Set: 6-31G(d,p)
- Calculation: FREQ
- Keywords: opt=tight scf=conver=9 int=ultrafine
Output:
- File Type = .log
- Calculation Type = FREQ
- Calculation Method = RB3LYP
- Basis Set = 6-31G(d,p)
- E(RB3LYP) = -219.02052299 a.u.
- RMS Gradient Norm = 0.00000514 a.u.
- Dipole Moment = 2.8456 Debye
- Point Group = C2V
- Job cpu time: 0 days 0 hours 5 minutes 26.0 seconds.
.log file for C5B1H6 frequency analysis
         Item               Value     Threshold  Converged?
 Maximum Force            0.000023     0.000450     YES
 RMS     Force            0.000005     0.000300     YES
 Maximum Displacement     0.000050     0.001800     YES
 RMS     Displacement     0.000018     0.001200     YES
 Predicted change in Energy=-8.936158D-10
 Optimization completed.
    -- Stationary point found.
Converging of all item values, zero-valued RMS gradient and constant E(RB3LYP) value compared to OPT analysis shows the molecule has maintained its energy/optimization from the previous step. Point group symmetry has been maintained via constraints to the initial calculation.
 Low frequencies ---   -7.2680   -0.0009   -0.0008   -0.0005    3.1395    4.5361
 Low frequencies ---  371.2965  404.4163  565.0828
Low frequencies of the first row set of values are near zero and show the motions of center of mass are near zero and well optimized. Second row frequencies of the vibrational modes of the molecule seem reasonable, all are positive and show optimization has been carried out correctly.
NBO Analysis
Input files for this ENERGY calculation were from the resulting optimized output file of C5B1H6- optimization previously.
Input:
- Job Type: ENERGY
- Keyword: pop=full opt=tight scf=conver=9 int=ultrafine
- NBO: Full NBO
Output:
- File Type = .log
- Calculation Type = SP
- Calculation Method = RB3LYP
- Basis Set = 6-31G(d,p)
- E(RB3LYP) = -248.66806092 a.u.
- RMS Gradient Norm = Unspecified
- Dipole Moment = 1.8723 Debye
- Point Group = C2V
- Job cpu time: 0 days 0 hours 1 minutes 56.0 seconds.
No item table available
.log file for C5N1H6 energy calculation

Charge limits -1.000 to +1.000
       (Occupancy)   Bond orbital/ Coefficients/ Hybrids
 ---------------------------------------------------------------------------------
     1. (1.98271) BD ( 1) C   1 - C   2
                ( 49.23%)   0.7017* C   1 s( 32.50%)p 2.08( 67.45%)d 0.00(  0.05%)
                                            0.0000  0.5698 -0.0200  0.0010  0.0000
                                            0.0000 -0.0028  0.0270  0.8201  0.0353
                                            0.0000  0.0000  0.0006 -0.0020  0.0212
                ( 50.77%)   0.7125* C   2 s( 37.60%)p 1.66( 62.37%)d 0.00(  0.03%)
                                           -0.0001  0.6131 -0.0079  0.0007  0.0000
                                            0.0000  0.0575  0.0311 -0.7869 -0.0164
                                            0.0000  0.0000 -0.0020 -0.0010  0.0179

     2. (1.76874) BD ( 2) C   1 - C   2
                ( 51.88%)   0.7202* C   1 s(  0.00%)p 1.00( 99.97%)d 0.00(  0.03%)
                                            0.0000  0.0000  0.0000  0.0000  0.9998
                                           -0.0054  0.0000  0.0000  0.0000  0.0000
                                           -0.0016  0.0185  0.0000  0.0000  0.0000
                ( 48.12%)   0.6937* C   2 s(  0.00%)p 1.00( 99.97%)d 0.00(  0.03%)
                                            0.0000  0.0000  0.0000  0.0000  0.9996
                                           -0.0213  0.0000  0.0000  0.0000  0.0000
                                           -0.0031 -0.0171  0.0000  0.0000  0.0000
     4. (1.96998) BD ( 1) C   1 - B  12
                ( 66.70%)   0.8167* C   1 s( 42.00%)p 1.38( 57.99%)d 0.00(  0.01%)
                                            0.0000 -0.6479 -0.0159 -0.0012  0.0000
                                            0.0000  0.6117 -0.0293  0.4525  0.0090
                                            0.0000  0.0000 -0.0059  0.0070  0.0007
                ( 33.30%)   0.5771* B  12 s( 33.40%)p 1.99( 66.52%)d 0.00(  0.08%)
                                            0.0000 -0.5779  0.0059 -0.0048  0.0000
                                            0.0000 -0.7056 -0.0393 -0.4070  0.0096
                                            0.0000  0.0000 -0.0230  0.0156  0.0005
2. shows both carbon atoms with complete p-character, this corresponds to the orbital that has not been hybridized. Both orbitals contributed equally to the bond via p-orbitals, this is the pi-bonding via p-orbital overlap with a nodal plane. Unlike Pyridinium, the none carbon atom (B) is not involved in pi-orbital type bonding in the aromatic system. C-C bonding in the molecules occurs with 33% s character and 67% p character suggesting idealized sp2 character of the carbons as expected, with the additional p-orbital providing electron density to the pi-orbital. B-C bonding occurs by 68% contribution of carbon (42% s, 58% p character) suggesting hybridization character between sp2 and sp, highly distorted from the preferred sp2 ideal hybridization of alkenes. Boron here has sp2 hybridization (33% s, 67% p).
 Second Order Perturbation Theory Analysis of Fock Matrix in NBO Basis

     Threshold for printing:   0.50 kcal/mol
                                                                              E(2)  E(j)-E(i) F(i,j)
         Donor NBO (i)                     Acceptor NBO (j)                 kcal/mol   a.u.    a.u.
 ===================================================================================================

   2. BD (   2) C   1 - C   2        / 21. LP (   1) C   3                   37.20    0.13    0.083
   2. BD (   2) C   1 - C   2        / 22. LP*(   1) B  12                   24.26    0.25    0.077
  10. BD (   2) C   4 - C   5        / 21. LP (   1) C   3                   37.20    0.13    0.083
  10. BD (   2) C   4 - C   5        / 22. LP*(   1) B  12                   24.26    0.25    0.077
  21. LP (   1) C   3                /108. BD*(   2) C   1 - C   2           71.55    0.15    0.107
  21. LP (   1) C   3                /116. BD*(   2) C   4 - C   5           71.55    0.15    0.107
  22. LP*(   1) B  12                /108. BD*(   2) C   1 - C   2          174.24    0.02    0.086
  22. LP*(   1) B  12                /116. BD*(   2) C   4 - C   5          174.24    0.02    0.086
Donor/acceptor NBO analysis shows 1 more set of data points compared to benzene. This means an addition lewis acid/base interaction is occurring in the molecule. This data confirms that B is involved in the conjugated system of the molecule and is part of the aromatic system. The addition data pair in the above table is due to the presence of negative charge introduced in order to maintain isoelectronicly equal structure to benzene.
N.B. NBO and MO analyses can be found in the comparison section
Borazine

Optimization
Input:
- Method: B3LYP, DFT
- Basis Set: 6-31G(d,p)
- Calculation: OPT
- Keywords: opt=tight scf=conver=9 int=ultrafine
- Charge: 0
- Multiplicity: Singlet
- Symmetry: Confined to D3h, previous attempts yielded unconverged FREQ calculations later on with C1 symmetry
Output:
- File Type = .log
- Calculation Type = FOPT
- Calculation Method = RB3LYP
- Basis Set = 6-31G(d,p)
- E(RB3LYP) = -242.68459911 a.u.
- RMS Gradient Norm = 0.00000991 a.u.
- Dipole Moment = 0.00 Debye
- Point Group = D3H
- Job cpu time: 0 days 0 hours 20 minutes 2.0 seconds.
.log file for N3B3H6 optimization
         Item               Value     Threshold  Converged?
 Maximum Force            0.000010     0.000015     YES
 RMS     Force            0.000005     0.000010     YES
 Maximum Displacement     0.000056     0.000060     YES
 RMS     Displacement     0.000018     0.000040     YES
 Predicted change in Energy=-3.036424D-09
 Optimization completed.
    -- Stationary point found.
Convergence of all item table criteria and RMS gradient of near zero shows optimization of the molecule has occurred and finished at a low energy minimum. D3H was constrained as a symmetry label in order to yield accurate low frequency values and confirm better optimization. The image above of borazine shows all atoms singly bonded in the ring however the molecule is known as an aromatic, Guassview only draws bonds at a certain distance and this exceeds this distance. MO analysis should yield information to see if pi-interactions are occurring in the molecule.
Frequency Analysis
Input:
- Method: B3LYP, DFT
- Basis Set: 6-31G(d,p)
- Calculation: FREQ
- Keywords: opt=tight scf=conver=9 int=ultrafine
Output:
- File Type = .log
- Calculation Type = FREQ
- Calculation Method = RB3LYP
- Basis Set = 6-31G(d,p)
- E(RB3LYP) = -242.68459911 a.u.
- RMS Gradient Norm = 0.00000996 a.u.
- Dipole Moment = 0.00 Debye
- Point Group = D3H
- Job cpu time: 0 days 0 hours 5 minutes 13.0 seconds.
.log file for N3B3H6 optimization
         Item               Value     Threshold  Converged?
 Maximum Force            0.000032     0.000450     YES
 RMS     Force            0.000010     0.000300     YES
 Maximum Displacement     0.000058     0.001800     YES
 RMS     Displacement     0.000024     0.001200     YES
 Predicted change in Energy=-3.442733D-09
 Optimization completed.
    -- Stationary point found.
 Low frequencies ---   -4.4881   -4.4860   -3.4787   -0.0036    0.0152    0.0214
 Low frequencies ---  289.7312  289.7320  404.5218
NBO Analysis
Input:
- Job Type: ENERGY
- Keyword: pop=full opt=tight scf=conver=9 int=ultrafine
- NBO: Full NBO
Output:
- File Type = .log
- Calculation Type = SP
- Calculation Method = RB3LYP
- Basis Set = 6-31G(d,p)
- E(RB3LYP) = -242.68459911 a.u.
- RMS Gradient Norm = Unspecified
- Dipole Moment = 0.00 Debye
- Point Group = D3H
- Job cpu time: 0 days 0 hours 2 minutes 23.0 seconds.
No item table available
.log file for N3B3H6 energy calculation

Charge limits -1.000 (bright red) to +1.000 (bright green)
There are clear charge differences between the B and N atoms. N is very electronegative whilst B is the opposite. The result on hydrogen acidity is that hydrogens bonded to N are rather positive where as those attached directly to B are not. The clear divide of red/green negative/positive build up of charge localized on the atoms explains why borazine is susceptible to nucleophilic and electrophilic attack as there are a number of strong sources of electron dense/deficient sites around the ring.
                ( 23.53%)   0.4851* B   7 s( 31.25%)p 2.19( 68.50%)d 0.01(  0.25%)
                                           -0.0003  0.5588 -0.0174  0.0032  0.0224
                                           -0.0360 -0.8253 -0.0453  0.0000  0.0000
                                           -0.0057  0.0000  0.0000 -0.0449 -0.0206
                ( 76.47%)   0.8745* N  12 s( 38.55%)p 1.59( 61.44%)d 0.00(  0.01%)
                                            0.0000  0.6209  0.0043 -0.0001 -0.0609
                                           -0.0137  0.7813 -0.0080  0.0000  0.0000
                                           -0.0009  0.0000  0.0000 -0.0071 -0.0085
     9. (1.82089) BD ( 2) B   7 - N  12
                ( 11.79%)   0.3433* B   7 s(  0.00%)p 1.00( 99.62%)d 0.00(  0.38%)
                                            0.0000  0.0000  0.0000  0.0000  0.0000
                                            0.0000  0.0000  0.0000  0.9976 -0.0315
                                            0.0000  0.0096 -0.0607  0.0000  0.0000
                ( 88.21%)   0.9392* N  12 s(  0.00%)p 1.00(100.00%)d 0.00(  0.00%)
                                            0.0000  0.0000  0.0000  0.0000  0.0000
                                            0.0000  0.0000  0.0000  1.0000 -0.0003
                                            0.0000  0.0037  0.0027  0.0000  0.0000
9. shows orbital interactions of B and N with 100% p-orbital character attributed to the pi-bonding in the molecule. The molecule is therefore aromatic however due to electron densities/electronegativities N provides 88% of this bond. The previous data set shows single-bonded B and N where N provides 76% of the bond with 39% s character and 61% p-character. Showing sp2 like hybridization. Boron has a similar hybridization of sp2 like orbital arrangements. This means borazine is an aromatic as expected and follows Huckel's rules as expected with 6 π-electrons (4n+2)=6, n=1.[13]
 Second Order Perturbation Theory Analysis of Fock Matrix in NBO Basis

     Threshold for printing:   0.50 kcal/mol
                                                                              E(2)  E(j)-E(i) F(i,j)
         Donor NBO (i)                     Acceptor NBO (j)                 kcal/mol   a.u.    a.u.
 ===================================================================================================
9. BD (   2) B   7 - N  12        /119. BD*(   2) B   9 - N  11           37.57    0.33    0.100
11. BD (   2) B   8 - N  10        /114. BD*(   2) B   7 - N  12           37.57    0.33    0.100
14. BD (   2) B   9 - N  11        /116. BD*(   2) B   8 - N  10           37.57    0.33    0.100
Comparative Analysis
MO and NBO Results Table
| Molecule | NBO (value) | NBO (colour) | MO (21)/LCAO | MO (20)/LCAO | MO (17)/LCAO |
|---|---|---|---|---|---|
| Benzene |
|
|
 
|
 
|
 
|
| Boratabenzene | 
|

|
 
|
 
|
 
|
| Pyridinium | 
|

|
 
|
 
|
 
|
| Borazine | 
|

|
 
|
 
|
 
|
N.B. All files are click-able and expandable. Energy level values are in Hartree/atomic units
MO Comparison
Below is the Musulin-Frost diagram for benzene showing the selected orbitals 21, 20 and 17.

MO 17: The delocalized π-bond
MO 17 refers to the pi-bonding orbital of all molecules. Energies of the calculated MOs are shown below their predicted LCAO analogues. Upon inspection of MO 17 (pi-bonding) for all molecules we can see clear pi-bond regions above and below the plane of the ring. This is a result (as shown by the LCAO) of all ring atom p-orbitals being in the same phase orientation.

Benzene clearly has an even electron distribution. When looking at the pi-bonding orbital of Boratabenzene we see polarization of the molecular orbital away from the B atom (pink). Although pi-bonding is still occurring throughout the ring, the intensity of electron distribution skews away the boron atom due to its inability to draw electron density towards it; this is due to electron deficiency being satisfied by the negative charge. Pyridinium is the complete opposite. The N atom is positively charged with nitrogen already being a strong electronegative atom. Therefore the molecular orbital distribution is skewed towards the nitrogen atom (blue). Borazine has a molecular orbital much like benzene with even distribution of electron density around the ring. However the surface is more "bumpy" with electron density around the B atom being less than that around the nitrogen. The energy level stability of this same MO in different molecules goes by:
Borazine > Benzene > Pyridinium > Boratabenzene.
Boratabenzene has the most unstable MO 17 energy level as boron is rather electropositive compared to both carbon and nitrogen. In a molecular orbital diagram this means the energy level of atomic orbitals of boron are higher/more unstable in energy. When this atomic orbital is mixed with other orbitals to form MO 17 the resulting mixed MO orbital will be higher in energy due to the higher energy of B atomic orbitals compared to both carbon and nitrogen.
| Molecule | MO (21)/LCAO | MO (20)/LCAO |
|---|---|---|
| Benzene |
|
|
| Boratabenzene |
|
|
| Pyridinium |
|
|
| Borazine |
|
|
MO 21 and 20: HOMO
MO 21 and 20 are degenerate HOMO orbitals in benzene; comparative analysis was therefore taken on these HOMO orbitals with all isoelectronic molecules. The two computed MOs for benzene are shown above. Inspection of the LCAOs for all molecules shows the same orbital configurations in all molecules for these two MOs.

Glancing at the result table above the key outlier is Pyridinium which has the order of energy levels opposite to the other molecules. However benzene and borazine both have degenerate energy levels for MOs 21 and 20. This is because they both have the same D3h point group and therefore mixing of orbitals. The degeneracy is lost for both for both pyridinium and boratabenzene because the orbital contributions are now uneven in the molecule. Therefore the energy levels are no longer equal due to unequal contribution of electrons around the ring due to the introduction of N/B atoms.

The p-orbital in red represents the atom changing when assessing benzene (C), Boratabenzene (B) and Pyridinium (N). There are two sets of bonding interaction in this MO. Three p-orbitals are in the same phase and result in overlap over three atoms shown in the real MOs. There are three other p-orbitals all in-phase and interacting but opposite phase to the other 3 orbitals. Therefore the two sets of three atomic orbitals are antibonding to each other. Hence the two nodes in the real MOs.
Considering the differences between the molecules, the order of electronegativities is as follows: N > C > B. Using carbon/benzene as a reference we consider the below MO/LCAO. It is interesting to note for MO 21 that Boratabenzene and Borazine show the same orbital configuration as the MO 21 for benzene; whereas for Pyridinium the MO energy levels are swapped. This is because the N atom in Pyridinium is more electronegative than both B and C. This means in an MO diagram the atomic orbital energy level involved with N is lower in energy, therefore when mixing occurs to produce the MOs above, the MOs which have interaction with N will be lower in energy compared to carbon and borane. Therefore MOs 21 of benzene, Boratabenzene and Borazine have similar orbital interactions to the MO 20 of Pyridinium. This is because MO 20 of Pyridinium has the electronegative and more stable N atom involved in orbital interaction whereas MO 20 does not. Therefore the order of MO 20 and 21 is swapped only for Pyridinium.
MOs 21 and 20 are the degenerate HOMOs of benzene. Degeneracy is lost in both Boratabenzene and Pyridinium molecules with one MO now more unstable that the other by a small amount of energy. This is because the point group of the molecule has changed and therefore individual point groups of orbitals have changed resulting in different mixing of orbitals. Borazine however has MOs 21 and 20 as degenerate energy levels at a more stable/negative energy. Both benzene and Borazine are D3h. For benzene's MO 21 there are two groups of bonding pi-interaction, divided by a nodal plane, opposite phase to one another. The relative amounts of these two groups are 50:50 with two nodal planes, one in the ring and one perpendicular.

Assessing Pyridinium MO 20 and Boratabenzene MO 21 we see a similar MO. Here p-orbitals are interaction and there a two groups of bonding interactions, antibonding to one another. The amount of contribution to one of these groups of orbitals depends on the electronegativity of the X atom (red) (B=boratabenzene, N=pyridinium). If the X atom is more electronegative (like N) the contribution of this bonding interaction is due mostly to the N atom. Therefore the electron density is found almost entirely on the N atom and not the adjacent carbon atoms. Whereas when X=B in boratabenzene the contribution also include the adjacent blue atoms and the electron density is spread about the X atom (red) and adjacent (blue) carbon atoms.
Inspection of MO 20 for Benzene, Boratabenzene, Borazine and MO 21 of Pyridinium yields the following LCAO.

Where X represents C (benzene), B (Boratabenzene) or N (Pyridinium). However the p-orbital interactions do not involve p-orbitals of the X atom. The order of stability is:
Pyridinium > Borazine > Benzene > Boratabenzene
The sizes and diffusion of the electron densities for all of the molecules is very similar. The ordering of stability follows the electronegativity argument provided earlier. Pyridinium and Borazine are the most stable due to the lower energy N atom being present to reduce the energy of mixed MOs. Whereas Boratabenzene has the most unstable MO due to the electropositive B atom being present. Benzene is understandably in the middle considering the carbon atom has an electronegativity value between both B and N.
Degeneracy
Degeneracy is present in both benzene and Borazine, but not for Pyridinium and Boratabenzene. Degeneracy of energy levels is a result of equal amounts of orbital/electron contribution involved in the degenerate MOs. Because the ring-frame for benzene is made up of carbons with equal charge densities and bond lengths, all carbons are the same and therefore all electron contribution is equal in every carbon. This means for the two degenerate HOMO MOs in benzene (20 and 21) shown below.

However one MO has 6 atomic orbitals while the other has 4, yet they have the same energy. The red lines show the nodal plane that bisects the ring. For the Mo with 4 atomic orbitals, the red line/nodal plane, intersects at the two atoms not involved in the MO. For the other MO made from a linear combination of 6 atomic orbitals the red line/nodal plane passes between two carbon-carbon bonds where there is a phase change of p-orbitals. The reason for equal energy is due to the anti-bonding component in the 6 LCAO energy level causing unfavourable interactions. This unfavourable interaction cancelled out the additional interaction of in-phase interactions are a result of a 3-atom linear combination of in phase p-orbital overlap, as the atomic orbitals at the boundary of the nodal plane contribute 50% to in-phase bonding and 50% to antibonding interaction of the adjacent out-of-phase orbital. This leaves two separate sets of 2-atom linear combination of orbitals. This is equal in the amount of orbital interaction to the other 4-membered linear combination of orbitals and thus they MOs are degenerate in their energy levels.
The same cancelling out of unfavourable adjacent antibonding interactions combined with addition favoured bonding interactions of the 6 LCAO equates to the same energy as the 4 LCAO molecular orbital. However this degeneracy is lost in Pyridinium and Boratabenzene. This is a result of uneven distribution of electron density as a result of the electron withdrawing/donating effects of the N+/B- atom. This creates an uneven distribution of electrons so the MO with 6 LCAO and 4 LCAO are different in terms of electron distribution and therefore differing energies. Differing energies yields loss of degeneracy.
Charge Distribution Comparison

| ||||
|---|---|---|---|---|
| Atom | 
|

|

|

|
|
|
|
|
| |
| 1 | -0.239 | +0.202 | -0.467 | -1.102 |
| 2 | -0.239 | -0.588 | +0.071 | +0.747 |
| 3 | -0.239 | -0.250 | -0.241 | -1.102 |
| 4 | -0.239 | -0.340 | -0.122 | +0.747 |
| 5 | -0.239 | -0.250 | -0.241 | -1.102 |
| 6 | -0.239 | -0.588 | +0.071 | +0.747 |
| a | +0.239 | -0.097 | +0.483 | +0.432 |
| b | +0.239 | +0.184 | +0.285 | -0.077 |
| c | +0.239 | +0.179 | +0.297 | +0.432 |
| d | +0.239 | +0.186 | +0.292 | -0.077 |
| e | +0.239 | +0.179 | +0.297 | +0.432 |
| f | +0.239 | +0.184 | +0.285 | -0.077 |
N.B. Charge limits for all coloured diagrams above are -1.000 to +1.000
Benzene
All carbons in benzene have the same charge distribution value of -0.239. This shows there is a build up of negative charge at the carbon atoms spread equally about the ring. This value and its consistency at all carbons suggest the pi-electrons are delocalized evenly through the carbon-ring to yield the same negative values. The hydrogen atoms have equal and opposite values to account for this excess (compared to a charge distribution of zero) charge found at benzene. The electron withdrawing alkene functionality are causing electron density at H to be drawn away and due to the even charge density on the carbon ring, all hydrogen atoms have equal charge distributions.
Boratabenzene
In boratabenzene we can see atom 1 (B) is a positive value. There is a localization of positive charge at the atom. As boron is not very electronegative the electron density around the atom is withdrawn and yields a positive boron charge density. Atoms adjacent to the atom (a, 2 and 6) therefore have significant amounts of negative charge distribution as they are the atoms benefiting from the borons weak ability to drawn electrons to itself. A further reason for borons inability to draw electrons to itself is due to its electron deficiency being compensated by the negative charge in order to maintain isoelectronic configuration to benzene. This compensation for electron deficiency means all borons p-orbitals have electrons. The most electronegative carbon in the ring is at 6 and 2 meaning electrophilic attack would occur at these atoms whilst nucleophlic attack occurs at carbon 5 and 3 positions due to there more positive charge distribution.
Pyridinium
Pyridinium is quite the opposite. The N atom is electron deficient and withdraws/negative charge density towards it, even more so than when it is neutral. Therefore atoms a, 2 and 6 and very positive in relation to their benzene analogues. Carbons meta to the N atom (3 and 5) have the most electron density and this reflects the pyridine molecule in reactivity to electrophiles.[14] This is a result of both inductive and resonance effects making the 3 and 5 substitutions more stable. Hydrogen a is understandably acidic, with a large positive charge distribution, considering the molecule is protonated pyridine.
Borazine
Borazine displays alternating values for charge distribution of equal values. All N atoms have the same charge density and all hydrogen atoms bonded to nitrogen have the same charge distribution. The same is seen for boron. This means, despite the equal bond lengths as shown previously, charge distribution is unevenly divided through the ring. N is significantly negative in its charge distribution, more so then in pyridinium, and B is more positive than in boratabenzene. This makes the molecule very charged and therefore explains why it is so susceptible to both nucleophiles and electrophiles due to the polarized nature of electrons in the molecule.
Bond Length Comparison

Above is the bond length analyses (in Å) of ring bonds in the molecules computed. It is important to note that all B-N bonds are shown as equal in borazine and all C-C bonds are equal in benzene. This data coincides with the MO 17 of Borazine where electron density is very consistent around the ring with no polarization of electron density to any specific end. Calculated B-N bond lengths of 1.43Å in borazine are very similar to that of literature values; which through crystallography are recorded at 1.44Å.[15] Calculated values for benzene C-C bond of 1.40Å is near exact to literature values (1.39Å).[16] Electron density was however shown to skew in both Pyridinium and Boratabenzene and as a result the bond lengths/strengths differ because of uneven electron density through the ring. There are clear inductive effects from substituting a single B/N atom into the molecule as electron density is drawn towards them.
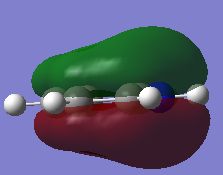
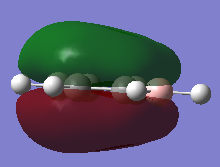
Affects on MO diagrams
The benzene MO was previously rationalized. Replacing a carbon atom with a boron or nitrogen ion will obviously change the MO diagram as a whole. For both pyridinium and boratabenzene the D3h symmetry of molecule has been broken to C2v.This change of overall molecule symmetry will result in the change of individual symmetry orbitals of the atomic orbitals. Mixing of orbitals are only allowed if symmetry is the same between two orbitals. Therefore change the atomic orbital symmetries will alter which orbitals can mix.
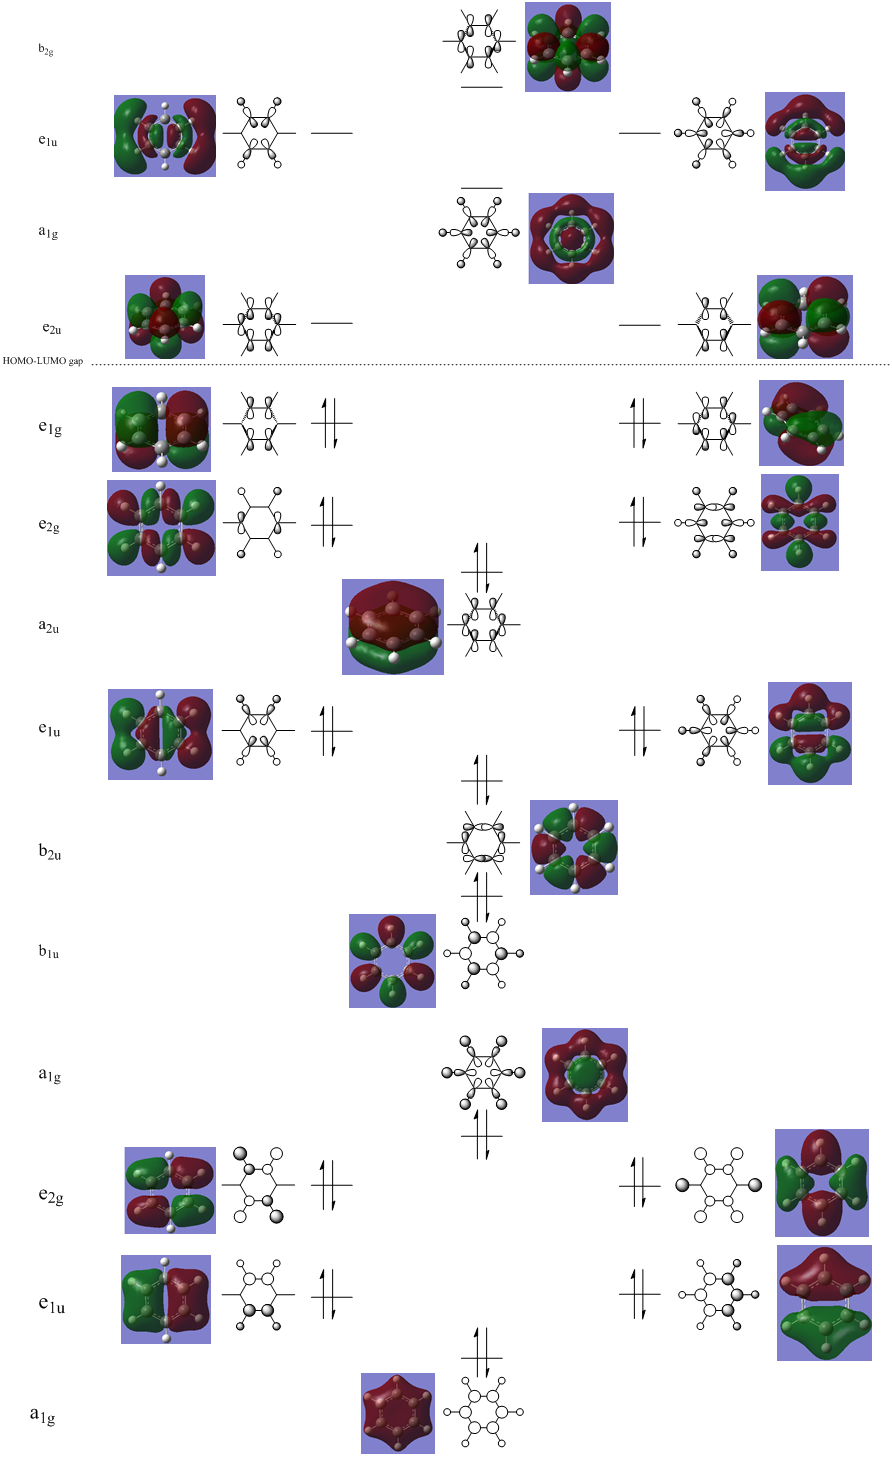
Furthermore the stability/electronegativity of the B/N atoms will affect the energy of MOs containing N and B. N in pyridinium is electronegative and therefore is lower in energy in the molecular orbital diagram. This change of energy means mixing is possible with different orbitals low in energy and may well be unfeasible to mix with some orbitals as in benzene due to a mismatch in orbital energies. The complete opposite is true for B in boratabenzene.
Borazine on the other hand has retention of the D3h symmetry in benzene. However B and N atoms occupy the ring and will affect the individual LCAO point group symmetries. Therefore the orbitals which can mix will be different. Previous arguments about electronegtivities explained previously apply here and will result in some orbitals previously being able to mix in benzene being to far apart in energy to mix. Whilst some previously non-mixing orbitals of same symmetry now having good energy matching and allow mixing in the MO diagram .
As previously explained during the MO analyses the electron withdrawing/donating affects of each atom make a significant energy difference for identical LCAOs. The inductive (or lack of) effects of the N and B atoms alter the amount of charge/electron distribution in the molecule. The density of electrons in orbitals is therefore effected and as a result the energy for MOs of identical LCAO will vary from molecule to molecule. Thus the degeneracy of MOs in diagrams will change as previously discussed. Therefore ordering of MOs may alter what orbitals are the HOMO energy levels.
Discrepancies of the Borazine π-cloud
An interesting result of note is the charge distribution of borazine compared to benzene. Bright green represents large positive charge distribution, whereas bright red represents high negative charge localization. Darker green/red represents near neutral levels of charge density. Clearly borazine has uneven distribution of charge compared to benzene. As previously rationalized this is due to the large electronegativity difference between N and B. As a result electrophilic/nucleophilic additions are very easy for borazine due to polarization of bonds. Benzene on the other hand requires more specific reagents and formation of strong electrophiles in order to react, as below:
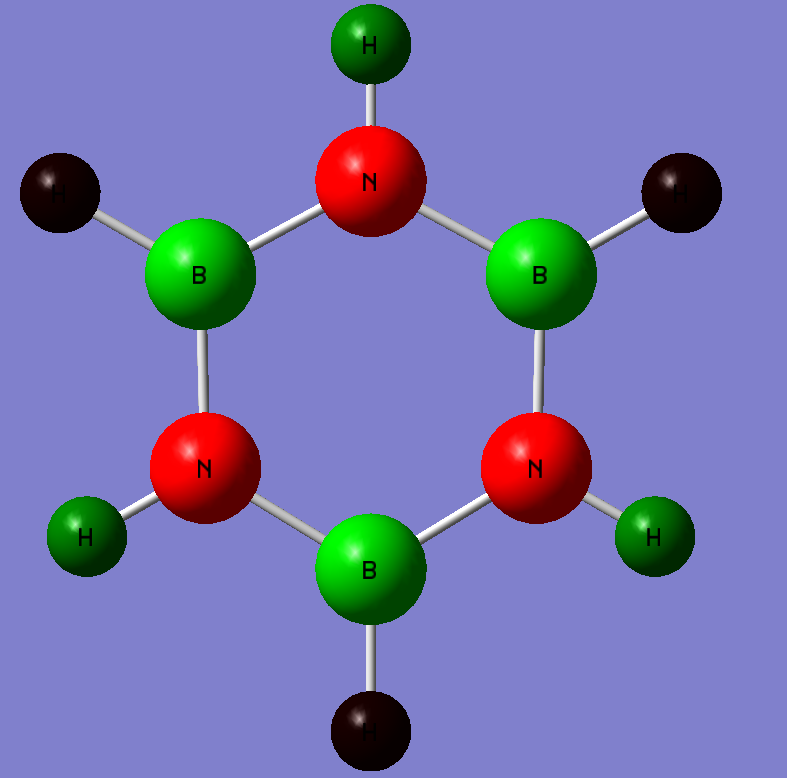
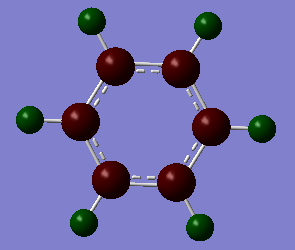

However as experienced with pyridinium and boratabenzene, the pi-bonding MO (17) tended to skew towards the electron withdrawing N, or away from the electropositive B. Therefore we expect the pi-bonding MO (17) for borazine to be very polarized and localization of electron density to be primarily, or at least majorly, located on N atoms. Yet MO 17 for both benzene and borazine seem very similar. However literature analysis has explained the π-cloud in borazine as "lumpy" due to the electronegativity difference.[17] Whilst this was noted previously in MO analysis, the calculation showed only a slight distortion of the electron cloud because of electron localization on N. Considering such a significant difference to literature understanding of the π-electron cloud in borazine a better basis-set to more accurately model borazine's electron configuration may be required.
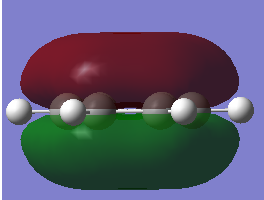
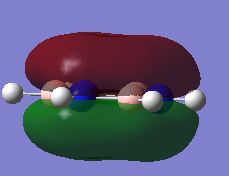
References
- ↑ Kawaguchi, K., Fourier transform infrared spectroscopy of the BH3 ν3 band, The Journal of Chemical Physics, 1992, 96, 3411-3415.
- ↑ Jeffrey Gorman, Gaussian Job Archive for Br3Ga1, 2013 DOI:10042/26080
- ↑ David R. Lide, ed., CRC Handbook of Chemistry and Physics, Internet Version 2005, <http://www.hbcpnetbase.com>, CRC Press, 2005, 1399
- ↑ Aubuchon R., McPhail A., Wells R., Giambra J., and Bowser J., Preparation, characterization and facile thermolysis of [X2GaP(SiMe3)2]2 (X = Br, I) and (Cl3Ga2P)n: new precursors to nanocrystalline gallium phosphide, Chemistry of Materials, 1994, 1, 82-86
- ↑ Jeffrey Gorman, Gaussian Job Archive for Br3B1, 2013 DOI:10042/26088
- ↑ Santiso-Quiñones G., Krossing I.*, Reference Values for the B-X Bond Lengths of BI3 and BBr3, Journal of Inorganic and General Chemical, 2008, 4, 704-707
- ↑ David R. Lide, ed., CRC Handbook of Chemistry and Physics, Internet Version 2005, <http://www.hbcpnetbase.com>, CRC Press, 2005, 1397
- ↑ Ermer O., Mason S., Anet F., Miura S., Ultrashort nonbonded hydrogen...hydrogen distance in a half-cage pentacyclododecane, Journal of the American Chemical Society, 1985, 8, 2330-2334
- ↑ R Schreiner et al, Overcoming lability of extremely long alkane carbon–carbon bonds through dispersion forces, Nature, 2011, 477, 308
- ↑ Jeffrey Gorman, Gaussian Job Archive for Br3Ga1, 2013 DOI:10042/26138
- ↑ Mo Y., Song, L., Wu W., and Zhang Q., Charge Transfer in the Electron Donor-Acceptor Complex BH3NH3, Journal of the American Chemical Society, 2004, 12, 3978
- ↑ Luo Y . R ., Comprehensive Handbook of Chemical Bond Energies, CRC Press, 2007, 66
- ↑ Kiran B., Phukan A. K. and Jemmis* D. E., Is Borazine Aromatic? Unusual Parallel Behavior between Hydrocarbons and Corresponding B−N Analogues, Inorganic Chemistry, 2001, 14, 3615-3618
- ↑ Comins, D. L., O’Connor, S., Al-awar, R. S., Pyridines and their Benzo Derivatives: Reactivity at the Ring, Comprehensive Heterocyclic Chemistry III, 2008, 7, 2
- ↑ Volkov V. V. , Myakishev K. G. ,Ilyunchik E. A., Borazine and its Derivatives: Synthesis, Mechanochemical Reactions of Obtaining and Outlooks for Technological Applications, Chemistry for Sustainable Development, 2009, 17, 225-234
- ↑ Brown et al., Chemistry: The Central Science. Upper Saddle River, Pearson Education, 2006, 1067
- ↑ Saxena P. B., Chemistry of Interhalogen Compounds, Discovery Publishing House, 2007, 75