Rep:Mod:am2912i
Inorganic Computational Lab
Introduction
The purpose of this module was to demonstrate how computational chemistry can be applied to inorganic systems and be used to investigate more complex modes of bonding, such as multi-centre bonding in dimer structures. This project utilises the Gaussian program in order to optimise structures, conduct frequency analysis, predict charge distribution and visualise predicted molecular orbitals of several different molecules of varying complexity.
A molecule is "optimised" by studying its potential energy surface (PES) in an attempt to find a local minimum which corresponds to an "optimised" conformation. Initially points of zero gradient are located, these are then subsequently analsyed using a second derivative to determine the overall curvature of said point on the PES. This zero gradient region can then be identified as an unwanted point of inflection, maxima or the desired energy minimum. A positive value of the second derivative corresponds to the desired energy minimum which in turn corresponds to an optimised low energy conformation of a specific structure.
Simple Calculations using Gaussian
BH3:B3LYP/3-21G level
Optimisation log file here
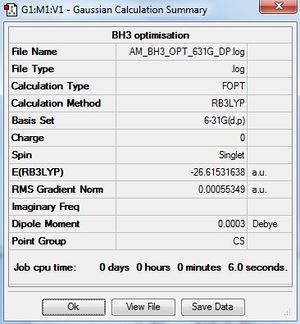
BH3:B3LYP/6-31G(d,p)level
Optimisation log file here
| Summary Data | Convergence | Jmol | |||
|---|---|---|---|---|---|
|
Item Value Threshold Converged? Maximum Force 0.000012 0.000450 YES RMS Force 0.000008 0.000300 YES Maximum Displacement 0.000064 0.001800 YES RMS Displacement 0.000039 0.001200 YES |
|
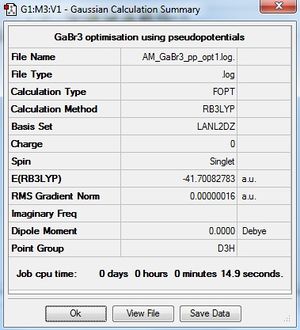
GaBr3:B3LYP/LANL2DZ
Optimisation log file DOI:10042/31118
| Summary Data | Convergence | Jmol | |||
|---|---|---|---|---|---|
|
Item Value Threshold Converged? Maximum Force 0.000000 0.000450 YES RMS Force 0.000000 0.000300 YES Maximum Displacement 0.000003 0.001800 YES RMS Displacement 0.000002 0.001200 YES |
|
BBr3:B3LYP/6-31G(d,p)LANL2DZ
Optimisation log file DOI:10042/31119
| Summary Data | Convergence | Jmol | |||
|---|---|---|---|---|---|

|
Item Value Threshold Converged? Maximum Force 0.000014 0.000450 YES RMS Force 0.000006 0.000300 YES Maximum Displacement 0.000057 0.001800 YES RMS Displacement 0.000038 0.001200 YES |
|
Comparing the Structures
| Molecule | Computed Bond Length (Å) | Literature Bond Length (Å) | Percentage Difference (%) |
| BH3 | 1.19 | 1.188 | 0.17 |
| BBr3 | 1.93 | 1.903 | 1.42 |
| GaBr3 | 2.35 | 2.243 | 4.77 |
Initially, the BH3 and BBr3 bond lengths were compared. Upon changing the ligand from H to Br an increase of ~0.74Å is observed. This is a considerable increase by approximately 62% of the B-H bond length. The main reason for this is due to the size of bromine's atomic radius which is much larger than that of hydrogen, due to the involvement of both p and d orbitals. It should be noted that due to the increased electronegativity of the bromine the B-Br bond is more polar and therefore stronger than the B-H bond however this effect is not enough to overcome the increase in atomic size and thus a lengthening of the B-Br bond in comparison to B-H.
The comparison between GaBr3 and BBr3 allows for an investigation into changing the central atom, whilst maintaining the same set of ligands. As before, Ga has a larger atomic radius than B resulting in a longer bond length. However, this increase is not as substantial as when the ligand is not changed, an increase of only 0.42Å (22%) is observed upon changing the central atom. This may be attributed to the fact that both Ga and Br are in the same period and thus have a good orbital overlap (due to similar sized atomic radii) this would lead to the formation of a strengthened and shortened Ga-Br bond. However, as with the previous example this is not enough to outweigh the difference in atomic radius between gallium and boron and thus a longer bond length is observed upon an increase in the atomic radius of the central atom.
It can be seen that even using basic basis sets bond lengths can be calculated which are comparable to literature values, with relatively accurate results produced by calculations with a run time of less than 30 seconds. Larger errors are observed in larger molecules which is not surprising as these molecules contain more electrons and thus add to the complexity of the calculations.
Due to the objective nature of Gaussview if a calculation results in a bond length with a magnitude above a certain distance the bond disappears. This distance is based on numbers and this is how Gaussview defines what is and isn't a bond. However a more subjective view is that if the electronic interaction between two atoms is sufficient enough to consider the atoms to be part of a single system, in which each atom is dependent on the other, regardless of the distance between them this can be considered a bond. However above a certain distance this interaction would be very weak and therefore bond distance is a useful tool for measuring the strength of a chemical bond.
Bond strength can be further explored and categorised into strong, medium and weak bonds. Covalent bonds (adjacent atoms sharing a pair of electrons) are examples of very strong bonds, a typical carbon-oxygen (C=O) double bond has an energy of around 732kJ mol-1. A medium bond strength is observed for O-H bond in Phenol with an energy of approximately 372kJ mol-1. Finally hydrogen bonds are an example of a weak bond, this is a non-covalent molecular interaction with energies between 4-13kJ mol-1.
Another way of interpreting bond strength is the bond length, although a more subjective view in general a longer bond will be weaker than a shorter bond, this is mainly due to the substituents at each end repelling causing both a lengthening and a weakening of the bond between them. A further method for studying the strength of a bond is IR spectroscopy, this utilities the Harmonic Oscillator model which treats a bond as a spring between two masses. The vibrational frequency of a bond is directly proportional to the force constant (k), which is a second derivative and is used to determine the curvature of a potential energy surface (PES). During all of the calculations above the PES is being explored in order to find a local minimum which corresponds to an optimised geometry. The curvature of the PES can also be used to determine the strength of a bond, a very steep curvature yields a large k value which in turn corresponds to a large vibrational frequency, the larger the vibrational frequency the stronger the bond, this can be thought of as having a very tight spring between your two masses. In contrast a low curvature slope corresponds to a smaller force constant, this can be thought of as a stretchy spring between the two masses, which unsurprisingly would be weaker.
In addition to the above a bond can be single, double, triple or even cluster in nature, these different types of bond all have varying bond strengths, depending on the atoms at either end. The question of "how strong is a bond" does not have a simple answer and bond strength can be viewed from multiple perspectives, including analytically using bond enthalpies or mathematically upon studying the PES of a molecule. This project aims to present the potential of Gaussian as a computational method for understanding this complex question.
More Complex Analysis
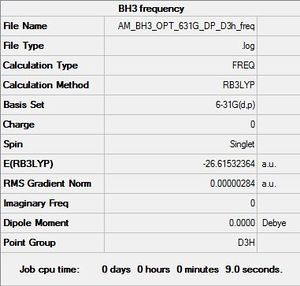
BH3 Frequency Analysis
File:AM BH3 OPT 631G DP D3H FREQ.LOG
         Item               Value     Threshold  Converged?
 Maximum Force            0.000006     0.000450     YES
 RMS     Force            0.000003     0.000300     YES
 Maximum Displacement     0.000022     0.001800     YES
 RMS     Displacement     0.000011     0.001200     YES
| Summary Data | Low Modes |
|---|---|
|
Low frequencies --- -12.3889 -12.3823 -7.7287 -0.0007 0.0237 0.4048 Low frequencies --- 1162.9692 1213.1354 1213.1356 |
| Vibration Mode Number | Vibration Image | Vibration Frequency (cm-1) | Intensity | Description | Symmetry (D3h point group) |
|---|---|---|---|---|---|
| 1 |  |
1163 | 93 | BH3 Umbrella Deformation: All 3 hydrogen's perform a wagging motion above and below the plane of the boron central atom. The B-H bond lengths remain equivalent during this vibration. | A2 |
| 2 |  |
1213 | 14 | BH2 Rocking: Two hydrogen's perform a rocking motion whilst the third hydrogen bends with a larger magnitude. | E' |
| 3 |  |
1213 | 14 | BH3 Scissoring Motion: Two hydrogen's perform a scissoring action whilst the third hydrogen and the boron are effectively stationary, disregarding the small displacement due to recoil. | E' |
| 4 | 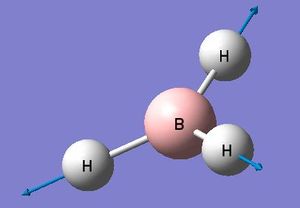 |
2583 | 0 | Symmetric H3 Motion: All 3 hydrogen's are stretching symmetrically away from the stationary boron,there is no change in the overall dipole moment and thus this mode is IR inactive. | A1' |
| 5 |  |
2716 | 126 | Asymmetric BH Stretch: Two hydrogen's undergo asymmetric stretching whilst the third hydrogen and the boron atom remain stationary. | E' |
| 6 |  |
2716 | 126 | Asymmetric BH Stretch: Two hydrogen's stretch symmetrically whilst the third hydrogen stretches asymmetrically with a greater magnitude. | E' |
Computed IR Spectrum of BH3
The computed IR spectrum shows three peaks at 2716, 1213 and 1163 cm-1. Vibration number four is a symmetric stretch and thus causes no change in overall dipole moment, therefore is IR inactive and is not observed. There are only three peaks due to the overlap of both vibration 2 with vibration 3 and the overlap of vibration 5 and 6.
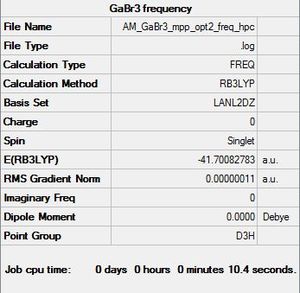
GaBr3 Frequency Analysis
The same set of analysis was carried out on a molecule of GaBr3
File:AM GaBr3 mpp opt2 freq hpc.log
         Item               Value     Threshold  Converged?
 Maximum Force            0.000000     0.000450     YES
 RMS     Force            0.000000     0.000300     YES
 Maximum Displacement     0.000002     0.001800     YES
 RMS     Displacement     0.000001     0.001200     YES
| Summary Data | Low Modes |
|---|---|
|
Low frequencies --- -0.5252 -0.5247 -0.0024 -0.0010 0.0235 1.2010 Low frequencies --- 76.3744 76.3753 99.6982 |
| Vibration Mode Number | Vibration Image | Vibration Frequency (cm-1) | Intensity | Description | Symmetry (D3h point group) |
|---|---|---|---|---|---|
| 1 |  |
76 | 3 | Two bromine's rock whilst the third bromine bends in the same plane with a larger magnitude, slight Gallium recoil is also observed. | E' |
| 2 | 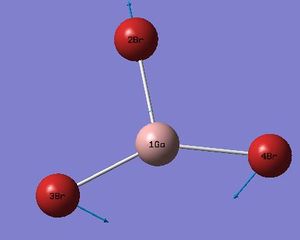 |
76 | 3 | Bromine's 3&4 undergo a scissoring motion whilst the gallium and the third bromine (2) oscillate together due to recoil. | E' |
| 3 | 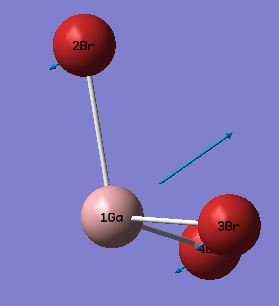 |
100 | 9 | GaBr3 Umbrella Deformation: All three bromine's undergo a wagging motion whilst the gallium atom oscillates with a large magnitude in the opposite direction. | A2 |
| 4 |  |
197 | 0 | Symmetric GaBr3 Vibration: All 3 bromine's are stretching symmetrically away from the stationary gallium,there is no change in the overall dipole moment and thus this mode is IR inactive. | A1' |
| 5 | 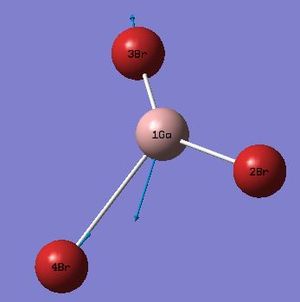 |
316 | 57 | Asymmetric GaBr Stretch: Bromine (2) is stationary whilst bromine's 3&4 stretch asymmetrically causing recoil in the gallium atom. | E' |
| 6 | 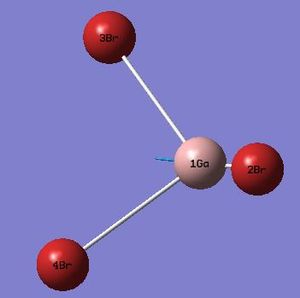 |
316 | 57 | Asymmetric GaBr Stretch: Bromine's 3&4 stretch symmetrically whilst bromine 2 stretches anti-symmetrically. | E' |
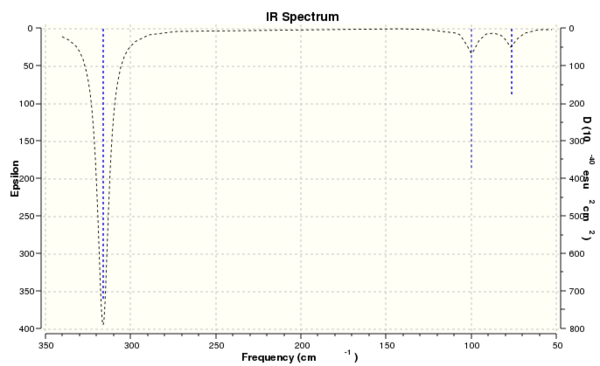
Computed IR Spectrum of GaBr3
Comparison of the Frequency Analysis of BH3 and GaBr3
| Vibration Mode | BH3 frequency (cm-1) | GaBr3 frequency (cm-1) |
|---|---|---|
| A2 | 1163 | 100 |
| E' | 1213 | 76 |
| E' | 1213 | 76 |
| A1' | 2583 | 197 |
| E' | 2716 | 316 |
| E' | 2716 | 316 |
It is clear from the table above that the frequencies corresponding to the vibrations in GaBr3 are much lower than those for BH3. This is due to the increased mass of both the central atom and the ligand. This is not surprising as we can model chemical bonds as a spring with masses at each end, the frequency of this vibrating "spring" is inversely proportional to the square root of the reduced mass of the system. The reduced mass of a system μ=m1m2/m1+m2 therefore it is intuitive that an increase in the mass of the system will lead to a decrease in the frequency.
For both spectra a similar pattern is observed with three low frequency vibrations (1-3), one vibration missing due to a symmetric stretch lacking a change in overall dipole moment and a further set of three high frequency vibrations, or both GaBr3 and BH3 these sets are made up of two degenerate vibrations and thus only three peaks are observed in each spectra. The vibrational modes have a slight re-ordering, for BH3 the A2 mode has the lowest frequency, whereas for GaBr3 the A2 mode has the third lowest vibration frequency. There is a large difference in the intensity of these two umbrella motions, BH3 has an intensity of 93 whilst GaBr3 has a much lower value of 9 similarly the frequency of this vibration is 1163 compared to 100cm-1. Upon comparison of the displacement vectors it is noted that for GaBr3 it is the central gallium atom which has the largest displacement, however for the same vibrational mode in BH3 it is the hydrogen ligands which have the largest displacement vector, this is again due to the difference in the reduced mass.
The fundamental difference between the low and high frequency vibrations is due to the nature of these vibrations, the low frequency modes are bends which are generally lower in energy and thus observed at a lower frequency. In contrast stretches are typically higher energy motions and this occur at higher frequencies.
The same method must be used for both the optimisation of the molecule and the frequency analysis in order to maintain a consistent basis set for the computational calculations. Gaussian uses analytical derivatives to determine local minima on the potential energy surface (PES), once this is found via an optimisation calculation we carry out a frequency analysis to confirm that the structure is indeed at a potential minimum and not simply at a point where the gradient of the PES is equal to zero. If all the vibrational frequencies are real this confirms that the structure is at a minimum and thus confirms that the structure has been successfully optimised. This has been utilised above to compare and contrast BH3 to GaBr3.
BH3 MO Analysis
Optimisation log file DOI:10042/31155
| Summary Data | |
|---|---|
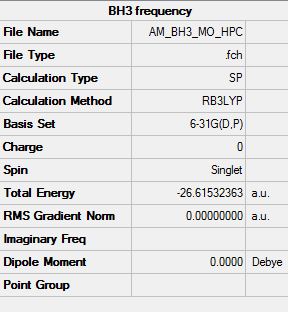
|
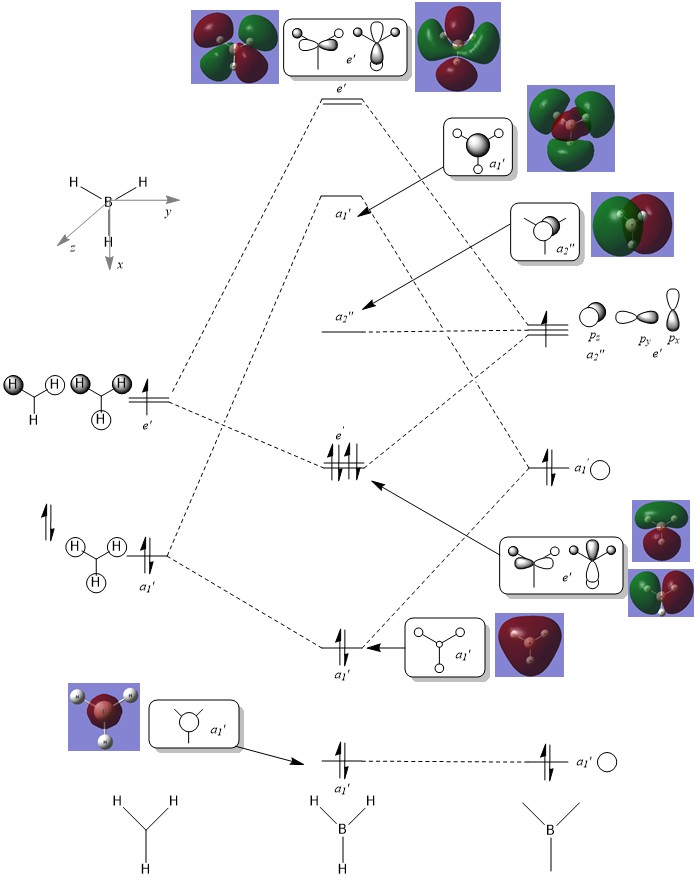
Molecular orbital diagram of BH3
It should be noted that the s-orbital localised on the boron atom is too low in energy to interact with any other orbitals, this large energy gap is not displayed on this simplified diagram above however the actual energy gap would be very large. The 1s orbital has an energy of -6.77 au (-1.78x10⁵ kJ mol-1) clearly too low in energy to interact with the next level at -0.51 au (-1.34x10³ kJ mol-1).
It is clear that upon comparison the computed MO's are relatively similar to the theoretical LCAO's. However, upon further examination it can be seen that only the general shape is matched, for more complex molecular orbitals a more accurate shape can only be produced via computational methods. LCAO theory can be used to give a good visual approximation which can be used to infer the bonding/anti-bonding character of the MO. However it could not be used to investigate the true nature and specific energy values for more complex systems where mixing is prevalent and the ordering of orbitals is more difficult to predict.
NH3 NBO Analysis
Initially a molecule of NH3 was optimised: NH3 Optimisation Calculation File
| Summary Data | Convergence |
|---|---|
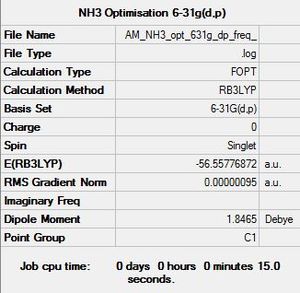
|
Item Value Threshold Converged? Maximum Force 0.000005 0.000450 YES RMS Force 0.000003 0.000300 YES Maximum Displacement 0.000010 0.001800 YES RMS Displacement 0.000007 0.001200 YES |
A frequency analysis was then conducted in order to determine whether a minimum energy configuration had been obtained: NH3 Frequency Calculation File
| Summary Data | Convergence |
|---|---|
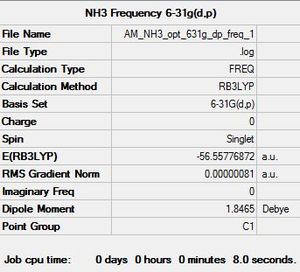
|
Item Value Threshold Converged? Maximum Force 0.000002 0.000450 YES RMS Force 0.000001 0.000300 YES Maximum Displacement 0.000005 0.001800 YES RMS Displacement 0.000003 0.001200 YES |
| Low Modes |
|---|
Low frequencies --- -6.8436 -5.1182 -1.4081 -0.0009 0.0016 0.0017 Low frequencies --- 1089.3464 1693.9250 1693.9291 |
The low frequency values are within the specified ±15 cm-1 range confirming a succesful frequency optimisation.
Finally a population analysis was performed on the optimised NH3 molecule: NH3 Energy Calculation File
| Summary Data |
|---|
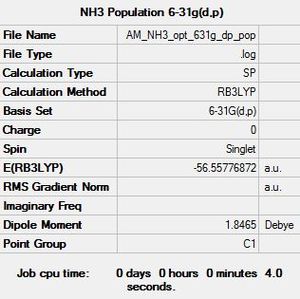
|
| Charge Distribution Data | ||
|---|---|---|
 |
 |
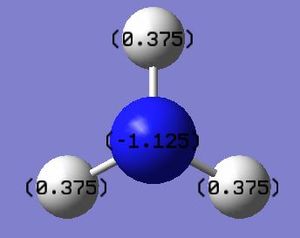 |
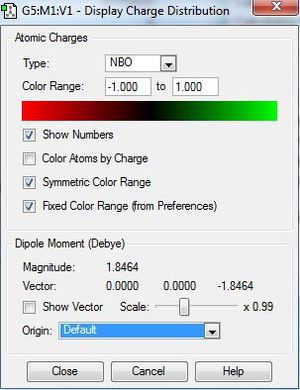
The .log file was used to investigate the charge distribution, as expected nitrogen was found to have a negative charge whilst the hydrogen atoms were positive. These calculations yield a basic diagram which can be used to show the clear difference in electronegativity between nitrogen and hydrogen. It is also noteworthy that summing the charge values of the three hydrogen atoms is equal and opposite to the charge of nitrogen, this is unsurprising as overall ammonia is a neutral molecule with zero net charge. Interestingly if this analysis was conducted with BH3 the boron would be positively charged and the hydrogens would carry a negative charge (hydrides) due to hydrogen being more electronegative than boron.
Ammonia-Borane Analysis
The next stage investigates the formation of ammonia-borane, formed from the reaction of boron and ammonia. Studying the energy of the reactants and products can allow for the calculation of the overall forward reaction. An ammonia-borane molecule was initially optimised: Ammonia-borane Optimisation Calculation File
| Summary Data | Convergence |
|---|---|

|
Item Value Threshold Converged? Maximum Force 0.000002 0.000015 YES RMS Force 0.000001 0.000010 YES Maximum Displacement 0.000024 0.000060 YES RMS Displacement 0.000010 0.000040 YES |
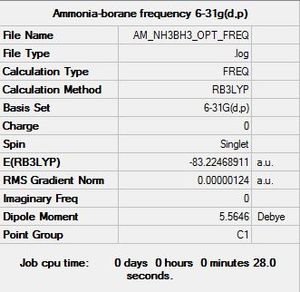
A frequency analysis was then conducted in order to determine whether a minimum energy configuration had been obtained: Ammonia-borane Frequency Calculation File
| Summary Data | Convergence |
|---|---|
|
         Item               Value     Threshold  Converged?
 Maximum Force            0.000004     0.000450     YES
 RMS     Force            0.000001     0.000300     YES
 Maximum Displacement     0.000024     0.001800     YES
 RMS     Displacement     0.000010     0.001200     YES
|
| Low Modes |
|---|
Low frequencies --- -3.4950 -2.7999 -0.0011 -0.0010 -0.0005 3.7086 Low frequencies --- 263.3369 632.9604 638.4385 |
After a successful optimisation and frequency analysis the energy values of products and reactants were compared:
| Molecule | Molecule Energy (au) |
|---|---|
| NH3 | -26.61532363 |
| BH3 | -56.55776872 |
| NH3BH3 | -83.22468911 |
ΔE=E(NH3BH3)-[E(NH3)+E(BH3)] is used to calculate the energy difference: -0.051597127 au which is equivalent to -135.4682672579 kJ mol-1. Thus the bond dissociation of B-N is calculated as approximately -135.5kJ mol-1. Due to the nature of this simple calculation the value obtained shows a deviation from the literature, however the value obtained is within a reasonable ballpark. This B-N bond can be considered to be a relatively weak bond strength, the overall formation of this bond is favorable as shown above; the product is lower in energy than the reactants, this is most likely due to the multiple resonance forms of ammonia-borane which enhance the stability of the product. Ammonia-borane is iso-electronic with ethane, however the C-C bond in ethane has a bond dissociation energy of ~350kJ mol-1 clearly much stronger than the B-N bond, this shows that the difference in both the electronegativities and atomic size contribute to the strength of the chemical bond.
Mini-Project - Lewis Acids and Bases
Introduction
Group 13 halides of the general formula MX3 have a wide range of chemical application and uses. Due to their relative electron deficiency these species all act as a Lewis acid and will readily accept a lone pair of electrons. This feature causes the monomeric species to readily undergo dimerisation to form complexes of the general forumla M2X6 which are known to exhibit both conventioanl 2-centre 2-electron bonding along with 3-centre 2-electron bonds.
A common example of these dimer structures is diborane (B2H6) which could not be rationalised via conventional valance shall electron pair repulsion (VSEPR) theory. However deeper investigation into the molecular orbitals does provide information for the origin of the unique bonding style. In general dimerised structures of group 13 elements have been studied containing only one halogen X group, this project aims to determine the effect of the presence of two different halides. This project focuses on aluminum as the group 13 metal and both chlorine and bromine as the halogen substituents. The Al2Cl4Br2 dimer is formed from two electron deficient AlCl2Br monomers. In order to study this molecule a full basis set using 6-31G(d,p) on Al and Cl and a PP LANL2DZdp on Br was calculated.
Analysis of Al2Cl4Br2 Isomers
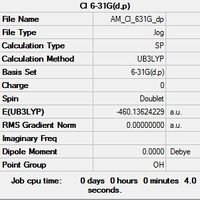
| Optimised Al File | Optimised Cl File |
|---|---|
 |
|
         Item               Value     Threshold  Converged?
 Maximum Force            0.000000     0.000015     YES
 RMS     Force            0.000000     0.000010     YES
 Maximum Displacement     0.000000     0.000060     YES
 RMS     Displacement     0.000000     0.000040     YES
|
         Item               Value     Threshold  Converged?
 Maximum Force            0.000000     0.000015     YES
 RMS     Force            0.000000     0.000010     YES
 Maximum Displacement     0.000000     0.000060     YES
 RMS     Displacement     0.000000     0.000040     YES
|
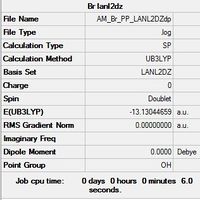
| Optimised Br File |
|---|
 |
Item Value Threshold Converged? Maximum Force 0.000000 0.000015 YES RMS Force 0.000000 0.000010 YES Maximum Displacement 0.000000 0.000060 YES RMS Displacement 0.000000 0.000040 YES |
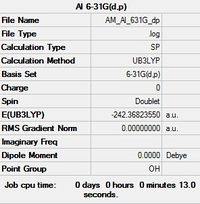
The chemistry and physics of molecules is mainly governed by valance electrons, instead of using the 6-31G(d,p) basis set for Br a pseudo-potential is used to replace the core electrons with an effective potential. This saves valuable computational time and allows for a more accurate optimisation of the dimer.
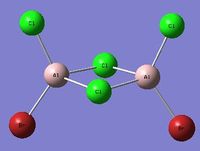
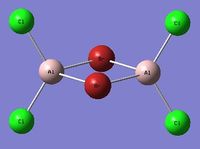
From here the five possible isomers of the Al2Cl4Br2 dimer were investigated with a user defined basis set (GEN), using the 6-31G(d,p) basis set for both Al and Cl atoms and a LANL2DZDP pseudo potential for Br atoms:
| Isomer 1[1] Symmetry: C2v |
|---|
 |
 |
Item Value Threshold Converged? Maximum Force 0.000001 0.000015 YES RMS Force 0.000000 0.000010 YES Maximum Displacement 0.000036 0.000060 YES RMS Displacement 0.000012 0.000040 YES |
| Isomer 2[2] Symmetry: D2h |
|---|
 |
 |
Item Value Threshold Converged? Maximum Force 0.000002 0.000015 YES RMS Force 0.000001 0.000010 YES Maximum Displacement 0.000032 0.000060 YES RMS Displacement 0.000011 0.000040 YES |
| Isomer 3[3] Symmetry: C2h |
|---|
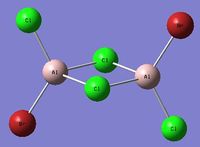 |
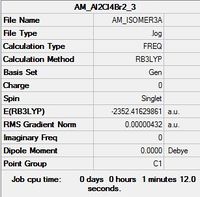 |
Item Value Threshold Converged? Maximum Force 0.000009 0.000015 YES RMS Force 0.000002 0.000010 YES Maximum Displacement 0.000045 0.000060 YES RMS Displacement 0.000015 0.000040 YES |
| Isomer 4[4] Symmetry: C1 |
|---|
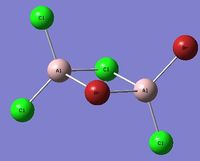 |
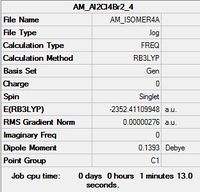 |
Item Value Threshold Converged? Maximum Force 0.000002 0.000015 YES RMS Force 0.000001 0.000010 YES Maximum Displacement 0.000052 0.000060 YES RMS Displacement 0.000017 0.000040 YES |
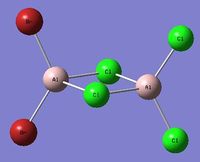
It should be noted that due to the nature of the dimer a fifth conformation is possible in which both Br atoms are terminal and Cl atoms bridge across the two Al atoms. This final structure was studied using the same basis set as the four isomers above.
| Isomer 5[5] Symmetry: C2v |
|---|
 |
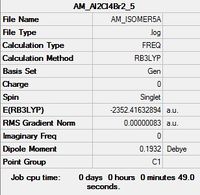 |
Item Value Threshold Converged? Maximum Force 0.000001 0.000015 YES RMS Force 0.000000 0.000010 YES Maximum Displacement 0.000028 0.000060 YES RMS Displacement 0.000011 0.000040 YES |
References
- ↑ A. Marks, 2014, http://hdl.handle.net/10042/31273
- ↑ A. Marks, 2014, http://hdl.handle.net/10042/31276
- ↑ A. Marks, 2014, http://hdl.handle.net/10042/31279
- ↑ A. Marks, 2014, http://hdl.handle.net/10042/31277
- ↑ A. Marks, 2014, http://hdl.handle.net/10042/31274
Isomer Energy Comparison
| Isomer 1 | Isomer 2 | Isomer 3 | Isomer 4 | Isomer 5 | |
| Energy (au) | -2352.41627846 | -2352.40630798 | -2352.41629861 | -2352.41109948 | -2352.41632894 |
| Energy Difference(au) | 5.048E-05 | 0.01002096 | 3.033E-05 | 0.00522946 | 0 |
| Energy Difference(kJ mol-1) | 0.13 | 26.31 | 0.08 | 13.73 | 0 |
Upon comparison of the energy data isomer 5 was found to have the lowest energy. However all four isomers are noticeably close in energy with a maximum difference of 26.31kJ mol-1 between the highest and lowest energy conformations. Due to the nature of the inaccuracy involved within the calculations (+/-10kJ mol-1) it cannot be said with absolute certainty that isomer 5 is more stable than isomer 1 or 3 which are extremely close in energy. However it can be used as a good basis set for further investigation.
The suggested lowest energy conformer is isomer 5 in which both Cl atoms are bridging and both Br atoms are terminally bonded to the same Al atom. The highest energy conformation is isomer 2 which is composed of two bridging Br atoms, this suggests that bridging Br atoms is more unfavorable than bridging Cl atoms. This makes sense as you move down group 17 the increase in atomic radius would cause a larger steric repulsion and increase the bond angle for bridging Br, this would be expected to destabilse the structure. From an orbital approach it may be expected that the adjacent terminal Br atoms would have a better orbital overlap in comparison to Br-Cl overlap, orbitals of similar size have a greater interaction and this would suggest why isomer 5 is the lowest energy configuration, having both Br-Br and Cl-Cl orbital overlap versus two Br-Cl overlaps which would be poorer. This would also explain why isomer 4 has a higher energy as this conformation is composed of two sets of Br-Cl overlaps, in both the bridging and terminal positions.
Interestingly from an electrongeativity view point, Br is less electronegative than Cl. Therefore it might be expected that placing the two Br atoms in the bridging position would lead to a more favorable interaction between the two Br atoms which are able to share more electron density in comparison to the more electronegative Cl atom which would be expected to hold onto a great share of this electron density. However the energy calculations above clearly show that placing the Br atoms in the bridging position is more unfavorable than having Cl atoms bridge, this suggests that this difference in electronegativity is out-weighed by the other factors discussed, as isomer 2 is actually the highest energy conformation.
Isomers 1&3 only differ by the stereochemistry of the terminal bromine and chlorine atoms. Of the two stereoisomers the suggested lowest energy conformer is the trans form (isomer 3), this makes sense as this conformation has the largest separation of the two bromine atoms, this would reduce the amount of steric hindrance between the two and thus is the lower energy stereoisomer. Isomer 3 also has a smaller dipole moment 0.0002 Debye than the cis form (isomer 1) which has a dipole moment of 1.1389 Debye, this is another stabilising factor which lowers the energy of isomer 3.
Lowest Energy Conformer: Isomer 5 |
It is clear from the calculations above that moving the position of the Br atom has a small, but significant, effect on the energy of each conformation, a combination of the stabilising factors discussed above can be used to support the claim that isomer 5 is the lowest energy and thus most stable conformer.
Further Analysis of the Al2Cl4Br2 Dimer
NBO Charge Distribution Analysis
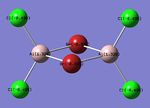
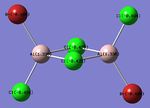
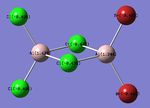
In order to form a more detailed analysis of the dimer structure further calculations were conducted. The NBO charge distribution for each configuration was produced, in an effort to rationalise the ordering of the energetic stability upon altering the position of the halogen atoms.
| Bridged-Configuration | Trans-Configuration | Cis-Configuration |
 |
 |
 |
| μ-Br: -0.336 | t-Br: -0.406 | t-Br: -0.402 |
| t-Cl: -0.496 | t-Cl: -0.494 μ-Cl: -0.435 | t-Cl: -0.496 μ-Cl: -0.435 |
| Al: 1.328 | Al: 1.336 | Al: 1.244 |
As expected, the relative distribution of charge is strongly related to the (Pauling) Electronegativity of each atom (χCl = 3.16 χBr = 2.96 χAl = 1.61). Cl is the most electronegative atom and thus has the largest partial negative charge. Similarly to the ammonia molecule investigated previously the summation of the partial charges results in a net value of zero which is consistent with the fact that the dimer is neutrally charged. The charge distribution is also in-keeping with the point group symmetry of the molecule with the charge distribution across the two bridging Chlorine atoms, or two terminal Bromine atoms being numerically identical.
Bond Length/Angle Investigation
Further investigation was taken to determine how well the dimer structure had been optimised, the bond angles and bond lengths of three configurations were studied, this can then be used to rationalise the relative stability of each conformer upon altering the bridging and terminal halogen.
Sterics dictates that the two larger halogen atoms would prefer to adopt a configuration that maximises their separation (minimising their steric clash), therefore making the trans- form the most stable, however electronics would dictate that the two least electronegative halogen atoms (the two Bromine atoms) would prefer to be situated in the bridging positions (thereby allowing dative covalent bonding into the electron deficient acceptor p- orbital of the Aluminium to occur more readily than would happen if the more electronegative Chlorine atoms were situated in the bridging positions). This is consistent with the calculations above which suggest that the lowest energy conformation occurs with both Cl atoms in the bridging position, minimising the steric clash and with both Br atoms adjacent to each other maximising orbital overlap. In order to confirm that the calculations had successfully optimised the dimer (therefore reducing the error) the bond lengths and triatomic bond angles were viewed using GaussView, these values were then compared to literature data:

|
Br-Al Bond Length (bridge)(Å) | Cl-Al Bond Length (terminal)(Å) | Cl-Al-Cl Bond Angle (terminal)(o) | Br-Al-Br Bond Angle (bridge)(o) |
|---|---|---|---|---|
| Al2Br2Cl4 | 2.49 | 2.10 | 122 | 88 |

|
Br-Al Bond Length (terminal)(Å) | Cl-Al Bond Length (terminal)(Å) | Cl-Al Bond Length (bridge)(Å) | Br-Al-Cl Bond Angle (terminal)(o) | Cl-Al-Cl Bond Angle (bridge)(o) |
|---|---|---|---|---|---|
| Al2Br2Cl4 | 2.27 | 2.10 | 2.30 | 122 | 90 |

|
Br-Al Bond Length (terminal)(Å) | Cl-Al Bond Length (terminal)(Å) | Cl-Al Bond Length (bridge)(Å) | Br-Al-Br Bond Angle (terminal)(o) | Cl-Al-Cl Bond Angle (terminal)(o) | Cl-Al-Cl Bond Angle (bridge)(o) |
|---|---|---|---|---|---|---|
| Al2Br2Cl4 | 2.23 | 2.10 | 2.30 | 121 | 122 | 90 |
Bond Length Literature Values [1]:
Al-Cl(terminal): 2.06Å
Al-Br(terminal): 2.21Å
Al-Cl(μ-bridging): 2.21Å
Al-Br(μ-bridging): 2.33Å
Firstly it should be noted that in general the calculated bond lengths are in agreement with the data presented by the literature. This would suggest that the optimisation of each configuration has been a success.
In terms of configuration stability firstly, it can be seen that altering the position of the Br atoms has no apparent effect on the terminal Al-Cl bond length, which remains constant at 2.10 Å, this value is coherent with the literature value of 2.06Å.
The most interesting observation is the change in Al-Br bond length between the three configurations. For both the cis and trans configurations the terminal Al-Br bond length is comparable 2.23 Å(cis) to 2.27 Å(trans) however upon placing the Br atoms in the bridging position the Al-Br bond is elongated to 2.49 Å. This observation is consistent with the increase in atomic radius upon moving down group 17, from Cl to Br. This elongation would be expected to lead to a weaker orbital overlap between the Al and Br atoms, this may explain why placing the Br atoms in the bridging position is the least stable configuration. The increase in bond angle upon placing the Br atoms in the bridging position could be due to the unfavorable steric effect, which is reduced upon placing both Cl atoms in the bridging position. Whilst this cannot be used as conclusive evidence for the order of stability of the three configuration it can be used in conjunction with previous calculations as evidence for the overall stability of isomer 5.
References
- ↑ K. Wade, J. Chem. Educ., 49, 1972, pp. 502-505
Investigation & Analysis of the Monomer
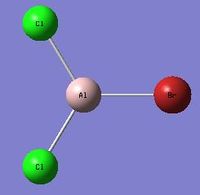
Due to the nature of the dimer structure, isomer 5 can undergo dynamic exchange between different isomeric forms. The dissociation reaction of the dimer would give 2 units of the AlCl2Br monomer, energy calculations were performed in order to determine whether this dissociation is a favorable or unfavorable forward reaction.
| AlCl2Br Monomer[1] |
|---|
 |
 |
Item Value Threshold Converged? Maximum Force 0.000010 0.000015 YES RMS Force 0.000006 0.000010 YES Maximum Displacement 0.000053 0.000060 YES RMS Displacement 0.000029 0.000040 YES |
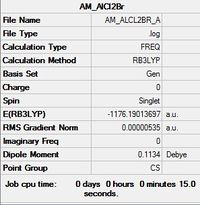
In order to investigate the dimer dissociation reaction, a molecule of the AlCl2Br monomer was optimised. The overall reaction is Al2Cl4Br2 -> 2AlCl2Br therefore taking the computed energy value for the monomer and doubling it gives a value for the products = -2352.380274 au .
The following equation can be used to estimate the dissociation energy of the dimer: ΔE=2[E(AlCl2Br)]-E(Al2Cl4Br2) Therefore the overall energy for the dissociation ΔE=2[-1176.19013697]-[-2352.41632894] = 0.036055 au This corresponds to a dissociation energy of approximately 94.66 kJ mol-1 This positive energy shows that the dissociation of the dimer is unfavorable, the formation of the dimer structure is a stabilising reaction as it reduces the electron deficiency of the two monomers. This makes sense as the aluminum atom has a vacant orthogonal p-orbital rendering the monomer electron deficient, this deficiency is alleviated upon the formation of the dimer structure, hence the dissociation energy is positive and is an unfavorable reaction.
References
- ↑ A. Marks, 2014, http://hdl.handle.net/10042/31272
Frequency Analysis of each Conformer
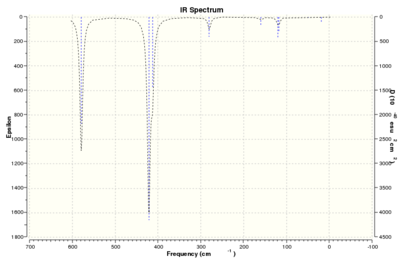
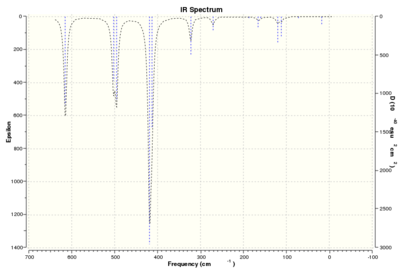
A frequency analysis was conducted on each of the four isomers, the IR spectra for each conformation is presented below, along with the low frequency data for each:
| Isomer 1[1] | Isomer 2[2] | |
 |
 |
|
Low frequencies ---   -1.3372   -0.7705    0.0022
                       0.0026    0.0029    2.2150
Low frequencies ---   17.4966   51.1456   78.5268
|
Low frequencies ---   -5.1563   -5.0307   -3.1533
                       0.0020    0.0027    0.0029
Low frequencies ---   14.8348   63.2722   86.0761
| |
| Symmetry = C2v | Symmetry = D2h |
| Isomer 3[3] | Isomer 4[4] | |
 |
 |
|
Low frequencies ---   -5.1000    0.0030    0.0035
                       0.0045    1.4691    2.0729
Low frequencies ---   18.1589   49.1139   73.0100
|
Low frequencies ---   -2.4842    0.0018    0.0023
                       0.0027    0.7063    3.1067
Low frequencies ---   17.1141   55.9267   80.0587
| |
| Symmetry = C2h | Symmetry = C1 |
| Isomer 5[5] |
|
Low frequencies ---   -4.1684   -2.6440   -1.3039
                      -0.0017   -0.0009    0.0019
Low frequencies ---   17.7242   50.9217   72.1760
|
| Symmetry = C2v |
The first observation is the similarity of the IR spectra of isomer 1&3, this is unsurprising as these are the cis/trans stereoisomers of the dimer. There symmetry is closely related, isomer 1 has a C2v point group whilst isomer 3 has a C2h point group, due to the closely related symmetry of these two conformations their IR spectra and therefore vibrational modes are also very closely related. Isomer 4 displays the highest number of IR active bands, this is due to the conformations lack of symmetry, it has a point group of C1 and therefore almost all of its individual vibrational modes cause a change in the overall dipole moment and thus are IR active. It is clear that as the dimer becomes more symmetrical the tendency for a vibrational mode to be symmetric also increases and therefore due to the nature of these vibrations these bands are not IR active, hence the reason for isomers 1-3 displaying fewer IR bands than isomer 4.
One advantage of computational chemistry is that the position of bands that are not experimentally active can be calculated, as previously discussed in order for an IR band to be active there must be a change in overall dipole moment upon vibration, if this condition is not met then no IR band is observed.
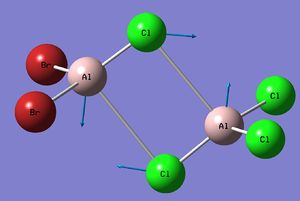
Individual vibrations were selectively studied in order to investigate the position and nature of Al-Br stretching vibrations with respect to the terminal or bridging position of the Br atom, this stretch is of great interest as it involves the two heaviest atoms in the dimer. Upon initial observation of the vibrational animations for isomer 4 (which contains one bridging Al-Br bond and one terminal Al-Br bond) it was found that the stretches involving Al-Br bridging motions occurred for the 11th,12th,13th and 14th highest energy motions the motions involving the terminal Al-Br bond occur between the four highest energy motions between 15 to 18.
In order to compare the effect of bridging Cl vs bridging Br, the 11th highest energy vibrational motion of isomers 2,4 and 5 was compared.
| Isomer 2[6] | Isomer 4[7] | Isomer 5[8] | |
| Vibrational Motion | 
|

|
|
| Frequency (cm-1) | 197 | 211 | 264 |
| Intensity | 0 | 21 | 0 |
| Force Constant | 0.71 | 0.87 | 1.27 |
| Reduced Mass | 30.89 | 33.30 | 31.01 |
Isomer 2 has both Br atoms bridging whilst isomer 4 has one bridging Br and one terminal Br, finally isomer 5 has zero bridging Br atoms and two terminal Br atoms. These three isomers were chosen specifically as the three possible positions of the Br atoms is explored. The first observation is that although these three vibrations are the same motion each isomer has a different frequency.
There is a difference of 67 cm-1 between isomers 2 & 5, this difference alone shows that moving the position of the Cl and Br atoms has a significant impact on the vibrational modes. Isomer 2 has the lower energy vibration with the Br atoms bridging, the higher energy vibration occurs for isomer 5 when both Cl atoms are bridging. The difference in force constant indicates that there is a difference in the strength of the bond, this makes sense; the strength of the Al-Br bond will differ from the strength of the Al-Cl bond. The second point to note is that for both isomer 2 & 5 this stretch is IR inactive, there is no overall change in dipole moment due to the symmetrical nature of both conformations. This stretch is IR active for isomer 4 which has the lowest symmetry of these three isomers, thus this motion causes an overall change in the dipole moment and an IR band is observed at this frequency.
This can be used to rationalise the stability of bridging Cl atoms over bridging Br's, the higher energy vibration occurs when the Cl atoms are bridging; the larger force constant indicates that the Al-Cl bridging bond is stronger than the Al-Br bridging bond. This observation is consistent with the predicted theory and is modeled in the using this equation for simple harmonic motion, where the vibrational frequency can be written as:
where k = force constant and = reduced mass
The force constant is directly related to bond strength, thus a higher force constant is equivalent to a stronger bond, which in turn corresponds to an overall increase in the stability of the dimer when Cl atoms bridge vs. Br atoms bridging.
Next in order to compare the difference between bridging and terminal Br atoms, the 15th highest energy vibrational motion of isomers 2,4 and 5 was compared.
| Isomer 2[9] | Isomer 4[10] | Isomer 5[11] | |
| Vibrational Motion | 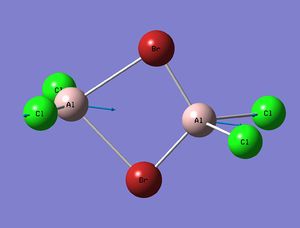
|

|

|
| Frequency (cm-1) | 467 | 424 | 419 |
| Intensity | 347 | 274 | 310 |
| Force Constant | 3.93 | 3.22 | 3.09 |
| Reduced Mass | 30.59 | 30.38 | 29.92 |
The first point to note is that the terminal stretches occur at a higher vibrational frequency, this is due to a difference in bond strength between bridging and terminal bromine atoms. The terminal Br atoms are bonded in a (2c-2e) fashion, this is the conventional two electron two center bond. In comparison the bridging Br atoms are three center, two electron (3c-2e) bonds in order to alleviate the electron deficiency of the aluminum. A (3c-2e) bond is inherently weaker than a (2c-2e) bond due to a larger spread of the electron density, this can be seen from the calculated force constants for these motions, bridging Br atoms have a smaller force constant and therefore have lower energy vibrational frequencies.
Again this observation is consistent with the predicted theory, modeled by the equation for simple harmonic motion, where the vibrational frequency can be written as:
where k = force constant and = reduced mass
The force constant itself is a second derivative and is used to define the curvature of a potential energy surface, a high force constant correlates to a stronger bond. This is depicted above, the force constants for the lower energy vibration are ~1 whereas the higher frequency terminal Br stretches have force constants of ~3. This supports the idea that the dimer structure is composed of both (2c-2e) terminal bonds and weaker (3c-2e) bridging bonds. Although simple in nature these frequency calculations have provided data that is consistent with the predicted theory and demonstrate the power of computational analysis.
References
- ↑ A. Marks, 2014, http://hdl.handle.net/10042/31273
- ↑ A.Marks, 2014, http://hdl.handle.net/10042/31276
- ↑ A. Marks, 2014, http://hdl.handle.net/10042/31279
- ↑ A.Marks, 2014, http://hdl.handle.net/10042/31277
- ↑ A. Marks, 2014, http://hdl.handle.net/10042/31274
- ↑ A.Marks, 2014, http://hdl.handle.net/10042/31276
- ↑ A.Marks, 2014, http://hdl.handle.net/10042/31277
- ↑ A. Marks, 2014, http://hdl.handle.net/10042/31274
- ↑ A.Marks, 2014, http://hdl.handle.net/10042/31276
- ↑ A.Marks, 2014, http://hdl.handle.net/10042/31277
- ↑ A. Marks, 2014, http://hdl.handle.net/10042/31274
Molecular Orbital Calculation of Isomer 5
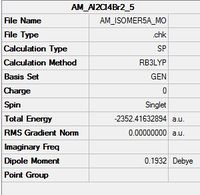
A molecular orbital calculation was conducted on isomer 5, the lowest energy conformer. The natural bond orbitals (NBOs) combines a set of mathematical algorithms for analysing electronic wavefunctions in the language of localised Lewis-like chemical bonds, this means that the computed NBOs look like what you would expect from pre-quantum chemistry Lewis diagrams (lone-pairs and hybrids). In addition to this a population analysis was performed in order for the predicted molecular orbitals to be visualised, a sample of these MO's are analaysed below:
| Isomer 5 MO Analysis[1] |
|---|
 |
The Al2Cl4Br2 dimer contains 164 electrons, therefore is composed of 82 filled molecular orbitals. Due to the nature of the NBO analysis bromine's core molecular orbitals are treated as a pseudo-potential and therefore are not involved in the calculation.
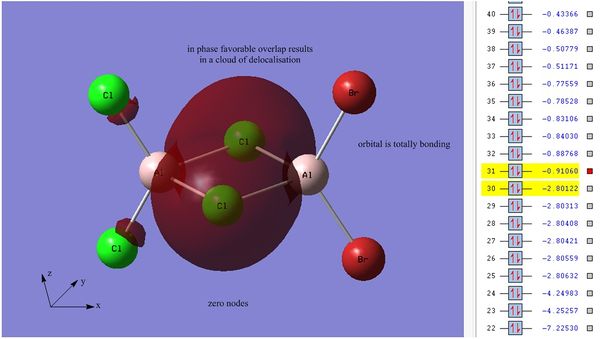
It should be noted that first 30 computed orbitals are far too low in energy to interact in bonding and these MO's are localised on each atom. These are the core molecular orbitals and are generally not considered during calculations. The first transition between core and non-core molecular orbitals is between orbital numbers 30 and 31:
Orbital 30 has an energy value of -2.80122 au which is clearly too low to interact. The MO visualisation shows that the orbitals are localised on one of Al atoms, these atomic orbitals are representative of the aluminium pz orbitals.
There is a large jump in energy when moving from orbital 30 to orbital 31, with a difference of ~4963.82 kJ mol-1. Orbital 31 is the first non-core molecular orbital, here the bridging Cl s atomic orbitals are delocalised across the centre of the dimer, there are zero nodes which is indicative of a fully bonding molecular orbital. This orbital is strongly bonding in nature. The atomic orbital's involved are the Cl 3s orbitals, there interactions are strong and all in phase.
Orbital 40 exhibits large areas of bonding character, this is depicted by the delocalisation across the dimer. This is caused by the in phase overlap of the Cl, Al and Br pz atomic orbitals. This also creates a nodal plane which passes directly through the Al atoms. In addition to this weak through space bonding interactions are observed between the two bridging Cl atoms and a very long range interaction between terminal Cl and Br atoms. This non-core MO is relatively low in energy due to its high overall bonding nature. There are however some anti-bonding interactions observed between the two adjacent terminal Cl atoms and the two adjacent terminal Br atoms however these are weak through space interactions which are not substantial enough to cause overall destabilisation of the orbital.
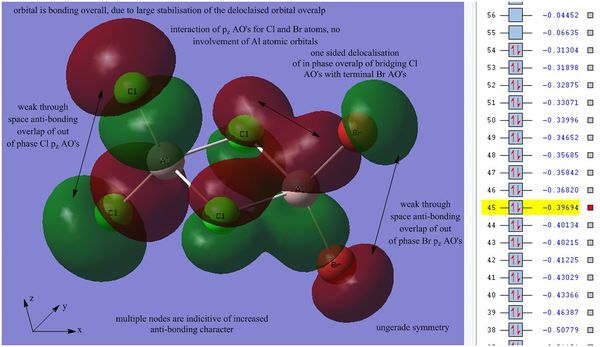
The higher energy and therefore more anti-bonding orbital 45 was then analsyed:
Orbital 45 is higher in energy in comparison to the previous two orbitals, this indicates that the degree of anti-bonding character is increased. This orbital displays the interactions between both Cl and Br pz atomic orbitals, there is no involvement of Al AO's. There is large amount of delocalisation observed between the terminal Br atoms and the bridging Cl atoms due to the favorable in phase overlap of each atomic orbital, this delocalisation is interestingly located on only one side of the dimer. Even though this is a long range through space interaction the extent of delocalisation suggests that this overlap is very favorable. A second bonding interaction is observed between the two bridging Cl atoms, however this is much weak and causes zero delocalisation across the ring. There is a weak through space out of phase overlap between the adjacent terminal Cl atoms and between the adjacent terminal Br atoms which destabilises the orbital and gives the orbital a degree of anti-bonding character, hence the increased energy of this level in comparison to the previous two MO's.
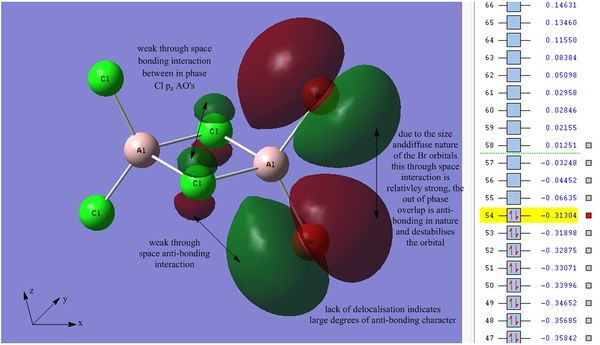
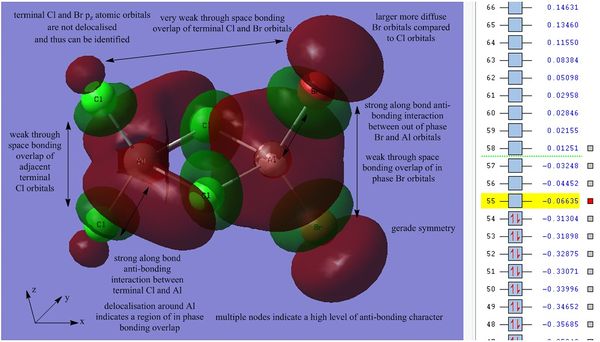
The next two molecular orbitals of interest are orbitals 54 & 55, orbital 54 is the HOMO and 55 the LUMO.
The HOMO exhibits a high degree of anti-bonding character, the orbital has no delcolaisation and involves Cl pz AO's with Br px AO's. It is also important to note that due to the position of bromine, relative to chlorine, in the periodic table bromine's AO's are larger and more diffuse than the more contracted Cl orbitals. It can be seen that the bridging Cl p-orbitals are in phase, these have the potential for a stabilising transannular interaction. The anti-bonding character displayed between both adjacent terminal Br atoms is strong due to the diffuse orbitals involved. The through space Cl-Br interaction is relatively weak but still anti-bonding in nature due to out of phase orbital overlap. The orbital is bonding overall which is indicated by the negative energy value showing that the orbital causes overall stabilisation to the structure. The Cl-Cl distance is less than the Br-Br distance and therefore overall this bonding interaction is more stabilising than the out of phase interaction between terminal Br atoms. Due to the lack of delocalisation each individual AO can be be identified, in this case the HOMO displays the interactions between the Br px orbitals and the Cl pz orbitals.
The HOMO-LUMO band gap was found to be 0.35046 au which is approximately 920.13 kJ mol-1.
Orbital 55 is the lowest unoccupied molecular orbital, overall this orbital is still weakly bonding. In comparison to the HOMO, orbital 55 exhibits delocalisation indicating an in phase overlap of atomic orbitals, the delocalisation occurs between the bridging Cl py orbitals and the Al s-orbitals. This in phase overlap is strongly bonding and stabilises the overall energy of the orbital. It should be noted that inversion through the center of symmetry results in the same phases for the molecular orbital, therefore the MO is said to have gerade (g) symmetry. In addition to this there is a weak through space bonding interaction between the two bridging Cl atoms, this weak through space bonding interaction is also present between adjacent terminal Cl atoms and adjacent terminal Br atoms. There are 8 nodes in total which contribute to the anti-bonding character of the orbital, there is a strong along bond anti-bonding interaction between the terminal Cl pz orbitals and the Al s orbitals this interaction is mirrored between the Al s orbitals and the terminal Br atoms, however is not significant enough to outweigh the overall bonding nature of this orbital.
In order to further the investigation an analysis was conducted on one non-occupied MO's, although it should be noted that these orbitals are not calculated in the same way as the filled orbitals they are an interesting additional visualisation.
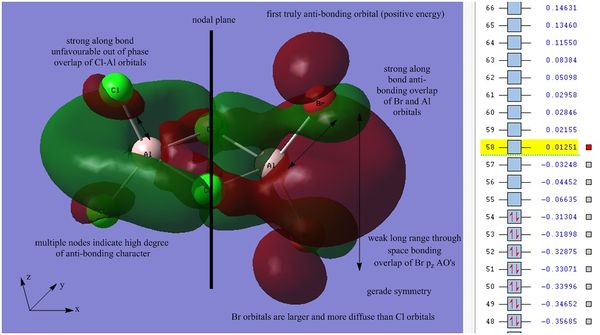
Simulated orbital 58 was then investigated as it is the first orbital with a positive energy value (0.01251 au) in the calculation.
Orbital 58 is the first truly anti-bonding orbital, inversion through the center of symmetry results in the same phases for the molecular orbital, therefore the MO is said to have gerade (g) symmetry. This orbital has a total of 8 nodes and exhibits multiple regions of anti-bonding interactions. There is a strong along bond anti-bonding interaction between the terminal Cl atoms and the Al px orbitals, this anti-bonding interaction is also present between the Al px orbitals and the terminal Br pz orbitals. There is a weak through space bonding interaction between the two bridging Cl atoms, which causes a region of delocalisation across the dimer and a much weaker through space bonding interaction between the adjacent terminal Br atoms, these interactions are not strong enough to stabilise the orbital and thus the overall orbital is anti-bonding.
The visualised orbitals, above, range from highly bonding to highly anti-bonding. These predicted orbitals were subsequently analysed and the multiple interactions observed have been discussed above. Further analysis of the dimer was then conducted to investigate additional interesting features of this unique structure, this has been presented above and can be found here
References
- ↑ A. Marks, 2014, http://hdl.handle.net/10042/31275
Conclusion
The aim of this mini-project was to utilise computational methods in order to determine the most stable configuration of the Al2Cl4Br2 Dimer. It was found that the bridging isomer was more stable than both the cis and trans isomers. The dimer dissociation reaction was then investigated to confirm that the dimer formation was indeed a favorable reaction, due to alleviating the electron deficiency of the constituent monomers. The determination that this association of two monomers resulted in a negative overall energy change confirms that this is indeed a favorable reaction. Frequency analysis was conducted with each isomer and the different vibrational frequencies were subsequently analsyed in an effort to rationalise the different IR spectra produced from each configuration. Visualisation of the non-core MO's allowed for a discussion into bonding and anti-bonding nature of these interactions. NBO charge distribution calculations provided data that is consistent with the predicted theory and demonstrates the influence of electronegativty of each atom. Finally in order to measure how well each isomer had been optimised measurement of bond lengths and bond angles was conducted, this also gave an insight into the relative stability of each isomer from a steric point of view.


