Rep:Mod:WLL12complab
BH3
Optimisation
B3LYP/3-21G
Optimisation log file here
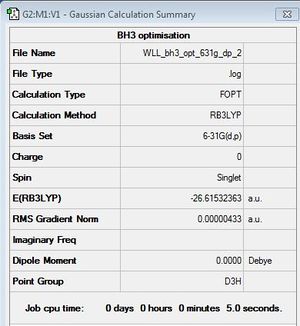
B3LYP/6-31G(d,p)
Optimisation log file here
| summary data | convergence | Jmol | |||
|---|---|---|---|---|---|
|
         Item               Value     Threshold  Converged?
 Maximum Force            0.000009     0.000450     YES
 RMS     Force            0.000006     0.000300     YES
 Maximum Displacement     0.000034     0.001800     YES
 RMS     Displacement     0.000022     0.001200     YES
 Predicted change in Energy=-4.440050D-10
 Optimization completed.
    -- Stationary point found.
|
|
BH3 Frequency Analysis
B3LYP/6-31G(d,p)
Frequency file: here
| summary data | low modes |
|---|---|

|
Low frequencies --- -2.3742 -1.0821 -0.0055 2.0837 10.1950 10.2522 Low frequencies --- 1162.9856 1213.1754 1213.1781 |
Vibrational spectrum for BH3
| wavenumber/cm-1 | Intensity | IR active? | type |
| 1163 | 93 | Yes | Bend |
| 1213 | 14 | Very slightly | Bend |
| 1213 | 14 | Very slightly | Bend |
| 2582 | 0 | No | Stretch |
| 2715 | 126 | Yes | Stretch |
| 2715 | 126 | Yes | Stretch |
There are 6 vibrations but only 3 peaks are observed in the vibrational spectrum. This is because two of the three peaks come from two separate degenerate sets, one at 1213 cm-1, and the other at 2715 cm-1. The vibration at 2582 cm-1 is IR inactive therefore it will not appear in the spectrum. A vibration is IR inactive when it is a symmetric stretch and it does not cause a change in dipole moment of the molecule.
The vibration at 1213 cm-1 is due to bond angle deformation. The degenerate vibrational mode at 2715 cm-1 corresponds to two asymmetric bond stretchings. These cause a change in dipole moment, therefore they are IR active.
Molecular Orbitals of BH3
B3LYP/6-31G (d,p)
Molecular orbital analysis file: DOI:10042/31158
| Molecular Orbital Diagram of BH3 |
|---|

|
Are there any significant differences between the real and LCAO MOs? What does this say about the accuracy and usefulness of qualitative MO theory?
In general the the real MOs have the same phase distribution and nodes as the LCAO MOs. However, the orbitals in the real MOs are not shown as clear as those in the LCAO. For example, two phases and a node are present in the degenerate 1e' MOs for both real and LCAO MOs but the s orbital and p orbital are not shown in the real MOs.
The linear combination of atomic orbitals (LCAO) approximation combines the atomic orbitals of all atoms in the molecule to give molecular orbitals. It allows the generation of MOs for a compound without the need of complex calculation. However, it is clear that there is some difference in LCAO compared to the 'real' MOs. It may be due to the fact that electrons are more delocalised around the entire molecule than in LCAO. There are also through-space and through-bond interactions between atoms which are not taken in account in LCAO.
GaBr3
Optimisation
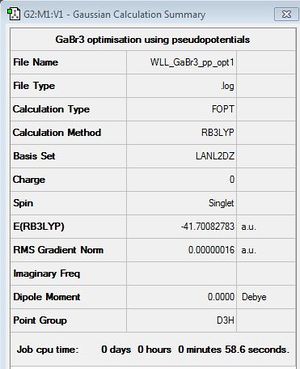
B3LYP/LANL2DZ
optimisation file: DOI:10042/31134
| summary data | convergence | Jmol | |||
|---|---|---|---|---|---|
|
          Item               Value     Threshold  Converged?
 Maximum Force            0.000000     0.000450     YES
 RMS     Force            0.000000     0.000300     YES
 Maximum Displacement     0.000003     0.001800     YES
 RMS     Displacement     0.000002     0.001200     YES
 Predicted change in Energy=-1.282670D-12
 Optimization completed.
    -- Stationary point found.
|
|
GaBr3 Frequency Analysis
B3LYP/6-31G (d,p)
Frequency file: DOI:10042/31154
| summary data | low modes |
|---|---|
|
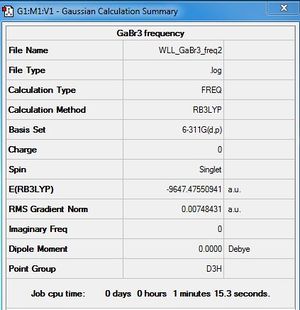
Low frequencies --- -0.0061 0.0071 0.0083 33.7901 33.7901 34.0466 Low frequencies --- 85.9729 85.9731 124.3967 |
Optimisation was repeated for the frequency analysis log file of GaBr3. A frequency analysis of this optimised file has shown improved results. All frequencies are now close to zero (see below). Second optimisation file: here
B3LYP/6-31G (d,p)
Frequency file: DOI:10042/31208
| summary data | low modes |
|---|---|

|
Low frequencies --- -0.9791 -0.0030 0.0140 0.0661 0.3333 0.3334 Low frequencies --- 80.9122 80.9123 109.4536 |
Vibrational spectrum for GaBr3
| wavenumber/cm-1 | Intensity | IR active? | type |
| 81 | 2 | Very slightly | Bend |
| 81 | 2 | Very slightly | Bend |
| 109 | 5 | Very slightly | Bend |
| 219 | 0 | No | Stretch |
| 339 | 70 | Yes | Stretch |
| 339 | 71 | Yes | Stretch |
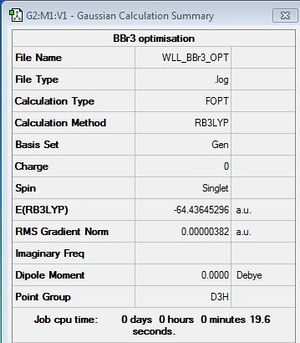
BBr3 Optimisation
B3LYP/6-31G(d,p),GEN
optimisation file: DOI:10042/31142
| summary data | convergence | Jmol | |||
|---|---|---|---|---|---|
|
          Item               Value     Threshold  Converged?
 Maximum Force            0.000008     0.000450     YES
 RMS     Force            0.000005     0.000300     YES
 Maximum Displacement     0.000036     0.001800     YES
 RMS     Displacement     0.000023     0.001200     YES
 Predicted change in Energy=-4.027212D-10
 Optimization completed.
    -- Stationary point found.
|
|
Geometry Comparison
| BH3 | GaBr3 | BBr3 | |
|---|---|---|---|
| r(E-X) Å | 1.19 | 2.35 | 1.93 |
| θ(X-E-X) degrees(º) | 120.0 | 120.0 | 120.0 |
What difference does changing the ligand have? How are H and Br similar, how are they different?
Both H and Br atom form a single bond with B atom. Changing the ligand resutls in a change in bond length. Br atom has lone pairs of electrons which can be donated into the vacant 2p orbital of boron. This forms an additional pπ-pπ back bonding. H atom has only one valance electron for bonding, therefore it cannot have back donation to B atom. The vacant 2p orbital in B atom makes BH3 a stronger lewis acid than BBr3. However, Br atom is larger than H atom and has more diffused orbitals. The 4p orbital of Br overlaps less effectively with the 2p orbital of B atom due to the difference in size of orbitals. This causes B-Br bond to be weaker than B-H bond and the bond length of B-Br is larger than B-H. This shows that the size of the ligand have a larger effect on bond distance than the ability of back donation from the ligand. Changing the ligand does not affect the bond angle. The bond angle in BH3 and BBr3 both remains as 120 degrees.
What difference does changing the central element make? How are B and Ga similar, how are they different?
Both B and Ga are Group 13 elements [1] but B is a gas and Ga is a metal. They form electron deficient compound which act as a Lewis acid. Boron tends to have the +3 oxidation state where as gallium can have +3 and +1 oxidation state. This is due to the inert pair effect. For larger atom like gallium, the s - p separation increases and this requires more energy to promote an electron for hybridisation. If energy of bond formation is less than energy of electron promotion, the metal will become monovalent. The bond angle remains the same for both BBr3 and GaBr3. Changing the central atom also causes a change in bond distance. Ga is in the same period as Br, therefore the overlap between 4p-4p orbitals can be better than the overlap between 2p-4p orbitals in B and Br atoms. However, Ga is larger than B and the orbitals are more diffused and this causes the bond length of Ga-Br to be larger than B-Br.
What is a bond? How much energy is there in a strong, medium and weak bond? Give examples of each type of bond (strong, medium and weak)
A bond [2] is a link between two atoms. Two nuclei approach each other and the electrons arrange themselves between these nuclei until they are in equilibrium. A bond forms when the molecule experience zero net force. There are different types of chemical bond. In an ionic compound e.g. NaCl, the Coulombic interactions between oppositely charge ions are known as the ionic bonding. The metallic bonding is the electrostatic forces between positively charged metal ions and delocalised outer electrons. Compounds that do not contain a metallic element form covalent bondings between the atoms by sharing pairs of electrons.
In a strong bond, there are high bond enthalpy and force constant. A N≡N triple bond is an example of a strong diatomic covalent bonding. It has a bond order of 3 and its bond enthalpy is 946 kJ/mol[3]. A O=O bond is a kind of medium bond with a bond enthalpy of 497 kJ/mol[3]. It is a double bond sharing two pairs of electrons. A C-H bond has a bond enthalpy of 412 kJ/mol, therefore it is also a medium bond despite being a single bond. A weak bond will have a bond enthalpy below 200 kJ/mol. I2 is a single bonded molecule with a bond enthalpy of only 151 kJ/mol[3]. The large and diffused orbitals in iodine are poorly overlapped and hence forms a weak bond.
In some structures gaussview does not draw in the bonds where we expect, why does this NOT mean there is no bond?
The formation of bond in qussview is determined by some pre-defined values. If two atoms are at a distance that is within the range pre-defined by the programme, a bond is shown. If these atoms are too far apart, a bond will be not shown. However, it is possible that the bond does exist between the atoms.
Vibrational Spectra Comparison
| Molecule | Wavenumber/ cm-1 | Vibrational spectra |
|---|---|---|
| BH3 | 1163, 1213, 1213, 2582, 2715, 2715 | 
|
| GaBr3 | 81, 81, 109, 219, 339, 339 | 
|
Compare and contrast the vibrational spectra for BH3 and GaBr3. What does the large difference in the value of the frequencies for BH3 compared to GaBr3 indicate?
In both vibrational spectra, the vibrations of the bond angle deformation are lower than the vibrations of bond stretch. Both have 6 vibrations in total but only 3 peaks are observed. Two of the peaks are from two different degenerate sets of vibrations and one of the six vibrations is IR inactive due to symmetrical bond stretching. Two clear sharp peaks can be seen in the IR spectrum of BH3. On the other hand, only one sharp peak is seen in the IR spectrum of GaBr3. The main difference is that the intensity of vibrations and the frequencies of BH3 are much higher than GaBr3. In the following equation, frequency, v, is inversely proportional to the square root of reduced mass, μ and directly proportional to the square root of force constant k. m is the mass of the atom.
BH3 is smaller and has a lower reduced mass than GaBr3, therefore the vibrational frequencies of BH3 will be higher than GaBr3. The equation also gives information about the bond strength. The higher the frequencies, the larger the force constant, and the stronger the bond. BH3 has higher frequencies than GaBr3 and this indicates that B-H bond is stronger than Ga-Br bond. This is supported by the fact that 2p-2p overlap is better than 4p-4p overlap.
A reordering of modes: seen in relation to the A2" umbrella motion. Compare the relative frequency and intensity of the umbrella motion for the two molecules. Looking at the displacement vectors how has the nature of the vibration changed? Why?
For BH3, the A2" umbrella motion has a frequency of 1163 cm-1 and an intensity of 93. For GaBr3, this vibration has a frequency of 109 cm-1 and the intensity is only 5. The displacement vectors in BH3 are on the three H atoms and not on B atom. H atoms are lighter than the B atom, therefore they can move back and forth more freely and results in a high intensity. In GaBr3, the displacement vector is on the centre atom rather than on the ligands. Ga atom is lighter than Br atoms so it is the one that moves back and forward. Overall GaBr3 is heavier than BH3. The intensity and frequency of this vibration is much lower in GaBr3 compared to BH3. Once again, this can be explained using the equation above. The higher the reduced mass of the molecule, the higher the frequency.
Why must you use the same method and basis set for both the optimisation and frequency analysis calculations? What is the purpose of carrying out a frequency analysis?
The method determines the type of approximations utilised in solving the Schrodinger Equation, while the basis set gives the accuracy of the calculation within this solution.[4] A geometry optimisation varies the structure of the molecule until it finds one which is a stationary point in respect to the energy, hence it can be called the equilibrium structure. The equilibrium geometry is stable if it is determined to lie in an energy minimum. The frequency analysis calculates the second derivative of the energy, from which the frequencies follow. If the frequencies are positive, it shows that the optimised geometry is stable. Changing either the method or basis set will change the calculated energies. Subsequently, what has previously been found to be an equilibrium structure will not be stationary in respect to the energy anymore under the new conditions. Therefore it is important to use the same method and basis set throughout both calculation.
What do the Low ferquencies represent?
The low frequencies are the molecular translational and rotational degrees of freedom. These should be within plus or minus 15 cm-1. If the first 6 low frequencies are within this range, it means the optimisation is successful and the frequencies analysis has identified the vibrational frequencies.
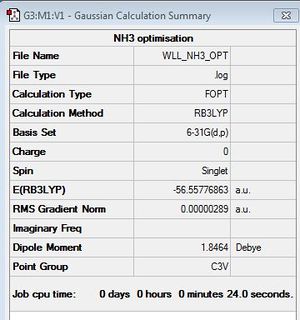
NH3
B3LYP/6-31G(d,p)
Optimisation log file here
| summary data | convergence | Jmol | |||
|---|---|---|---|---|---|
|
        Item               Value     Threshold  Converged?
 Maximum Force            0.000005     0.000450     YES
 RMS     Force            0.000003     0.000300     YES
 Maximum Displacement     0.000011     0.001800     YES
 RMS     Displacement     0.000006     0.001200     YES
 Predicted change in Energy=-8.407566D-11
 Optimization completed.
    -- Stationary point found.
|
|
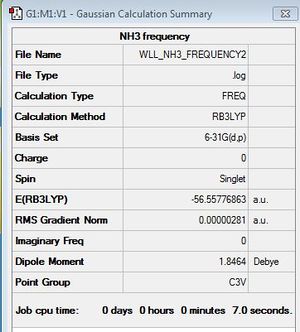
Frequency Analysis
B3LYP/6-31G (d,p)
Frequency file: here
| summary data | low modes |
|---|---|
|
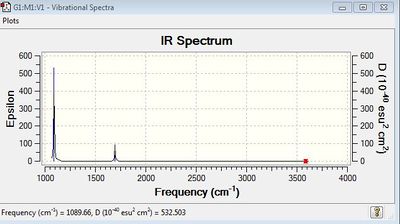
Low frequencies --- -11.6223 -11.5869 -0.0037 0.0243 0.1403 25.5604 Low frequencies --- 1089.6629 1694.1734 1694.1737 |
Vibrational spectrum for NH3
| wavenumber | Intensity | IR active? | type |
| 1694 | 14 | Very slightly | Bend |
| 1694 | 14 | Very Slightly | Bend |
| 1090 | 145 | Yes | Bend |
| 3461 | 1 | No | Stretch |
| 3590 | 0 | No | Stretch |
| 3590 | 0 | No | Stretch |
Molecular Orbitals Analysis of NH3
B3LYP/6-31G (d,p)
Molecular orbital analysis file: DOI:10042/31193
Natural Bond Orbital (NBO) Analysis of NH3
| Charge Distribution in NH3 (Charge range: -1.0 to + 1.0) | NBO Charge |
|---|---|
 |

N:-1.125, H: 0.375 |
NH3BH3
B3LYP/6-31G(d,p)
First Optimisation log file here
| summary data | convergence | Jmol | |||
|---|---|---|---|---|---|

|
          Item               Value     Threshold  Converged?
 Maximum Force            0.000121     0.000450     YES
 RMS     Force            0.000057     0.000300     YES
 Maximum Displacement     0.000501     0.001800     YES
 RMS     Displacement     0.000293     0.001200     YES
 Predicted change in Energy=-1.604969D-07
 Optimization completed.
    -- Stationary point found.
|
|
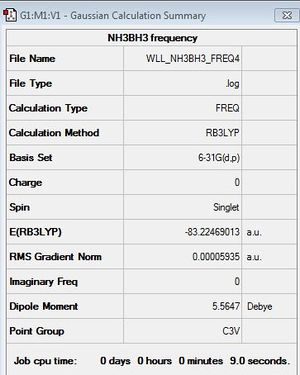
First Frequency Analysis
B3LYP/6-31G (d,p)
First Frequency File: here
| summary data | low modes |
|---|---|
|
Low frequencies --- -0.0617 -0.0459 -0.0067 21.6217 21.6277 40.3194 Low frequencies --- 265.9418 632.2366 640.0660 |
Second Optimisation of the Frequency Analysis File
B3LYP/6-31G(d,p)
A second optimisation was carried out as some of the frequencies are not within plus/minus 15 cm-1.
Second Optimisation log file here
Second Frequency Analysis after the Second Optimisation
B3LYP/6-31G (d,p)
Second Frequency File: here
| summary data | low modes |
|---|---|

|
Low frequencies --- -5.5674 -0.5366 -0.1252 -0.0015 0.4316 0.7435 Low frequencies --- 263.2874 632.9586 638.4525 |
Vibrational spectrum for NH3BH3
| wavenumber | Intensity | IR active? | type |
| 263 | 0 | No | Bend |
| 633 | 14 | Very Slightly | Stretch |
| 638 | 4 | No | Bend |
| 638 | 4 | No | Bend |
| 1069 | 41 | Yes | Bend |
| 1069 | 41 | Yes | Bend |
| 1196 | 109 | Yes | Bend |
| 1204 | 3 | No | Bend |
| 1204 | 3 | No | Bend |
| 1329 | 114 | Yes | Bend |
| 1676 | 28 | Yes | Bend |
| 1676 | 28 | Yes | Bend |
| 2472 | 67 | Yes | Stretch |
| 2532 | 231 | Yes | Stretch |
| 2532 | 231 | Yes | Stretch |
| 3464 | 3 | No | Stretch |
| 3581 | 28 | Yes | Stretch |
| 3581 | 28 | Yes | Stretch |
Energy Difference
| BH3 | NH3 | NH3BH3 | |
|---|---|---|---|
| Total energy (a.u.) | -26.6153236 | -56.5577686 | -83.2246891 |
ΔE=E(NH3BH3)-[E(NH3)+E(BH3)]
= -83.2246891 au - {-26.6153236 au + (-56.5577686 au)}
= -83.2246891 au - (-83.1730922 au)
= -0.0515969 au
= -135.46 kJ/mol
A dative bond is formed in which the lone pair on N donates to the vacant 2p orbital of B. The bond energy of B-N bond is only -135.46 kJ/mol. This value indicates that B-N bond is a weak bond.
Mini Project - Aromaticity
Benzene
Optimisation of Benzene
B3LYP/6-31G (d,p)
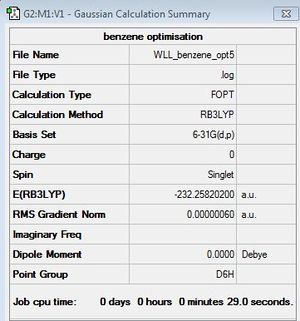
Optimisation log file here
| summary data | convergence | Jmol | |||
|---|---|---|---|---|---|
|
         Item               Value     Threshold  Converged?
 Maximum Force            0.000001     0.000015     YES
 RMS     Force            0.000000     0.000010     YES
 Maximum Displacement     0.000002     0.000060     YES
 RMS     Displacement     0.000001     0.000040     YES
 Predicted change in Energy=-6.700810D-12
 Optimization completed.
    -- Stationary point found.
|
|
Frequency Analysis
B3LYP/6-31G (d,p)
First Frequency File: here
| summary data | low modes |
|---|---|

|
Low frequencies --- -10.2549 -5.6651 -5.6651 -0.0055 -0.0055 0.0002 Low frequencies --- 414.5451 414.5451 621.0429 |

Molecular Orbitals of Benzene
B3LYP/6-31G (d,p)
Molecular orbital analysis file: DOI:10042/31268

Natural Bond Orbital (NBO) Analysis of Benzene
| Charge Distribution in Benzene (Charge range: -0.239 to + 0.239) | NBO Charge |
|---|---|
 |
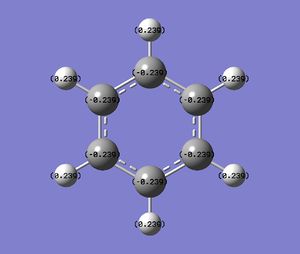
C: -0.239, H:0.239 |
Boratabenzene
Optimisation of Boratabenzene
B3LYP/6-31G (d,p), Charge: -1, Spin:Singlet
Optimisation log file here
| summary data | convergence | Jmol | |||
|---|---|---|---|---|---|

|
          Item               Value     Threshold  Converged?
 Maximum Force            0.000003     0.000015     YES
 RMS     Force            0.000001     0.000010     YES
 Maximum Displacement     0.000008     0.000060     YES
 RMS     Displacement     0.000002     0.000040     YES
 Predicted change in Energy=-7.469038D-11
 Optimization completed.
    -- Stationary point found.
|
|
Frequency Analysis
B3LYP/6-31G (d,p)
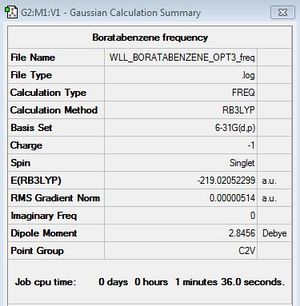
First Frequency File: here
| summary data | low modes |
|---|---|
|
Low frequencies --- -7.2680 0.0007 0.0010 0.0011 3.1395 4.5361 Low frequencies --- 371.2965 404.4163 565.0828 |

Molecular Orbitals of Boratabenzene
B3LYP/6-31G (d,p)
Molecular orbital analysis file: here
Natural Bond Orbital (NBO) Analysis of Boratabenzene
| Charge Distribution in Boratabenzene (Charge range: -0.588 to + 0.588) | NBO Charge |
|---|---|
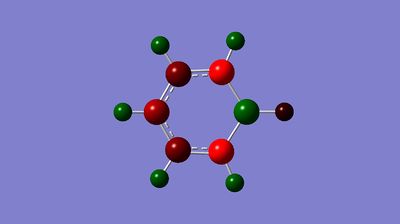 |
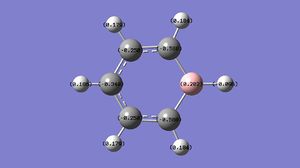
C: -0.340, -0.250, -0.588 H: 0.096, 0.179, 0.184, 0.186 B: 0.202 |
Pyridinium
Optimisation of Pyridinium
B3LYP/6-31G (d,p), Charge: +1, Spin:Singlet
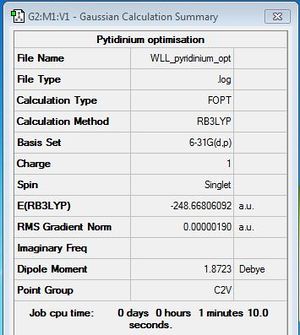
Optimisation log file here
| summary data | convergence | Jmol | |||
|---|---|---|---|---|---|
|
         Item               Value     Threshold  Converged?
 Maximum Force            0.000003     0.000015     YES
 RMS     Force            0.000001     0.000010     YES
 Maximum Displacement     0.000008     0.000060     YES
 RMS     Displacement     0.000002     0.000040     YES
 Predicted change in Energy=-7.469038D-11
 Optimization completed.
    -- Stationary point found.
|
|
Frequency Analysis
B3LYP/6-31G (d,p)
First Frequency File: here
| summary data | low modes |
|---|---|
|
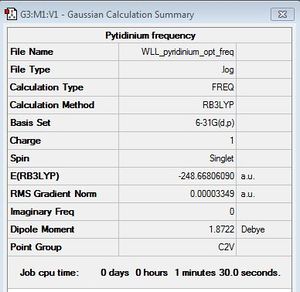
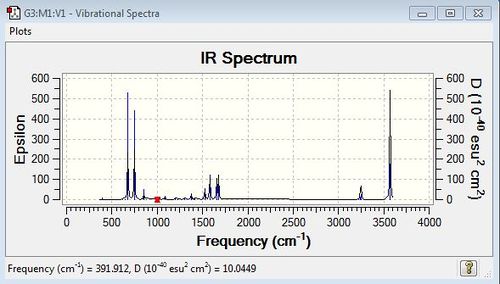
Low frequencies --- -9.8450 -4.7891 -1.5927 -0.0008 -0.0004 -0.0003 Low frequencies --- 391.9124 404.2914 620.2237 |
Molecular Orbitals of Pyridinium
B3LYP/6-31G (d,p)
Molecular orbital analysis file: here
Natural Bond Orbital (NBO) Analysis of Pyridinium
| Charge Distribution in Pyridinium (Charge range: -0.483 to + 0.483) | NBO Charge |
|---|---|
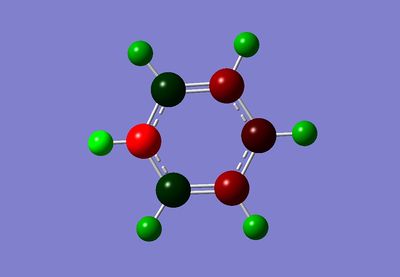 |
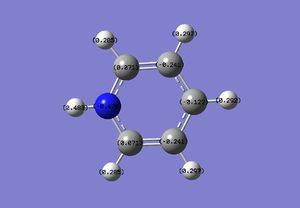
C: 0.071, -0.122, -0.241 H: 0.483, 0.297, 0.292, 0.285 N: -0.476 |
Borazine
Optimisation of Borazine
B3LYP/6-31G (d,p)
Optimisation log file here
| summary data | convergence | Jmol | |||
|---|---|---|---|---|---|

|
         Item               Value     Threshold  Converged?
 Maximum Force            0.000010     0.000015     YES
 RMS     Force            0.000005     0.000010     YES
 Maximum Displacement     0.000056     0.000060     YES
 RMS     Displacement     0.000018     0.000040     YES
 Predicted change in Energy=-3.017480D-09
 Optimization completed.
    -- Stationary point found.
|
|
Frequency Analysis
B3LYP/6-31G (d,p)
First Frequency File: here
| summary data | low modes |
|---|---|
|
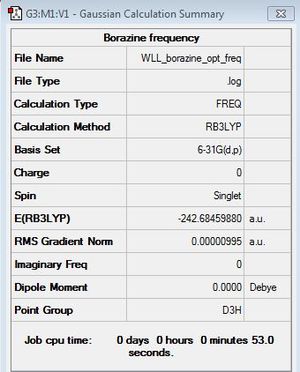
Low frequencies --- -5.9939 -4.9836 -4.9816 -0.0037 0.0084 0.0192 Low frequencies --- 289.7319 289.7327 404.5383 |

Molecular Orbitals of Borazine
B3LYP/6-31G (d,p)
Molecular orbital analysis file: here
Natural Bond Orbital (NBO) Analysis of Borazine
| Charge Distribution in Borazine (Charge range: -1.102 to + 1.102) | NBO Charge |
|---|---|
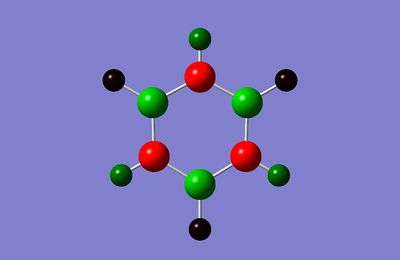 |
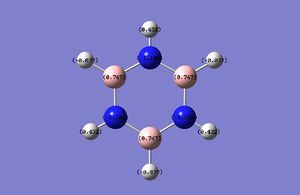
B: 0.747 N: -1.102 H: 0.432, -0.077 |
Compare and Contrast
Molecular orbitals
How do these MOs relate to the common conception of aromaticity?
To discuss about aromaticity, the π electrons are the focus of this subject. Compounds that exhibit aromaticity have cyclic electron delocalization.[5] This may result in equal bond length, special chemical and physical properties and energetic stabilization.[5] The Hückel’s rule[6] is the empirical rule of aromaticity. For planar compounds that have a contiguous, cyclic array of p-orbitals perpendicular to plane of ring, those with 4n+2 electrons (where n is an integer or zero) are aromatics. Those with 4n p electrons are anti-aormatics. Benzene, boratabenzene and pyridinium fulfil the Hückel’s rule and have 4n+2 π electrons. Although borazine is isoelectronic with benzene, it is not aromatic. This is because the π electrons are largely localised on the nitrogen atoms.
In the MO theory, the linear combination of atomic orbitals (LCAO) approximation applies. For n AOs, that combine, it creates n MOs. In benzene, the sp2 hybridised carbons form the σ framework. The remaining 2p orbitals lie orthogonal to the plane of the molecule and each of them contribute a π electron. These orbitals overlap to form a conjugated molecular orbital system.[7] The six 2p atomic orbitals combine to give six molecular orbitals, three bonding orbitals and three anti-bonding orbitals. The π electrons fill the bonding orbitals according to aufbau principle. In boratabenzene and pyridinium, the same theory applies. They are both planar molecule with sp2 hybridised carbons forming the σ framework. The degenerate bonding orbitals in the π system are no longer degenerate. The boron and nitrogen having different electronegativity to carbon and hence breaking the symmetry.
The MO theory gives a relatively good explaination of aromaticity but the main difference is that in aromaticity, the electrons are delocalised above and below the plane of the molecule It is the delocalisation that gives the thermodynamic stablility of aromatic molecule. However, the MO diagram of benzene above has shown that each MO can hold only two electrons which implies localisation of electrons.
Compare and contrast the MOs of benzene with those of the analogues.
| Benzene | Boratabenzene | Pyridinium | Borazine | |
|---|---|---|---|---|
| Fully bonding π MOs | 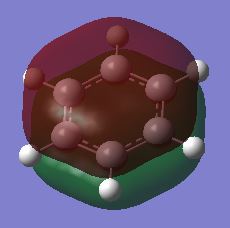
|
|

|
|
| Energy of π MOs/ a.u. | -0.3599500 | -0.1321000 | -0.6406200 | -0.3613300 |
| σ MOs 1 | 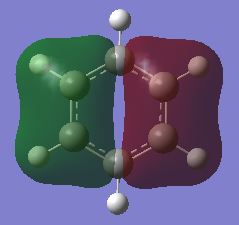
|

|

|

|
| Energy of σ MOs 1/ a.u. | -0.7400000 | -0.5195400 | -1.0263100 | -0.8351600 |
| σ MOs 2 | 
|
|

|

|
| Energy of σ MOs 2/ a.u. | -0.7400000 | -0.4608300 | -0.9932100 | -0.8351600 |
Present a comparison across the series for benzene, boratabenzne, pyridinium and borazine for each MO. What effect do these substitutions have on the MOs? Discuss the effect these substitutions would have on the full MO diagram (you do not need to construct the diagrams)
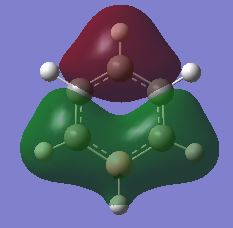
In benzene, the σ MOs are degenerate and have the same energy. These MOs become non-degenerate in boratabenzene and pyridinium. The substitution of boron and nitrogen causes a decrease in symmetry therefore the σ MOs are now non-degenerate. Borazine is a symmetrical molecule so the σ MOs are degenerate.
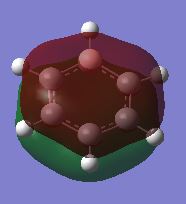
In boratabenzene, the fully bonding π MO and the first σ MO look almost identical to the benzene ones. The LCAOs contributing to the fully bonding π MOs and the first σ MO are the same for both boratabenzene and benzene. In the full bonding π MOs of benzene, the p orbitals of carbon are all the same size and they interact strongly with each other. This stabilises the energy level. The difference in appearance becomes apparent if we compare the second σ MO of boratabenzene and benzene. In benzene, this σ MO is made up of s orbitals only. In contrast, two carbon atoms contribute two p orbitals instead of s orbitals to make up this MO. Moreover, two hydrogen atoms are not contributing to the σ MO. Unlike benzene, the two σ MOs are non-degenerate. This is due to the replacement of carbon atom by a boron atom which changes the symmetry in the molecule. The p orbitals overlap of boron and carbon is not as efficient as the overlap of p-orbitals in benzene because the p orbital of boron is larger than carbon. Although both σ MOs in boratabenzene have one nodal plane, the distribution of electron density around the molecule is more uneven in the second σ MO. Therefore the second σ MO is higher in energy than the other σ MO. Overall, the weaker overlap of orbitals results in a rise in energy therefore the MOs of boratabenzene generally all have a higher energy than that of benzene.
For pyridinium, the electronegative nitrogen atoms means that the atomic orbitals will be lower in energy and hence the molecular orbitals. The nitrogen will also contribute more to the lower energy MOs. The fully bonding π MO of pyridinium is very similar to benzene with electron density delocalised above and below the plane of the molecule. Again, the two σ MOs are non-degenerate which differs from benzene. This is due to the replacement of carbon atom by a nitrogen atom which changes the symmetry in the molecule. In the first σ MO of pyridinium, two carbon atoms contribute two p orbitals instead of s orbitals to make up the σ MOs and two hydrogen atoms are not contributing to the σ MO. The p orbitals overlap of nitrogen and carbon is weaker than the overlap of p-orbitals in benzene because the p orbital of nitrogen is smaller than carbon. Overall, the weaker overlap of orbitals may results in a rise in energy but the fact that nitrogen is more electronegative than carbon, it cause a reduce in energy. Therefore the MOs of pyridinium generally all have a lower energy than that of benzene.
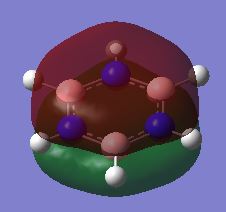
The energy of the MOs of benzene is similar to borazine. The energy level of borazine MOs are only slightly lower than that of benzene. In borazine, the full bonding π MO is similar in appearance to benzene. Although the two σ MOs are degenerate, the electrons does not distribute in the same way as the σ MOs in benzene. In the first σ MO, one of the nitrogen and four of the hydrogen atoms are not contributing to the MO. This is different from the benzene which only has two hydrogen atoms not being involved. Nitrogen is more electronegative than boron so the atomic orbitals of nitrogen will be lower than boron. This means there is a larger splitting between energy level. The size difference between the p orbital of nitrogen and boron results in weaker overlap may also contribute to this. The energy of MOs of borazine are generally slightly lower than that of benzene.
Overall, the substitutions of the carbons can remove degeneracy of orbitals and the substituents can also affect the energy levels of the molecular orbitals. For example, the weaker overlap of orbitals between boron and carbon, plus the fact that boron is more electropositive than carbon, these cause an increase in energy level. However, the MO diagrams of all four molecules would be very similar in terms of the basis layout.
Charge Distribution
| Benzene | Boratabenzene | Pyridinium | Borazine | |
|---|---|---|---|---|
| NBO Charge distribution | 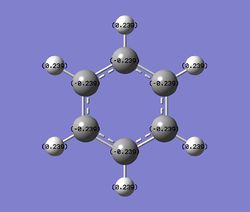
C: -0.239, H:0.239
|
C: -0.340, -0.250, -0.588 H: 0.096, 0.179, 0.184, 0.186 B: 0.202 |

C: 0.071, -0.122, -0.241 H: 0.483, 0.297, 0.292, 0.285 N: -0.476 |

B: 0.747 N: -1.102 H: 0.432, -0.077 |
| Dipole Moment (Debye) | 0.00 | 1.73 | 1.87 | 0.00 |
Benzene is a symmetrical molecule. The charge on each atom has the same magnitude. The C atom has a charge of -0.239 and the H atom has a charge of 0.239. The charges cancel out each other and hence benzene has a dipole moment of 0.00.
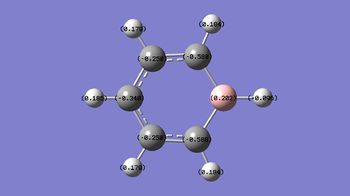
In boratabenzene, the H atoms have very similar charges apart from the one attaches to the B atom which is negatively charged and smaller in magnitude (-0.096). The closer the C atoms are from the B atom, the more negative the charges they have. In the following diagram, it shows the resonance form of boratabenzene. The negative charge delocalises around the molecule and lies on the C at ortho- and para- position to B. This explains why the C atoms in boratabenzene have a more negative charge than those in benzene. This also explains why the C atoms at othro- and para- position are more negative than the C at meta- position. Moreover, since the negative charge doesn’t lie on the B atom, the B atom is still electron deficient due to the vacant p orbital, hence it has a positive charge.

For pyridinium, all H atoms except the one next to the N atom have very similar charges. The H atom attaches to N has a charge of 0.483. The closer the C atoms from the N atom, the more positive the charges are. Nitrogen is more electronegative than carbon and hydrogen therefore it tends to attract electron density from neighbouring atoms, causing these atoms to become more positively charged. The charges on C atoms in pyridinium are more positive than those in benzene. This is due to the resonance form of pyridinium in which the positive charge is delocalised on the ortho- and para- position to nitrogen.

Borazine is isoelectronic to benzene. For borazine, all boron atoms have the same charge and are the most positively charged atoms in the structure. The nitrogen atom are the most negatively charged atoms in the structure. The hydrogen atom attaches to the nitrogen are more positive than the ones attach to the boron. The boron atoms become more positively charged in borazine than in boratabenzene and the nitrogen atoms become more negatively charged in borazine than in pyridinium. These are due to the electronegative nitrogen atoms attracting the electron density from the adjacent hydrogen and boron atoms.
Benzene and borazine are both symmetrical molecules, therefore all charges are balanced and they have a zero dipole moment. Boratabenzene has similar dioploe moment compared to pyridinium. This is due to the replacement of C by B and N which changes the symmetry of the molecule.
Reference
- ↑ Shriver & Atkins', Inorganic Chemistry, Oxford University Press, 5th edn., 2010, pp. 2-3
- ↑ P. Atkins, J. De Paula, Atkins' Physical Chemistry, Oxford University Press, 9th edn., 2010
- ↑ 3.0 3.1 3.2 Shriver & Atkins', Inorganic Chemistry, Oxford University Press, 5th edn., 2010,ch. 2, pp. 603
- ↑ The Hunt Research Group website, http://www.huntresearchgroup.org.uk/teaching/year3_lab_start.html, (accessed October 2014)
- ↑ 5.0 5.1 P. Rague von Schleyer, H. Jiao, Pure Appl. Chem., 1996, Vol. 68, No. 2, pp. 209-218, DOI: http://dx.doi.org/10.1351/pac199668020209
- ↑ J. A. Berson, Chem. Int. Ed. Engl., 1996, Vol. 35, 23-34, pp. 2750-2764, DOI: 10.1002/anie.199627501
- ↑ J. A. Joule, K. Mills, Heterocyclic Chemistry, Wiley-Blackwell, 5th edn., 2010, ch. 2


