
Rep:Mod:LTphys
The Cope Rearrangement
In this part of the module, the Cope rearrangement reaction of 1,5-hexadiene was studied to locate the low-energy minima as well as the transition structure, in order to find the preferred reaction mechanism. This well-studied rearrangement is classed as a [3,3]-sigmatropic rearrangement and is illustrated in scheme 1 below. Although in the past the exact mechanism of the rearrangement led to some controversy, it is now generally accepted that the reaction occurs via either a chair or boat transition in a concerted fashion. Many studies have been carried out to investigate the mechanism, such as the studies undertaken by Roth et al and Staroverov et al. [1]
[2]

Optimizing reactants and products
Anti vs Gauche Conformers
A molecule of 1,5-hexadiene was drawn in GaussView with an approximate "anti" linkage between the central carbon atoms. The structure was then optimized at the HF/3-21G level of theory (see log file of optimization here). Similarly, the "gauche" conformer was drawn and also optimized under the same conditions (see log file of optimization here). Illustrations of both of the optimized structures are shown in figure 1. The results of these initial optimization can be seen in table 1. By comparing the total energy to the conformers reported in Appendix 1 it is clear that the conformers drawn correspond to anti 2 and gauche 2 respectively. Based on the results, it would be assumed that because the anti conformer is marginally lower in energy compared to gauche, that the anti conformer should be the lowest energy conformer of 1,5-hexadiene. This hypothesis agrees with what is expected as the anti-periplanar arrangement should experience less steric hinderance than the gauche. However there is very little difference between the energy of the conformers and so I would predict that the energy difference is due to relative orbital overlap.
| Property | Anti | Gauche |
|---|---|---|
| File name | react_anti | react_gauche |
| File Type | .chk | .chk |
| Calculation Type | FOPT | FOPT |
| Calculation Method | RHF | RHF |
| Basis Set | 3-21G | 3-21G |
| Charge | 0 | 0 |
| Spin | Singlet | Singlet |
| Total Energy (a.u.) | -231.69253528 | -231.69166700 |
| RMS Gradient Norm (a.u.) | 0.00001891 | 0.00001897 |
| Imaginary Freq | ||
| Dipole Moment (Debye) | 0.0000 | 0.3806 |
| Point Group | Ci | C2 |
After comparing the structures and energies of the conformers I had simulated to those in Appendix 1 it was clear that I had not simulated the lowest energy conformer of 1,5-hexadiene which appeared to be gauche 3. This is may be due to the conformer benefiting from additional σC-H/σ*C-H, σC-C/σ*C-H or σC-H/σ*C-C interactions leading to a lower energy. Alternatively, and probably the more logical reason for the gauche 3 conformer being the most stable is because the gauche conformer has favourable H...H contacts which are not present in the anti conformer and hence the van der Waals energy slightly favours this conformer.
|
|
|
|
| Anti 2 | Gauche 2 | Gauche 3 |


Analysis of Anti 2 Conformer
Further simulations were then carried out with the anti 2 conformer with Ci symmetry. After initially optimizing under the HF/3-21G level of theory, the structure was then re-optimize under the B3LYP/6-31G* level. This then allowed the optimized structure from the previous HF/3-21G optimization to be compared to one optimized at a higher level of theory (see log file here). Table 2 summarizes the results from the two optimizations. There appears to be only minor differences in the geometry of the two optimized structures in terms of bond lengths and bond angles. The anti 2 conformer which was optimized under HF/3-21G appears to have slightly shorter terminal C=C bonds, but longer central C-C bonds in comparison to the structure optimized under B3LYP/6-31G*. Similarly bond angles between the two molecules were very alike and differences are <2o and so are negligible. Although a fairly significant difference can be seen in the total energy values, this data cannot be directly compared due to the optimizations being carried out with different basis sets. Hence, overall it can be concluded that the geometry of the anti 2 conformer changes very little under HF/3-21G and B3LYP/6-31G* level of theory.
| Optimization theory | Total energy (hartrees) | C1-C2/C5-C6 distance (Å) | C2-C3/C4-C5 distance (Å) | C3-C4 distance (Å) | C1-C2-C3 bond angle | C2-C3-C4 bond angle |
|---|---|---|---|---|---|---|
| HF/3-21G | -231.6925353 | 1.31613 | 1.50891 | 1.55275 | 124.80575o | 111.34878o |
| B3LYP-6-31G | -234.6117028 | 1.33352 | 1.50419 | 1.54814 | 125.28669o | 112.67205o |
A frequency calculation was then carried out on the B3LYP/6-31G* optimized anti 2 conformer. This additional calculation is required so that the energies values simulated could be compared to experimental values. The frequency calculations also allows us to check that there are no imaginary vibrational frequencies thus confirming that the critical point is in fact a minimum as opposed to a maximum ( see log file here). The computer generated IR spectrum can be seen here.
| Type of Energy | Equation | Value (hartrees) |
|---|---|---|
| Sum of electronic and zero-point Energies a | E = Eelec + ZPE | -234.469204 |
| Sum of electronic and thermal Energies b | E = E + Evib + Erot + Etrans | -234.461857 |
| Sum of electronic and thermal Enthalpies c | H = E + RT | -234.460913 |
| Sum of electronic and thermal Free Energies d | G = H - TS | -234.500778 |
- a potential energy at 0 K including the zero-point vibrational energy
- b energy at 298.15 K and 1 atm of pressure which includes contributions from the translational, rotational, and vibrational energy modes
- c contains an additional correction for RT
- d includes the entropic contribution to the free energy
Optimizing "Chair" and "Boat" Transition Structures
In this section the two possible transition structure were investigated and optimized through the use of force constants, the redundant coordinator editor and QST2. Simulations were also carried out to visualize the reaction coordinate and run an Intrinsic Reaction Coordinate (IRC). The activation energies for the Cope rearrangement via the "chair" and "boat" transition states were then calculated. Both of chair and boat transition structures consist of two allyl groups with C2h and C2v symmetry respectively. Firstly, an allyl fragment (CH2CHCH2) was optimized under the HF/3-21G theory. This resulted in a total energy of -115.8230 hartrees and a point group of C2v (log file of optimization can be seen here).
Chair Transition Structure
The chair transition structure was then drawn as shown in figure 2 ensuring the two terminal ends of the allyl fragments were approximately 2.20 Å apart. This structure was then optimized using two different methods both under the HF/3-21G level of theory. In the first of the two methods, the predicted chair transition state went under a optimization + frequency calculation and the force constants calculated once. Instead of optimizing to a minimum as the other simulations were, this optimization was to a TS (Berny). This calculation resulted in an imaginary vibrational frequency of -817.99 cm-1 which when animated, clearly shows the bond breaking and forming between the two terminal ends of the allyl fragments as would be expected in the Cope rearrangement, this can be seen here. Log file for the TS (Berny) optimization can be seen here.
|
|
|
| Chair | Boat |


For the second method, the chair conformation was optimized using the frozen coordinate method which utilizes the Redundant Coordinate Editor in GaussView. The distances between the terminal ends of the allyl fragments were set to 2.20 Å apart then frozen before carrying out an optimization out to a minimum (log file here). The bonds which were frozen were then optimized too by taking the output checkpoint file of the previous job and editing the Redundant Coordinate Editor from "freeze" to "derivative". A transition state optimization was then carried out without measuring force constants (log file here). The second method of optimization yielded bond making/breaking bond lengths of 2.02068 and 2.020108 Å. In comparison, the first method of optimizing the transition state resulted in bond making/breaking bond lengths of 2.02035 and 2.02055 Å respectively. Therefore, there is very little difference between the final structures obtained from the two methods mentioned.
Boat Transition Structure
The boat transition structure of 1,5-hexadiene was then studied using the QST2 method. This method allows you to specify the reactant and product molecules and the calculation will interpolate between the two structures to try to find the transition state of the reaction. The reactant and product molecules were drawn in GaussView and atoms were labelled as shown below in figure 3.
|
|
|
| Reactant | Product |


The QST2 calculation was then set up by altering the job type to Opt+Freq, changing the optimization to TS(QST2) and running under HF/3-21G level of theory. However, this calculation failed and resulted in a dissociated chair-like structure instead of the boat transition state we were hoping for. The resulting structure is shown in figure 4 (log file here). The reaction failed because when the calculation linearly interpolated between the two structures, it simply translated the top allyl fragment and did not even consider the possibility of a rotation around the central bonds. Hence it is clear that alternative reactant and product input structures are required in order to obtain the correct boat transition state. In order to modify the reactant and product molecules to appear more like the boat structure, the C2-C3-C4-C5 dihedral angle was altered to 0o and the C2-C3-C4 and C3-C4-C5 were both reduced to 100o. This led to the structures of the reactant and product to appear as shown below in figure 5. The QST2 calculation was then set up again, resulting in the correct boat transition structure illustrated in figure 2. The boat transition structure has one imaginary vibrational frequency at -839.94 cm-1 which corresponds to the bond making/breaking expected in the Cope rearrangement(log file here). The animation of this frequency can be seen here.
|
|
|
| Reactant | Product |


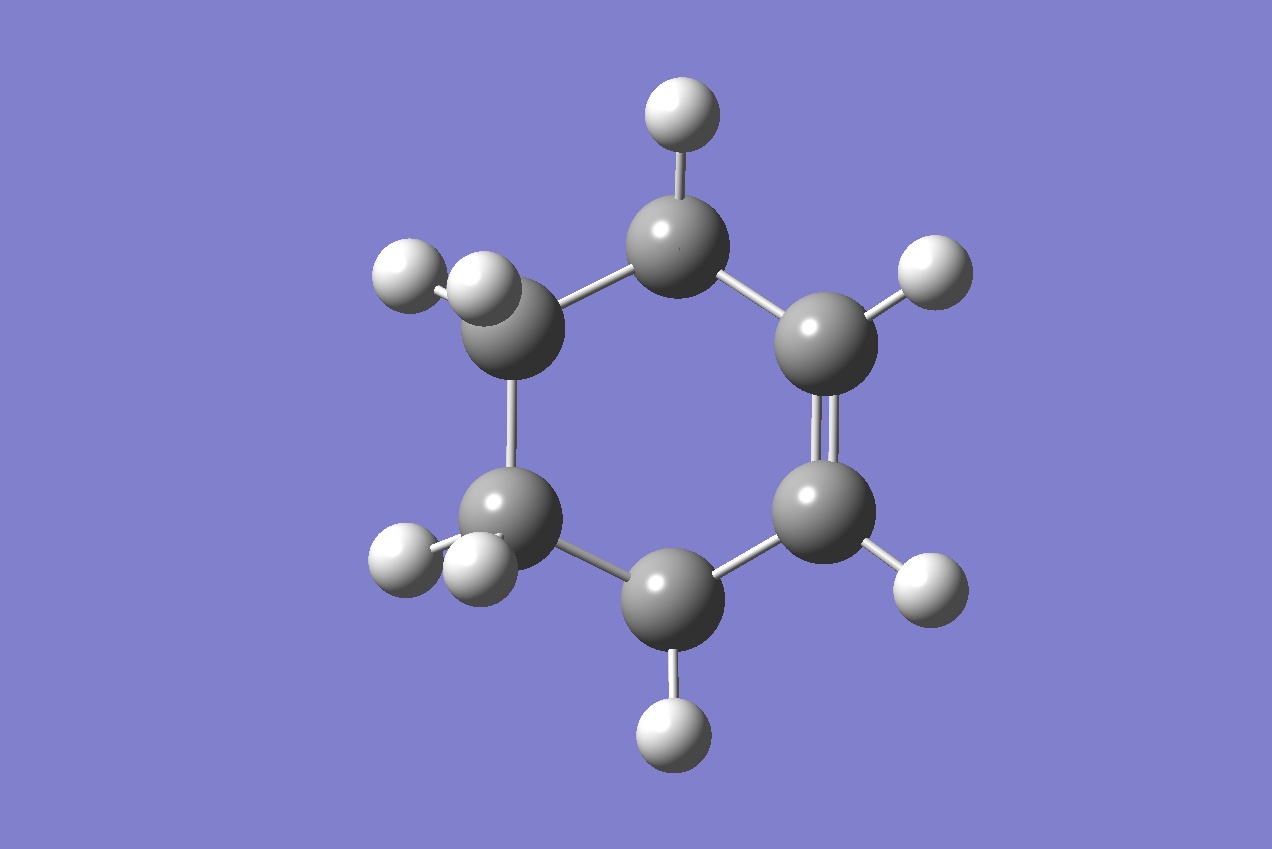
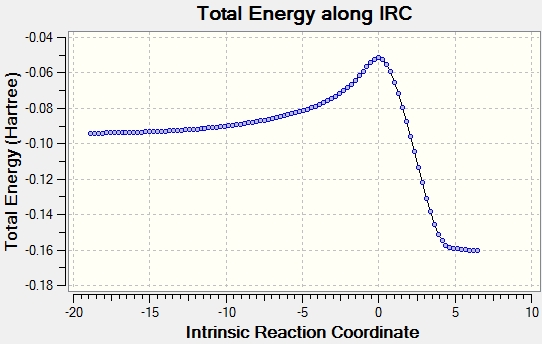
Intrinsic Reaction Coordinate (IRC)
IRC allows you to follow the minimum energy path from a transition structure down to its local minimum on a potential energy surface.Using the optimized chair transition structure produced previously, the IRC calculation was set up in Gaussian. As the reaction coordinated is symmetrical, the direction of reaction was only carried out in the forward direction. The parameters were altered so that the force constants were calculated always and the number of points measured along the IRC was modified to 50. The results from this IRC calculation is shown below in figure 6. The log file (see here) indicates that the calculation ended after 44 measurements instead of 50 resulting in a geometry that is close to the minimum. In order to reach the minimum geometry, the IRC was repeated specifying 100 points along the IRC instead of 50 however, the results were consist with those obtained previously. The structure of the final IRC is comparable to gauche 2 in Appendix 1 however the energies of the two geometries differ slightly. The energy of the final point in the IRC was -231.69158 hartrees in comparison to the energy of gauche 2 which is -231.69167 hartrees.
|
|

In a second attempt to reach the minimum, a HF/3-21G optimization was carried out in Gaussian. The geometry was optimized to match the gauche 2 conformer and had a total energy of -213.69167 hartrees (log file here). An illustration of the optimized structure from the IRC is shown below in figure 7.
|
|

The same method was then used to perform a IRC calculation on the boat transition structure (log file here). The resultant total Energy and RMS gradient norm plots along IRC were very similar to that produced by the chair transition structure and can be viewed here. However, the minimum geometry produced bears no resemblance to any of the conformers reported in Appendix 1 and its energy of -231.68298 hartrees is significantly higher than any of the other conformers. Hence, it could be concluded that the Cope rearrangement proceeds via the Chair transition structure resulting in the gauche 2 conformer.
Activation Energies
The activation energies were calculated by re-optimizing the HF/3-21G optimized chair and boat transition structures under a B3LYP/6-321G* and carrying out frequency calculations. A summary of all of the optimization for both HF/3-21G and B3LYP/6-21G* can be seen below in table 4. In order to find the activation energy of each of the transition structures at both 0 K and 298.15 K the energies were compared to those computed for reactant anti 2. The energy difference between the reactant and the transition structure is the activation energy, this was then converted from hartree to kcal/mol and the values are summarized in table 5.
Overall the data suggests that the Cope rearrangements proceeds via the chair transition structure which has a considerably lower activation energy in comparison to the boat transition structure. In addition, we can see that the ΔE(chair) is in good agreement with the experimentally determined value. In contrast, the ΔE(boat) differs from the experimental value by around 1.38 kcal/mol.
Table 4: Summary of reactant and transition state energies
| HF/3-21G | B3LYP/6-31G* | |||||
|---|---|---|---|---|---|---|
| Electronic energy (hartrees) | Sum of electronic and zero-point energies (hartrees) | Sum of electronic and thermal energies (hartrees) | Electronic energy (hartrees) | Sum of electronic and zero-point energies (hartrees) | Sum of electronic and thermal energies (hartrees) | |
| at 0 K | at 298.15 K | at 0 K | at 298.15 K | |||
| Chair TS | -231.619322 | -231.466700 | -231.461341 | -234.556984 | -234.414932 | -234.409012 |
| Boat TS | -231.602802 | -231.450928 | -231.445299 | -234.543093 | -234.402342 | -234.396007 |
| Reactant (anti2) | -231.692535 | -231.539539 | -231.532565 | -234.611710 | -234.469204 | -234.461857 |
- NB: 1 hartree = 627.509 kcal/mol
Table 5: Summary of activation energies (in kcal/mol)
| HF/3-21G | HF/3-21G | B3LYP/6-31G* | B3LYP/6-31G* | Expt.[3] | |
| at 0 K | at 298.15 K | at 0 K | at 298.15 K | at 0 K | |
| ΔE (Chair) | 45.71 | 44.69 | 34.06 | 33.16 | 33.5 ± 0.5 |
| ΔE (Boat) | 55.60 | 54.76 | 41.96 | 41.32 | 44.7 ± 2.0 |
The Diels Alder Cycloaddition
In this part of the project, the nature of the transition state and regioselectivity in the Diels-Alder reaction were studied. The Diels-Alder reaction occurs between the π orbitals of a diene and dienophile to form new σ bonds. In this particular study we will focus on the reaction between butadiene and ethylene. The Diels-Alder reaction is classed as a cycloaddition pericyclic reaction which is thought to occur in a concerted stereospecific fashion. In general, if the HOMO of one reactant can interact with the LUMO of the other reactant (i.e. they are of the same symmetry and close in energy) then the reaction is allowed. However, if the orbitals have different symmetry properties then no overlap density is possible and the reaction is forbidden. Under thermal conditions, [4n+2] aromatic systems such as that shown in scheme 2 are expected to proceed via the Hückel topology and suprafacial stereochemistry.

Butadiene and ethylene MO's
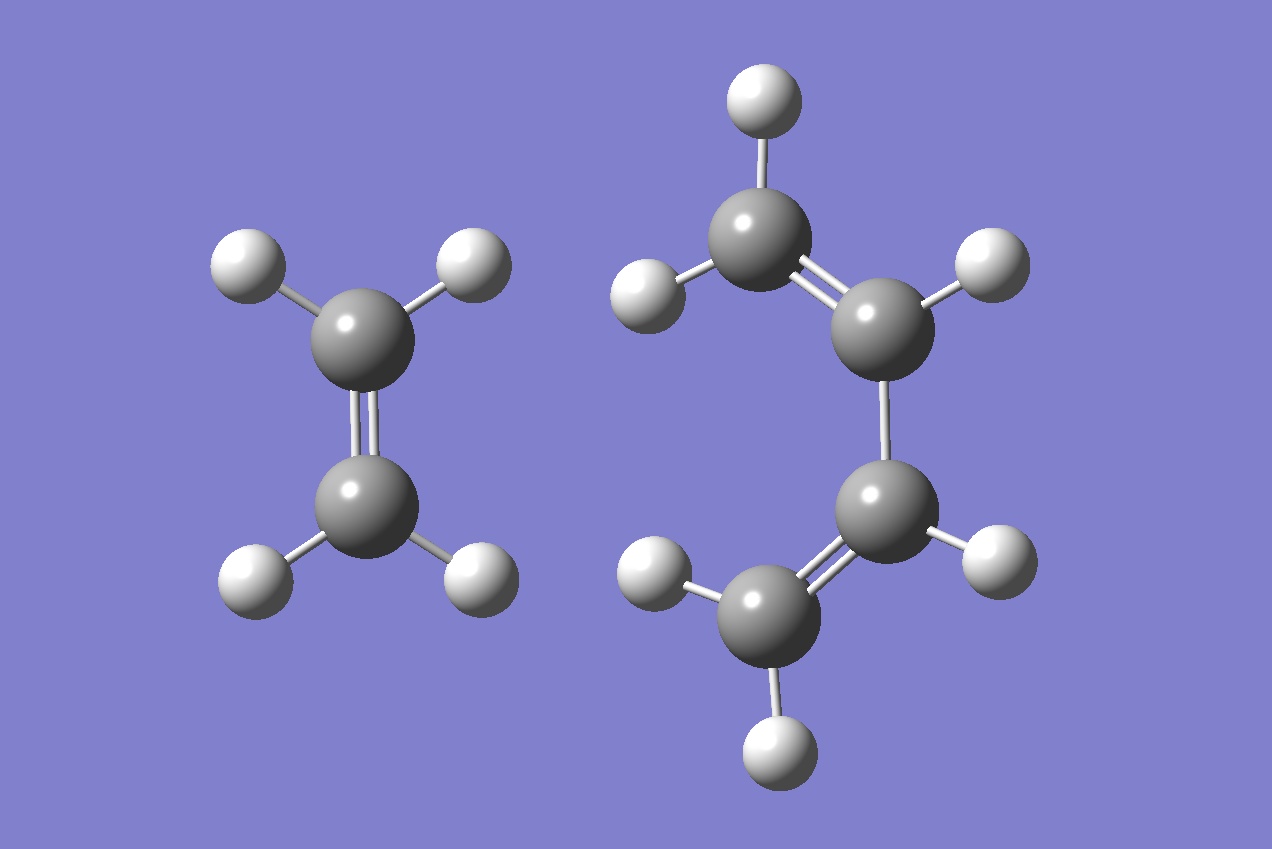
One of the reactants in the Diels-Alder reaction being studied is cis-butadiene. Using GaussView, the structure of cis-butadiene was drawn and optimized by HF/3-21G level of theory followed by semi-empirical AM1 theory. The total energy of the optimized structure was 0.04879721 a.u., the log file can be seen here. The optimized structure produced was completely planar with a dihedral angle of precisely 0o. The MOs for cis-butadiene were then simulated and the captures of the HOMO and LUMO are shown below in figure 8. It can be seen that the HOMO is anti-symmetric and the LUMO symmetric with respect to the plane.
|
|
|
| HOMO | LUMO |


For comparison, the structure of the dienophile ethylene was optimized by HF/3-21G level of theory followed by semi-empirical AM1 theory also. This led to a total energy of 0.02619024 a.u. and the corresponding log file can be seen here. The computed HOMO and LUMO can be viewed in figure 9. With respect to the plane, the HOMO is symmetric and the LUMO of ethylene is anti-symmetric. Hence, as the HOMO of ethylene and the LUMO of butadiene are both symmetric and the LUMO of ethylene and the HOMO of butadiene are both anti-symmetric, the interaction between ethylene and butadiene is energetically favourable.
|
|
|
| HOMO | LUMO |


Computation of the Transition State Geometry

In the previous section of the project, multiple methods were used to optimize the transition structure in the Cope rearrangement. One of these methods was then applied to the Diels-Alder reaction(scheme 2) in order to study the geometry of the transition structure. Firstly, a guess structure for the transition state was drawn in GaussView by initially drawing a bicyclo[2.2.2]octane and then removing the -CH2-CH2- fragment. The inter-fragment distance was estimated to be approximately 2.20 Å and the resultant structure can be seen below in figure 10. This guess structure was chosen as it maximizes the overlap between the ethylene π orbitals and the π system of butadiene.
Prior to optimization the bond distances between the ethylene and butadiene fragments were 2.19407 and 2.20 Å. The method which was chosen to optimized the transition structure involved carrying out a Opt+Freq calculation by optimizing to TS(berny) and measuring force constants once under semi-empirical AM1 level of theory. The additional key words Opt=NoEigen was also added to prevent the calculation crashing if more than one imaginary frequency is detected during the optimization. The log file of this calculation on Gaussian can be seen here. The resulting optimized transition structure had shorter bond distance between the two fragments of only 2.1129 Å. One imaginary frequency was found at -956.20 cm-1 which corresponds to the bond making/breaking of the two σ bonds at the same time. The animation of this frequency can be viewed here. Hence, the formation of the new σ C-C bonds must be synchronous, which is expected in a syn cycloaddition. In comparison, the lowest positive frequency occurs at 147.21 cm-1 and the animation of this frequency (here) clearly shows the asynchronous bond making of the σ bonds.
A carbon atom has a van der Waals radius of 170 pm. The typical sp3 C-C bond length is 1.53 Å and sp2 C=C bond is 1.33 Å [4] After optimizing the transition structure the partially formed σ C-C bonds were both 2.1129 Å in length, this would suggest that although the distance is too long to be classed as a single bond, there is some interaction between the two carbons as the distance is shorter than the vdw radii of the carbons.
The HOMO and LUMO of the ethylene and cis-butadiene transition structure are shown below in figure 10. It can be seen that the HOMO is anti-symmetric but the LUMO is symmetric with respect to the plane. This suggests that the HOMO of the TS is a resulting orbital from the interaction of the HOMO of cyclo-1,3-butadiene and the LUMO of ethylene. This reaction is allowed as the HOMO/LUMO orbitals interacting are of the same symmetry, in this case they are both anti-symmetric. Therefore, the LUMO of the TS must be the mixed orbital of the LUMO of cyclo-1,3-butadiene and the HOMO of ethylene. This reaction is also allowed as both orbitals are of the same symmetry.
|
|
|
| HOMO | LUMO |
In order to confirm that this transition structure corresponds to the Diels-Alder reaction shown in scheme 2, a IRC calculation was carried out on Gaussian. The calculation was set up so that the IRC was followed in both forward and reverse directions, the force constants measured always and the number of points was changed to 100 (log file here). The resultant IRC path can be seen below in figure 12. It can be seen that the reaction coordinate is exactly how we would expect it to look going from the reactant on the left hand side (shown here), via the optimized transition structure illustrated in figure 10, and down to the product on the right hand-side (shown here).
|
|

Regioselectivity of Diels-Alder Reaction

In this section, the effect of a substituted dienophile in a Diels-Alder reaction were studied. In particular, we will focus on the reaction shown in scheme 3 which will also us to investigate secondary orbital effects. Firstly reactants cyclo-1,3-hexadiene and maleic anhydride were drawn in GaussView and their geometries optimized to a minimum under AM1 level of theory (log files: cyclo-1,3-hexadiene and maleic anhydride). Next, the predicted transition structures for the endo and exo products ( 3 and 4) were drawn using the optimized reactants and setting the distance where the new σ bond will form to 2.2 Å. Each of the transition structures were then optimized using a Opt+Freq calculation in Gaussian, optimizing to TS(berny), measuring the force constants one and adding the additional key words Opt=NoEigen. The log files for these TS optimizations of the endo and exo can be seen here and here respectively. The two optimized transition structures can be seen below in figure 12.
|
|
|
| Exo TS | Endo TS |


The exo TS had a relative energy of -31.6389 kcal/mol with one imaginary frequency at -811.85 cm-1 which corresponds to the forming of the two σ bonds, the animation of this can be seen here. By comparison, the endo TS has a lower relative energy of -32.3197 kcal/mol with one imaginary frequency at -806.36 cm-1 which corresponds to the forming of the two σ bonds, the animation of this can be seen here. Hence because the endo TS is lower in energy than the exo, the endo product is kinetically favoured as the activation energy to the endo TS is lower.
After optimization, the forming σ C-C bonds in the exo TS were both 2.17 Å. The C-C through space distances between the -(C=O)-O-(C=O)- fragment of the maleic anhydride and the C atoms of the “opposite” -CH2-CH2- were then measured to be 2.945 Å. On the other hand for the endo TS, the forming σ C-C bonds were both 2.16 Å. Also, the C-C through space distances between the -(C=O)-O-(C=O)- fragment of the maleic anhydride and the “opposite” -CH=CH- were both 2.892 Å. Hence, there is slightly more steric repulsion in the endo TS so we would expect this to result in a higher energy. In reality, this steric repulsion is overcome by secondary orbital interactions between the π systems of -CH=CH- and -(C=O)-O-(C=O)- fragment which stabilize the endo TS. In addition, as the new partially formed bond is less than two van der Waals radii of a carbon atom we can conclude that there is an attractive interaction between the two fragments.
|
|
|
|
|
| Endo - HOMO | Endo - LUMO | Exo - HOMO | Exo - LUMO |


The relative HOMO and LUMO of the two transition states were plotted and are shown in figure 13. By comparison of the endo and exo HOMO between the -(C=O)-O-(C=O)- fragment and the remainder of the system it can be seen that in the endo TS there is attractive overlap between the π*-orbital of the C=O bond in maleic anhydride and the π-orbital of the C=C in cylco-1,3-hexadiene. This interaction is not present in the exo TS as the C=O are facing away from the C=C bond of the diene, hence no stabilisation.
Performing an IRC calculation, via the method described previously, allows the TS to be confirmed as the correct one for both endo and exo. For the endo transition structure the IRC was performed under AM1 level of theory throughout(see log file here). By computing the IRC we can clearly visualize the reactants cyclo-1,3-hexdiene and maleic anhydride on the left hand-side on the reaction coordinate, the activation to the endo transition state is 26.6986568 kcal/mol and then product 4 is formed on the right hand-side of the reaction coordinate. The IRC plot of total energy can be seen here. The same method was used to calculate the IRC of the exo product (see log file here).In this instance, the activation energy to the exo transition state was 27.3794790 kcal/mol, thus higher than that for the endo TS. The IRC plot of total energy can be seen here forming product 3. Overall, despite the exo product being thermodynamically more stable the endo product is favoured due to the secondary orbital overlap resulting in a more stable TS. Hence, the Diels-Alder reaction is under kinetic control.
References
- ↑ W. von E. Doering and W.R. Roth, "The overlap of two allyl radicals or a four-centered transition state in the cope rearrangement", Tetrahedron, 1961, 18(1), 67-74.DOI:10.1016/0040-4020(62)80025-8
- ↑ V.N. Staroverov and E.R. Davidson, "Transition Regions in the Cope Rearrangement of 1,5-Hexadiene and Its Cyano Derivatives", J. Am. Chem. Soc., 2000, 122(30), 7377-7385.DOI:10.1021/ja001259k
- ↑ M.J. Bearpark https://wiki.ch.ic.ac.uk/wiki/index.php?title=Mod:phys3#The_Cope_Rearrangement_Tutorial [accessed 28/11/2013]
- ↑ F. H. Allen, O. Kennard, D. G. Watson, L. Brammer, and A. G. Orpen, J. Chem. Soc, 1987, 1–19.