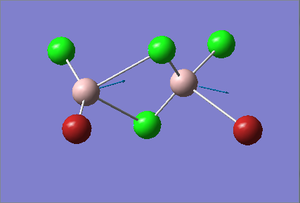
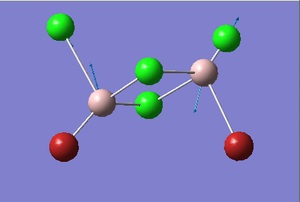
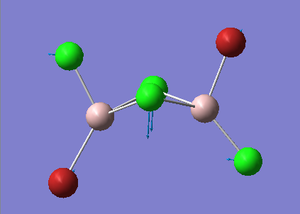
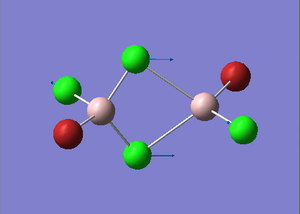
Rep:Mod:KA1510
Module 2
Introduction
The analysis of the structure and bonding of molecules are important in understanding more about reactivity and properties. This task aims to make use of computational chemistry applications Gaussview 5 in conjunction with Gaussian to learn how to carry out calculations. This involves calculating the optimisation, frequency analysis and molecular orbital analysis of a range of molecules, including BH3, TlBr3 and NH3. By optimising the geometry of several molecules such as BH3, TlBr3 and BBr3 – theoretical information on the kinetic and thermodynamic properties of molecules can be uncovered. These serve as a good theoretical benchmark with which to compare experimental data.
When Gaussian carries out an optimisation calculation, the nuclei are firstly assumed to be in fixed positions relative to their electrons which initially allows the Schrödinger equation to be solved with respect to the electrons. This corresponds to the SCF part of the calculation. The Schrödinger equation is then solved for the position of the nuclei which corresponds to the OPT part of the calculation. The optimised molecule is the one with the lowest energy geometry from the calculations.
Optimisation of a Molecule

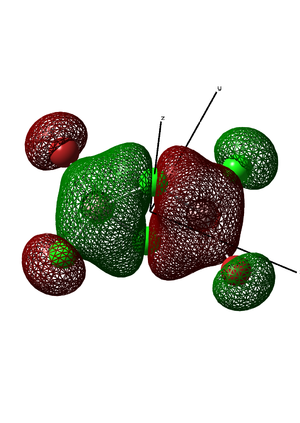
Figure 1. A Gaussview image of an optimized BH3 molecule
BH3 - B3LYP, 3-21G Optimization
Initially, a minimal basis set (3-21G) was chosen along with a DFT method and B3LYP hybrid functional.
Results from the Log. File1BH3 and gaussview summary provided below:
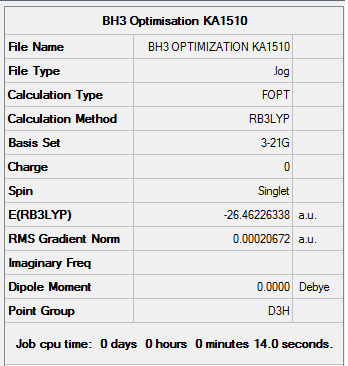
Figure 2. Gaussview Summary BH3 - 3-21G
The optimization data for the initial basis set (3-21G) confirms that the forces are converged. The force in this case is the gradient of the energy vs distance graph. The data also tells us that the placements are converged, which means that for a small displacement the energy does not change. This therefore shows that the optimization is complete.
Item               Value     Threshold  Converged?
Maximum Force            0.000413     0.000450     YES
RMS     Force            0.000271     0.000300     YES
Maximum Displacement     0.001610     0.001800     YES
RMS     Displacement     0.001054     0.001200     YES
Predicted change in Energy=-1.071764D-06
Optimization completed.
   -- Stationary point found.
                          ----------------------------
                          !   Optimized Parameters   !
                          ! (Angstroms and Degrees)  !
--------------------------                            --------------------------
! Name  Definition              Value          Derivative Info.                !
--------------------------------------------------------------------------------
! R1    R(1,2)                  1.1935         -DE/DX =    0.0004              !
! R2    R(1,3)                  1.1935         -DE/DX =    0.0004              !
! R3    R(1,4)                  1.1935         -DE/DX =    0.0004              !
! A1    A(2,1,3)              120.0            -DE/DX =    0.0                 !
! A2    A(2,1,4)              120.0            -DE/DX =    0.0                 !
! A3    A(3,1,4)              120.0            -DE/DX =    0.0                 !
! D1    D(2,1,4,3)            180.0            -DE/DX =    0.0                 !
--------------------------------------------------------------------------------
GradGradGradGradGradGradGradGradGradGradGradGradGradGradGradGradGradGrad
The data from the gaussview summary and Log. File1BH3 indicates that the optimization at the initial basis set has been completed since the value for the “RMS Gradient Norm” is less than 0.001.
B-H bond distance: 1.19 Å (3.s.f)
H-B-H bond angle: 120.0˚ (D3 symmetry group, trigonal planar)
The values obtained following the optimization agree with those quoted in literature: 1.19 Å and 120˚ [1] respectively
Total Energy of BH3 Optimization
Total energy for the 3-21G optimized BH3 structure = -26.46226338a.u.
BH3 - B3LYP, 6-31G Optimization
Next a higher level basis set (6-31G d,p) was used in conjunction with a DFT method and B3LYP hybrid functional which were employed initially.
Results from the Log. File2BH3 and gaussview summary provided below:
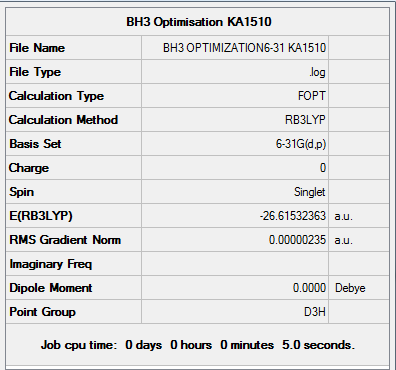
Figure 3. Gaussview Summary BH3 - 6-31G
The optimization data for the higher level basis set (6-31G) again confirms that the forces are converged. The data also tells us that the placements are converged, which means that for a small displacement the energy does not change. This therefore shows that the optimization is complete.
        Item               Value     Threshold  Converged?
Maximum Force            0.000005     0.000450     YES
RMS     Force            0.000003     0.000300     YES
Maximum Displacement     0.000019     0.001800     YES
RMS     Displacement     0.000012     0.001200     YES
Predicted change in Energy=-1.304899D-10
Optimization completed.
   -- Stationary point found.
                          ----------------------------
                          !   Optimized Parameters   !
                          ! (Angstroms and Degrees)  !
--------------------------                            --------------------------
! Name  Definition              Value          Derivative Info.                !
--------------------------------------------------------------------------------
! R1    R(1,2)                  1.1923         -DE/DX =    0.0                 !
! R2    R(1,3)                  1.1923         -DE/DX =    0.0                 !
! R3    R(1,4)                  1.1923         -DE/DX =    0.0                 !
! A1    A(2,1,3)              120.0            -DE/DX =    0.0                 !
! A2    A(2,1,4)              120.0            -DE/DX =    0.0                 !
! A3    A(3,1,4)              120.0            -DE/DX =    0.0                 !
! D1    D(2,1,4,3)            180.0            -DE/DX =    0.0                 !
--------------------------------------------------------------------------------
GradGradGradGradGradGradGradGradGradGradGradGradGradGradGradGradGradGrad
The data from the gaussview summary and Log. File2BH3 again indicates that the optimization at the higher basis set has been completed since the value for the “RMS Gradient Norm” is less than 0.001.
B-H bond distance: 1.19 Å (3.s.f)
H-B-H bond angle: 120.0˚ (D3 symmetry group, trigonal planar)
The values obtained following the optimisation, similarly to the initial basis set agree with those quoted in literature: 1.19 Å and 120˚ [1] respectively
Total Energy of BH3 Optimization
Total energy for the 3-21G optimized BH3 structure = -26.61532363a.u.
TlBr3 - Pseudo-Potentials, LanL2DZ Optimization

Figure 4. A Gaussview image of an optimized TlBr3 molecule
The optimization of TlBr3 was run differently to that of the BH3 in that a point group restriction was placed on the TlBr3 molecule (D3h, 0.001 – very tight) and a different basis set (LanL2DZ) was used with the B3LYP hybrid functional. The calculation was also submitted to a HPC server.One of the major advantages here of computing a molecule containing thallium, is that we can understand some of its thermodynamic and kinetic properties without being exposed to the various risks that thallium presents.
Results from the Log. File1TlBr3 and gaussview summary provided below:
D Space: http://hdl.handle.net/10042/23481
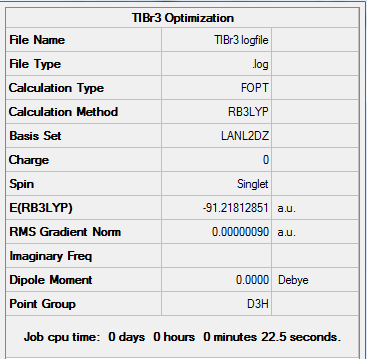
Figure 5. Gaussview Summary TlBr3 - LanL2DZ
The optimization data for the medium level basis set (LanL2DZ) confirms that the forces are converged. The data also tells us that the placements are converged, which means that for a small displacement the energy does not change. This therefore shows that the optimization is complete.
       Item               Value     Threshold  Converged?
Maximum Force            0.000002     0.000450     YES
RMS     Force            0.000001     0.000300     YES
Maximum Displacement     0.000022     0.001800     YES
RMS     Displacement     0.000014     0.001200     YES
Predicted change in Energy=-6.084047D-11
Optimization completed.
   -- Stationary point found.
                          ----------------------------
                          !   Optimized Parameters   !
                          ! (Angstroms and Degrees)  !
--------------------------                            --------------------------
! Name  Definition              Value          Derivative Info.                !
--------------------------------------------------------------------------------
! R1    R(1,2)                  2.651          -DE/DX =    0.0                 !
! R2    R(1,3)                  2.651          -DE/DX =    0.0                 !
! R3    R(1,4)                  2.651          -DE/DX =    0.0                 !
! A1    A(2,1,3)              120.0            -DE/DX =    0.0                 !
! A2    A(2,1,4)              120.0            -DE/DX =    0.0                 !
! A3    A(3,1,4)              120.0            -DE/DX =    0.0                 !
! D1    D(2,1,4,3)            180.0            -DE/DX =    0.0                 !
--------------------------------------------------------------------------------
GradGradGradGradGradGradGradGradGradGradGradGradGradGradGradGradGradGrad
The data from the gaussview summary and Log. File1TlBr3 indicates that the optimization at the initial basis set has been completed.
Tl-Br bond distance: 2.69 Å (3.s.f)
Br-Tl-Br bond angle: 120.0° (D3 symmetry group, trigonal planar)
The values obtained following the optimization agree with those quoted in literature: 2.59 Å[2] and 120°[3] respectively
Total Energy of TlBr3 Optimization
Total energy for the LanL2DZ optimized TlBr3 structure = -91.21812851a.u.
BBr3 - Pseudo-Potentials and a Mixture of Basis Sets Optimization
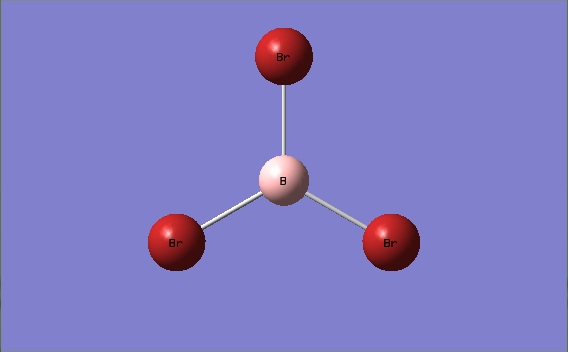
Figure 6. A Gaussview image of an optimized BBr3 molecule
The calculation for BBr3 was set up with a mixture of pseudo potentials and basis sets. The mixture of pseudo potentials and basis sets is to account for the “light-heavy” imbalance between the boron atom and the bromine atom in a B-Br bond. A Pseudo potential (LanL2DZ) were therefore used for bromine atoms and a basis set (6-31G d,p) was used for the boron atom.
Results from the Log. File1BBr3 and gaussview summary provided below:
D Space: http://hdl.handle.net/10042/23408

Figure 7. Gaussview Summary BBr3 - Mixed Basis Set
The optimization data for the mixed basis set (6-31G and LanL2DZ) again confirms that the forces are converged. The data also tells us that the placements are converged, which means that for a small displacement the energy does not change. This therefore shows that the optimization is complete.
        Item               Value     Threshold  Converged?
Maximum Force            0.000008     0.000450     YES
RMS     Force            0.000005     0.000300     YES
Maximum Displacement     0.000036     0.001800     YES
RMS     Displacement     0.000023     0.001200     YES
Predicted change in Energy=-4.027252D-10
Optimization completed.
   -- Stationary point found.
                          ----------------------------
                          !   Optimized Parameters   !
                          ! (Angstroms and Degrees)  !
--------------------------                            --------------------------
! Name  Definition              Value          Derivative Info.                !
--------------------------------------------------------------------------------
! R1    R(1,2)                  1.934          -DE/DX =    0.0                 !
! R2    R(1,3)                  1.934          -DE/DX =    0.0                 !
! R3    R(1,4)                  1.934          -DE/DX =    0.0                 !
! A1    A(2,1,3)              120.0            -DE/DX =    0.0                 !
! A2    A(2,1,4)              120.0            -DE/DX =    0.0                 !
! A3    A(3,1,4)              120.0            -DE/DX =    0.0                 !
! D1    D(2,1,4,3)            180.0            -DE/DX =    0.0                 !
--------------------------------------------------------------------------------
GradGradGradGradGradGradGradGradGradGradGradGradGradGradGradGradGradGrad
Total Energy of BBr3 Optimization
Total energy for the mixed basis set optimized BBr3 structure = -64.43645296a.u.
What is a Bond?
There at times on Gaussian 5.0 where Gaussview will tend not to display bonds in molecules where you would expect them to be present. This is due to the fact that Gaussview is very much accustomed to bond lengths in primarily organic molecules, and therefore when a bond length is calculated and it is longer than that of what the programme is usually used to – a bond will not be drawn between the atoms in a molecule.
This concept can be seen as favourable in distinguishing between bond types in molecules. A bond can be considered generally as a given interaction in an rregion of high electron density between various types of atoms resulting in a product being formed. In a 'covalent bond', molecular orbitals of a suitable symmetry overlap and combine resulting in an attractive interaction between the atoms. In comparison, an ionic bond is an attraction between two atoms but is characterised by the electrostatic interaction between oppositely charged nuclei. Subsequently, bonds are generally somewhere in between that of an ionic bond and a covalent bond in terms of bond character.
Comparing Bond Distances
| Molecule | Bond Distance/Å | Basis Set |
|---|---|---|
| BH3 | 1.19 | 6-31G(d,p) |
| BBr3 | 2.02 | Gen |
| TlBr3 | 2.69 | LanL2DZ |
The table above shows how the various bond lengths of different molecules differ depending on the size of the atoms involved. This is beacuse of the amount of orbital overlap between the different sized atoms.
By comparing the B-H bond (1.19Å) with the B-Br bond (2.02Å) shows clearly that the presence of the larger bromine atom results in a much longer bond forming with the boron atom in comparison to the hydrogen atom. This is due to the fact that there is weaker orbital overlap in B-Br since the size difference between the bromine and boron atoms is greater than that between the hydorgen and boron atoms and the bromine orbitals being more diffuse than the hydorgen orbitals. These diffuse orbitals hinder the effectiveness of the bromine atom's electronic interaction (inefficient overlap) with the boron atom. In terms of similarities, both bromine and hydrogen have an odd number of valence electrons (unpaired). This, however, has relatively small impact on the bond length.
A similar comparison can be made between the Tl-Br bond length (2.65Å) and that of B-Br (2.02Å). Thallium is in the same group as Boron but is much heavier since it is four periods below it. The two different bond lengths can thefore be explained by the effect of changing an atom within the same group but in different periods. Thallium is a very large atom in the 6th period of the periodic table and hence its valence shell orbital is far more diffuse in comparison to that of Boron. This suggests that the overlap of the orbitals between the boron atom and the bromine atom is far greater than that between the thallium atom and the bromine atom. The B-Br bond is therefore much shorter and stronger than Tl-Br sice there is better electronic overlap bewteen the residing one electron in the boron 2p orbital and the valence bromine orbitals.
Another key point worth mentioning is the inert pair effect which influeneces bonding and oxidation states. This effect results in thallium predominantely adopting a +1 oxidation state rather than the +3 oxidation state normally associated with boron. This therefore suggests that a boron +3 molecule is much more stable than that of a thallium +3 molecule and this further supports the idea that a B-Br bond is much stronger than that of a Tl-Br bond.
Frequency Analysis
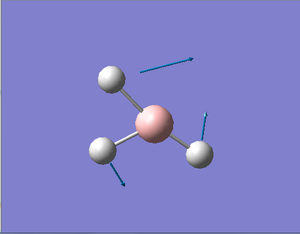
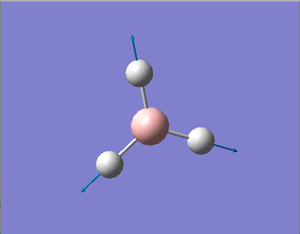
BH3 Vibrational Analysis
A vibrational analysis was carried out using the previously optimised BH3 structure (DFT, B3LYP, 6-31G (d,p)).
Results from the Log. File1BH3freq and gaussview summary provided below:
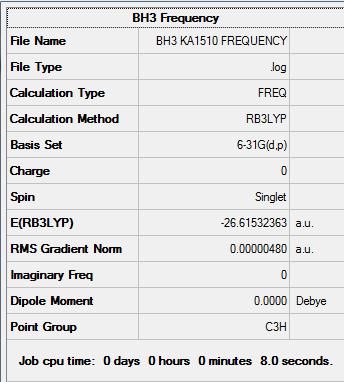
Figure 8. Gaussview Summary BH3 - Frequency(6-31G)
The low frequency values have been extracted from the corresponding output file and show that the frequency calculation is complete:
Low frequencies ---   -3.6018   -1.1356   -0.0054    1.3735    9.7036    9.7698
Low frequencies --- 1162.9825 1213.1733 1213.1760
Harmonic frequencies (cm**-1), IR intensities (KM/Mole), Raman scattering
activities (A**4/AMU), depolarization ratios for plane and unpolarized
incident light, reduced masses (AMU), force constants (mDyne/A),
and normal coordinates:
                    1                      2                      3
                   A"                     E'                     E'
Frequencies --  1162.9825              1213.1733              1213.1760
Red. masses --     1.2531                 1.1072                 1.1072
Frc consts  --     0.9986                 0.9601                 0.9601
IR Inten    --    92.5497                14.0545                14.0581
 Atom  AN      X      Y      Z        X      Y      Z        X      Y      Z
    1   5     0.00   0.00   0.16     0.00   0.10   0.00    -0.10   0.00   0.00
    2   1     0.00   0.00  -0.57     0.00   0.08   0.00     0.81   0.00   0.00
    3   1     0.00   0.00  -0.57    -0.39  -0.59   0.00     0.14   0.39   0.00
    4   1     0.00   0.00  -0.57     0.39  -0.59   0.00     0.14  -0.39   0.00
                    4                      5                      6
                   A'                     E'                     E'
Frequencies --  2582.3247              2715.4995              2715.5006
Red. masses --     1.0078                 1.1273                 1.1273
Frc consts  --     3.9597                 4.8979                 4.8979
IR Inten    --     0.0000               126.3285               126.3189
 Atom  AN      X      Y      Z        X      Y      Z        X      Y      Z
    1   5     0.00   0.00   0.00     0.11   0.00   0.00     0.00   0.11   0.00
    2   1     0.00   0.58   0.00     0.02   0.00   0.00     0.00  -0.81   0.00
    3   1     0.50  -0.29   0.00    -0.60   0.36   0.00     0.36  -0.19   0.00
    4   1    -0.50  -0.29   0.00    -0.60  -0.36   0.00    -0.36  -0.19   0.00
The various modes of vibration for BH3 are presented in the table below:
Figure 9. Table Showing Vibrational Modes of BH3
The infrared spectrum of the vibrating BH3 is shown below:
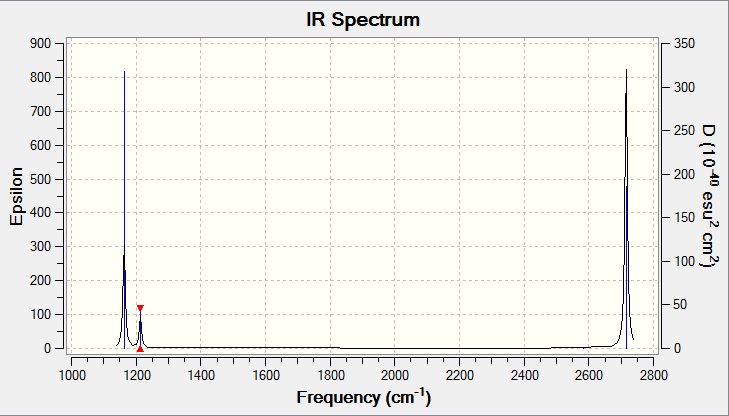
Figure 10. Infrared Spectrum of Vibrating BH3 Molecule
It is evident that there should be 3N-6 vibrational frequencies present in the infrared spectrum. For BH3, N=4 so we can expect 6 vibrations as the frequency table illustrates above (Figure.8). Peaks on the infrared spectrum arise as a result of a change in dipole moment which occur as a result of a vibration. However, in the infrared spectrum above (Figure.9 only 3 peaks are present. This can be explained by considering the various symmetry of the vibrations. Firstly, the vibrational mode 4 occuring at a frequency of 2582 cm-1( A'1 symmetry) is totally symmetric and therefore there is no change in dipole moment and as a result it remains infrared inactive . From the remaining 5 vibrational modes, there is one pair of degenerate vibrations which occur at a frewuency of 1213 cm-1 with E' symmetry, one pair which occur at a frequency of 2715 cm-1 also with E' symmetry and one mode which occurs at a frequency at 1163 cm-1 with A2" symmetry. These three frequencies correspond to three distinct vibrations.
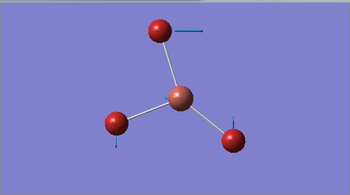
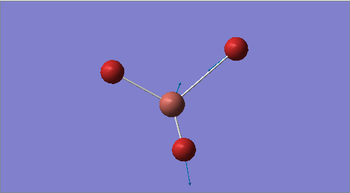
TlBr3 Vibrational Analysis
A vibrational analysis was carried out using the previously optimised TlBr3 structure (DFT, B3LYP, LanL2DZ).
Results from the Log. File1TlBr3freq and gaussview summary provided below:
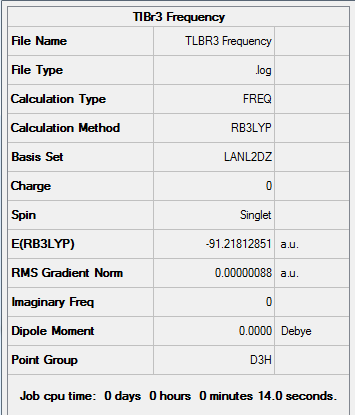
Figure 11. Gaussview Summary TlBr3 - Frequency(LanL2DZ)
The low frequency values have been extracted from the corresponding output file and show that the frequency calculation is complete:
Low frequencies ---   -3.4213   -0.0026   -0.0004    0.0015    3.9367    3.9367
Low frequencies ---   46.4289   46.4292   52.1449
Harmonic frequencies (cm**-1), IR intensities (KM/Mole), Raman scattering
activities (A**4/AMU), depolarization ratios for plane and unpolarized
incident light, reduced masses (AMU), force constants (mDyne/A),
and normal coordinates:
                    1                      2                      3
                   E'                     E'                     A2"
Frequencies --    46.4289                46.4292                52.1449
Red. masses --    88.4613                88.4613               117.7209
Frc consts  --     0.1124                 0.1124                 0.1886
IR Inten    --     3.6867                 3.6867                 5.8466
 Atom  AN      X      Y      Z        X      Y      Z        X      Y      Z
    1  81     0.00   0.28   0.00    -0.28   0.00   0.00     0.00   0.00   0.55
    2  35     0.00   0.26   0.00     0.74   0.00   0.00     0.00   0.00  -0.48
    3  35     0.43  -0.49   0.00    -0.01  -0.43   0.00     0.00   0.00  -0.48
    4  35    -0.43  -0.49   0.00    -0.01   0.43   0.00     0.00   0.00  -0.48
                    4                      5                      6
                   A1'                    E'                     E'
Frequencies --   165.2685               210.6948               210.6948
Red. masses --    78.9183               101.4032               101.4032
Frc consts  --     1.2700                 2.6522                 2.6522
IR Inten    --     0.0000                25.4830                25.4797
 Atom  AN      X      Y      Z        X      Y      Z        X      Y      Z
    1  81     0.00   0.00   0.00     0.42   0.00   0.00     0.00   0.42   0.00
    2  35     0.00  -0.58   0.00     0.01   0.00   0.00     0.00  -0.74   0.00
    3  35     0.50   0.29   0.00    -0.55  -0.32   0.00    -0.32  -0.18   0.00
    4  35    -0.50   0.29   0.00    -0.55   0.32   0.00     0.32  -0.18   0.00
The various modes of vibration for TlBr3 are presented in the table below:
Figure 12. Table Showing Vibrational Modes of TlBr3
The lowest normal vibrational mode occurs at 46.4289cm-1
The infrared spectrum of the vibrating TlBr3 is shown below:

Figure 13. Infrared Spectrum of Vibrating TlBr3 Molecule
Comparison of Vibrational Frequencies of BH3 and TlBr3
| TlBr3 frequency / cm-1 | BH3 frequency / cm-1 |
|---|---|
| 46 | 1163 |
| 46 | 1213 |
| 52 | 1213 |
| 165 | 2582 |
| 211 | 2715 |
| 211 | 2716 |
Firstly it is important to nmention that if any comparison is to be made between calculations, it is essential that they use the same method basis set for both optimisation and frequency analysis. Calculations which are made using a different basis set are not comparable and as a result conclusions can be drawn. The purpose of carrying out a frequency analysis is to confirm that the optimised structure obtained is a minimum. It is also very useful in thoroughly analysing and understanding the vibrational modes that a molecule displays and helps in the understanding of a molecule's infrared spectra. The “low frequencies” represents the “-6” part of the “3N-6” vibrations equation of a polyatomic molecule (containing N atoms).It is usually the case that “low frequencies” have associated displacement vectors that ultimately influence the centre of mass of the molecule. In the case of these molecules, it is the position of the boron or thallium atom that is shifted each time. Negative frequency values can usually be neglected.
It is evident from the table above that the frequency values of BH3 are evidently larger than that of TlBr33. Since the frequency at which a bond vibrates also corresponds to its bond strength, the B-H bond can be referred to as being stronger relative to the Tl-Br bond. This can be explained using the previous argument which mentions that he more diffuse orbitals in the Tl-Br bond results in poorer orbital overlap, a weaker bond and hence a lower vibrational frequency. An Alternative approach to explaining the lower vibrational frequency in TlBr3 is to consider Hooke's Law. Hooke's Law relates the vibrational frequency of a partuclar molecule to its redcued mass. This therfore suggests that the larger the two atoms in a molecule, the greater their reduced mass and hence the lower their vibrational frequency.
The order of vibrational modes in the two molecules is also slightly different. In TlBr3 the order of the vibrational modes is E',E', A2’, A1' E', E' whereas in BH3, the order of the vibrational modes is A2’, E', E', A1', E', E'. Both molecules exhibit six modes and this is due to the fact that both moelcules have the same structure. This is further supported by the fact that the spectra of the two molecules each display three vibrational peaks.
A trend that that can be easily spotted in the vibrational modes of both molecules is the similarity in value of two pairs of modes – the A2’ and E’ modes, as well as the A1’ and E’ modes which appear energetically higher. This is perhapsis evidence of vibronic coupling between the differenet modes of vibration in both molecules. In the trigonal planar arrangement of both molecules the two vibrational modes that couple possess a common atom or bond and this explains the strong coupling interactions displayed by the molecules and hence the closeness of the pairs of modes. The vibrational modes at higher energy may therefore be as a result of coupling interactions experienced by the pair of vibrational modes at lower energy.
Population Analysis
Molecular Orbitals of BH3
A further energy calculation was run using a previously optimised BH3 structure (DFT, B3LYP, 6-31G (d,p))
Results from the Log. File1BH3MO and gaussview summary provided below:
D Space: http://hdl.handle.net/10042/23440
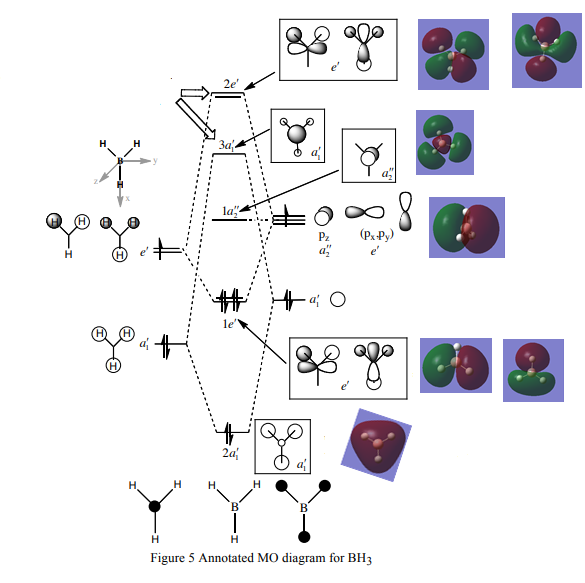
Figure 14. Gaussview Summary BH3 - Energy(6-31G)
The MO diagram constructed using the LCAO method is shown below:
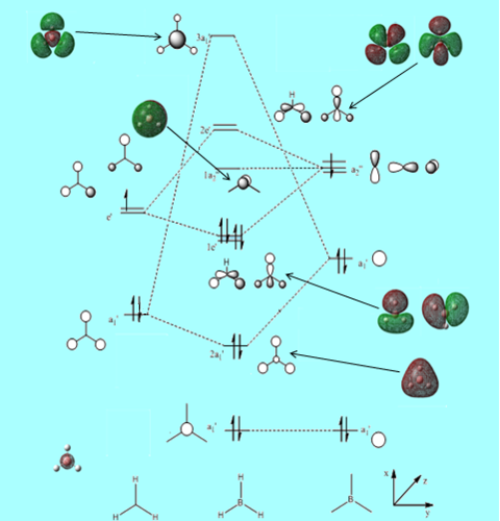
Figure 15. MO diagram of Vibrating BH3 Molecule
From the molecular orbital diagram above in Figure 14. it is evident that the real molecular orbitals and the do not differ from the LCAO molecular orbitals which suggests that molecular orbital theory is an accurate tool in modelling the molecular framework of various simple molecules.
NBO Analysis
NH3 Optimisation
6-31g (d,p) Optimisation
The higher level basis set (6-31G d,p) was used simultneously with a DFT method and the B3LYP hybrid functional.
Results from the Log. File1NH3 and gaussview summary provided below:
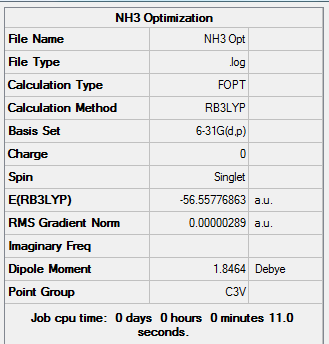
Figure 16. Gaussview Summary NH3 - Optimization(6-31G)
The optimization data for the higher level basis set (6-31G) confirms that the forces are converged. The data also tells us that the placements are converged, which means that for a small displacement the energy does not change. This therefore shows that the optimization is complete.
       Item               Value     Threshold  Converged?
Maximum Force            0.000005     0.000450     YES
RMS     Force            0.000003     0.000300     YES
Maximum Displacement     0.000010     0.001800     YES
RMS     Displacement     0.000007     0.001200     YES
Predicted change in Energy=-7.830148D-11
Optimization completed.
   -- Stationary point found.
                          ----------------------------
                          !   Optimized Parameters   !
                          ! (Angstroms and Degrees)  !
--------------------------                            --------------------------
! Name  Definition              Value          Derivative Info.                !
--------------------------------------------------------------------------------
! R1    R(1,2)                  1.018          -DE/DX =    0.0                 !
! R2    R(1,3)                  1.018          -DE/DX =    0.0                 !
! R3    R(1,4)                  1.018          -DE/DX =    0.0                 !
! A1    A(2,1,3)              105.7463         -DE/DX =    0.0                 !
! A2    A(2,1,4)              105.7463         -DE/DX =    0.0                 !
! A3    A(3,1,4)              105.7463         -DE/DX =    0.0                 !
! D1    D(2,1,4,3)           -111.867          -DE/DX =    0.0                 !
--------------------------------------------------------------------------------
GradGradGradGradGradGradGradGradGradGradGradGradGradGradGradGradGradGrad
The data from the gaussview summary and Log. File1NH3 indicates that the optimization at the initial basis set has been completed.
NH3 Frequency Analysis
A frequency analysis was run for NH3 using the previously optimised structure (DFT, B3LYP, 6-31G (d,p))
Results from the Log. File1NH3freq and gaussview summary provided below:
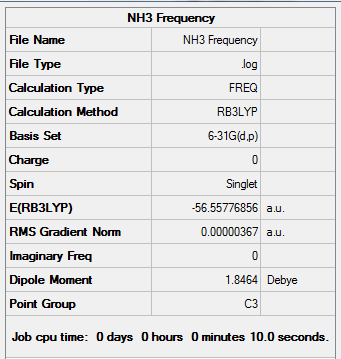
Figure 17. Gaussview Summary NH3 - Frequency(6-31G)
The low frequency values have been extracted from the corresponding output file and show that the frequency calculation is complete:
Low frequencies ---  -30.6481   -0.0011    0.0014    0.0016   15.3875   26.8843
Low frequencies --- 1089.5103 1694.1140 1694.1752
 Item               Value     Threshold  Converged?
Maximum Force            0.000008     0.000450     YES
RMS     Force            0.000004     0.000300     YES
Maximum Displacement     0.000025     0.001800     YES
RMS     Displacement     0.000014     0.001200     YES
Predicted change in Energy=-1.905150D-10
Optimization completed.
   -- Stationary point found.
GradGradGradGradGradGradGradGradGradGradGradGradGradGradGradGradGradGrad
NH3 Population Analysis
An energy calculation was run on NH3 using the previously optimised structure (DFT, B3LYP, 6-31G (d,p)).
Results from the Log. File1NH3MO and gaussview summary provided below:
D Space: http://hdl.handle.net/10042/23447
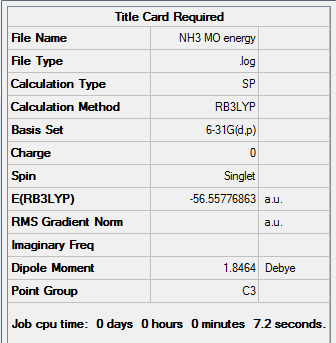
Figure 18. Gaussview Summary NH3 - Energy(6-31G)
NH3 NBO Analysis
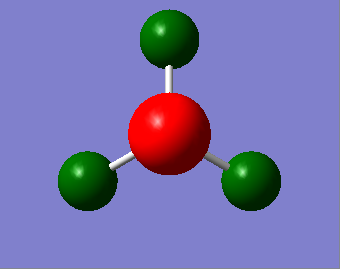
Figure 19. NH3 NBO Analysis
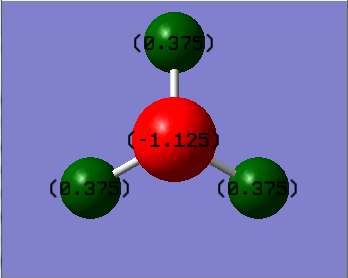
Figure 20. NH3 NBO Analysis Numbers
NBO charge on nitrogen: -1.125
NBO charge on hydrogen: 0.375

Figure 21. NH3 NBO Analysis Table
The charge range is between -1.125 and 1.125
NH3BH3 Optimization
3-21G Optimisation
Initially the lower level basis set (3-21G) was used simultneously with a DFT method and the B3LYP hybrid functional.
Results from the Log. File1NH3BH3 and gaussview summary provided below:
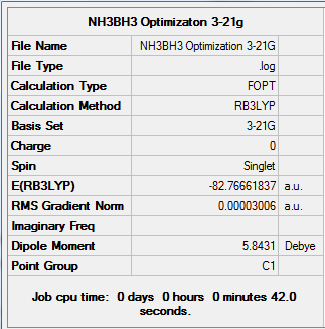
Figure 22. Gaussview Summary NH3BH3 - Optimization(3-21G)
The optimization data for the Lower level basis set (3-21G) confirms that the forces are converged. The data also tells us that the placements are converged, which means that for a small displacement the energy does not change. This therefore shows that the optimization is complete.
Item               Value     Threshold  Converged?
Maximum Force            0.000094     0.000450     YES
RMS     Force            0.000030     0.000300     YES
Maximum Displacement     0.000419     0.001800     YES
RMS     Displacement     0.000178     0.001200     YES
Predicted change in Energy=-5.742833D-08
Optimization completed.
   -- Stationary point found.
                          ----------------------------
                          !   Optimized Parameters   !
                          ! (Angstroms and Degrees)  !
--------------------------                            --------------------------
! Name  Definition              Value          Derivative Info.                !
--------------------------------------------------------------------------------
! R1    R(1,7)                  1.0277         -DE/DX =   -0.0001              !
! R2    R(2,7)                  1.0277         -DE/DX =   -0.0001              !
! R3    R(3,7)                  1.0277         -DE/DX =    0.0                 !
! R4    R(4,8)                  1.212          -DE/DX =    0.0                 !
! R5    R(5,8)                  1.212          -DE/DX =   -0.0001              !
! R6    R(6,8)                  1.212          -DE/DX =   -0.0001              !
! R7    R(7,8)                  1.6854         -DE/DX =   -0.0001              !
! A1    A(1,7,2)              109.3469         -DE/DX =    0.0                 !
! A2    A(1,7,3)              109.35           -DE/DX =    0.0                 !
! A3    A(1,7,8)              109.5925         -DE/DX =    0.0                 !
! A4    A(2,7,3)              109.3462         -DE/DX =    0.0                 !
! A5    A(2,7,8)              109.5973         -DE/DX =    0.0                 !
! A6    A(3,7,8)              109.5935         -DE/DX =    0.0                 !
! A7    A(4,8,5)              113.563          -DE/DX =    0.0                 !
! A8    A(4,8,6)              113.5594         -DE/DX =    0.0                 !
! A9    A(4,8,7)              104.9872         -DE/DX =    0.0                 !
! A10   A(5,8,6)              113.5575         -DE/DX =    0.0                 !
! A11   A(5,8,7)              104.9846         -DE/DX =    0.0                 !
! A12   A(6,8,7)              104.9848         -DE/DX =    0.0                 !
! D1    D(1,7,8,4)            179.9938         -DE/DX =    0.0                 !
! D2    D(1,7,8,5)            -60.0024         -DE/DX =    0.0                 !
! D3    D(1,7,8,6)             59.994          -DE/DX =    0.0                 !
! D4    D(2,7,8,4)            -60.0065         -DE/DX =    0.0                 !
! D5    D(2,7,8,5)             59.9972         -DE/DX =    0.0                 !
! D6    D(2,7,8,6)            179.9936         -DE/DX =    0.0                 !
! D7    D(3,7,8,4)             59.9928         -DE/DX =    0.0                 !
! D8    D(3,7,8,5)            179.9966         -DE/DX =    0.0                 !
! D9    D(3,7,8,6)            -60.007          -DE/DX =    0.0                 !
--------------------------------------------------------------------------------
GradGradGradGradGradGradGradGradGradGradGradGradGradGradGradGradGradGrad
The data from the gaussview summary and Log. File1NH3BH3 indicates that the optimization at the initial basis set has been completed.
6-31G Optimisation
The optimisation was then carried out using the higher level more accurate 6-31G(d,p) basis set simultneously with a DFT method and the B3LYP hybrid functional.
Results from the Log. File2NH3BH3 and gaussview summary provided below:

Figure 23. Gaussview Summary NH3BH3 - Optimization(6-31G)
The optimization data for the higher level basis set (6-31G) confirms that the forces are converged. The data also tells us that the placements are converged, which means that for a small displacement the energy does not change. This therefore shows that the optimization is complete.
        Item               Value     Threshold  Converged?
Maximum Force            0.000137     0.000450     YES
RMS     Force            0.000063     0.000300     YES
Maximum Displacement     0.000606     0.001800     YES
RMS     Displacement     0.000336     0.001200     YES
Predicted change in Energy=-1.993995D-07
Optimization completed.
   -- Stationary point found.
                          ----------------------------
                          !   Optimized Parameters   !
                          ! (Angstroms and Degrees)  !
--------------------------                            --------------------------
! Name  Definition              Value          Derivative Info.                !
--------------------------------------------------------------------------------
! R1    R(1,7)                  1.0186         -DE/DX =   -0.0001              !
! R2    R(2,7)                  1.0186         -DE/DX =   -0.0001              !
! R3    R(3,7)                  1.0186         -DE/DX =   -0.0001              !
! R4    R(4,8)                  1.2101         -DE/DX =   -0.0001              !
! R5    R(5,8)                  1.2101         -DE/DX =   -0.0001              !
! R6    R(6,8)                  1.2101         -DE/DX =   -0.0001              !
! R7    R(7,8)                  1.668          -DE/DX =   -0.0001              !
! A1    A(1,7,2)              107.87           -DE/DX =    0.0                 !
! A2    A(1,7,3)              107.8652         -DE/DX =    0.0                 !
! A3    A(1,7,8)              111.0329         -DE/DX =    0.0                 !
! A4    A(2,7,3)              107.8697         -DE/DX =    0.0                 !
! A5    A(2,7,8)              111.0286         -DE/DX =    0.0                 !
! A6    A(3,7,8)              111.0291         -DE/DX =    0.0                 !
! A7    A(4,8,5)              113.8693         -DE/DX =    0.0                 !
! A8    A(4,8,6)              113.8721         -DE/DX =    0.0                 !
! A9    A(4,8,7)              104.6003         -DE/DX =    0.0                 !
! A10   A(5,8,6)              113.8747         -DE/DX =    0.0                 !
! A11   A(5,8,7)              104.6003         -DE/DX =    0.0                 !
! A12   A(6,8,7)              104.5984         -DE/DX =    0.0                 !
! D1    D(1,7,8,4)           -179.9867         -DE/DX =    0.0                 !
! D2    D(1,7,8,5)            -59.9892         -DE/DX =    0.0                 !
! D3    D(1,7,8,6)             60.0135         -DE/DX =    0.0                 !
! D4    D(2,7,8,4)            -59.9839         -DE/DX =    0.0                 !
! D5    D(2,7,8,5)             60.0136         -DE/DX =    0.0                 !
! D6    D(2,7,8,6)           -179.9837         -DE/DX =    0.0                 !
! D7    D(3,7,8,4)             60.0161         -DE/DX =    0.0                 !
! D8    D(3,7,8,5)           -179.9864         -DE/DX =    0.0                 !
! D9    D(3,7,8,6)            -59.9837         -DE/DX =    0.0                 !
--------------------------------------------------------------------------------
GradGradGradGradGradGradGradGradGradGradGradGradGradGradGradGradGradGrad
The data from the gaussview summary and Log. File2NH3BH3 indicates that the optimization at the initial basis set has been completed.
NH3BH3 Frequency Analysis
A frequency analysis was run for BH3NH3 using the previously optimised structure (DFT, B3LYP, 6-31G (d,p)).
Results from the Log. File3NH3BH3freq and gaussview summary provided below:
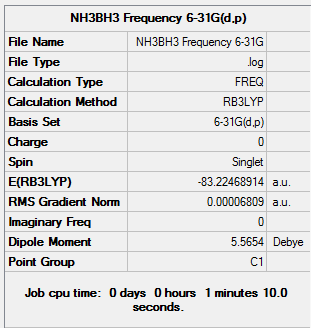
Figure 24. Gaussview Summary NH3BH3 - Frequency(6-31G)
The low frequency values have been extracted from the corresponding output file and show that the frequency calculation is complete:
Low frequencies ---   -0.0015   -0.0013    0.0003   17.0845   22.5204   38.5799
Low frequencies ---  265.8305  632.3770  639.0680
       Item               Value     Threshold  Converged?
Maximum Force            0.000125     0.000450     YES
RMS     Force            0.000068     0.000300     YES
Maximum Displacement     0.000948     0.001800     YES
RMS     Displacement     0.000577     0.001200     YES
Predicted change in Energy=-2.114205D-07
Optimization completed.
   -- Stationary point found.
GradGradGradGradGradGradGradGradGradGradGradGradGradGradGradGradGradGrad
The data from the gaussview summary and Log. File3NH3BH3freq indicates that the optimization at the initial basis set has been completed.
Dissociation Energy Calculation
The energies calculated from optimised structures:
E(NH3)= -56.55776863 a.u.
E(BH3)= -26.61532363 a.u.
E(NH3BH3)= -83.22468914 a.u.
The dissociation energy for the NH3BH3 adduct is the difference between the energy of a NH3BH3 molecule and the sum of the NH3 and BH3 molecule energies:
ΔE = E(NH3BH3) - (E(NH3) + (E(BH3)
ΔE = (-83.22468914) - [(-56.55776863) + (-26.61532363)]
ΔE = (-83.22468914) - (-83.17309226)
ΔE = -0.05159688 a.u.
Edissociation = -135.4 kJ mol-1
Mini Project - Option 1
Al2Br2Cl4 - B3LYP, GEN Optimization
Cl2Al(μ-Br2)AlCl2 Optimization

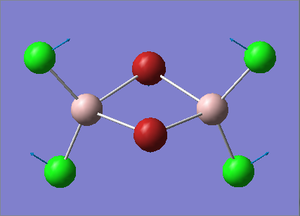
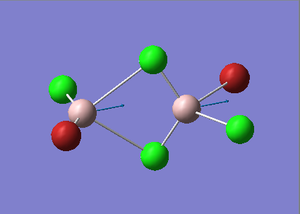
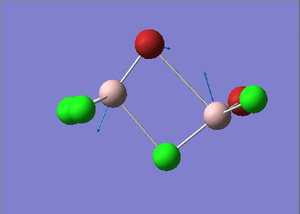
Figure 27. A Gaussview image of an optimized Cl2Al(μ-Br2)AlCl2 molecule
After an initial basis set of 3-21G was set, a calculation involving a medium level basis set (GEN) was chosen along with a DFT method and B3LYP hybrid functional.
Results from the Log. File2Al2Br2Cl4 and gaussview summary provided below:
D Space: http://hdl.handle.net/10042/23555
| Parameters | |
|---|---|
| File Type | .log |
| Calculation Type | FOPT |
| Calculation Method | RB3LYP |
| Basis Set | GEN |
| Charge | 0 |
| Spin | Singlet |
| Total energy(a.u.) | -2352.40630798 a.u |
| RMS Gradient(a.u.) | 0.00000396 a.u |
| Dipole Moment(Debye) | 0.00 |
| Point Group | D2h |
| Time taken | 3 minutes 23.6 seconds |
The optimization data for the medium level basis set (GEN) confirms that the forces are converged. The data also tells us that the placements are converged, which means that for a small displacement the energy does not change. This therefore shows that the optimization is complete.
        Item               Value     Threshold  Converged?
Maximum Force            0.000007     0.000450     YES
RMS     Force            0.000003     0.000300     YES
Maximum Displacement     0.000170     0.001800     YES
RMS     Displacement     0.000059     0.001200     YES
Predicted change in Energy=-1.208965D-09
Optimization completed.
   -- Stationary point found.
The data from the gaussview summary and Log. File2Al2Br2Cl4 indicates that the optimization at the initial basis set has been completed.
Cl2Al(μ-Br2)AlCl2 Frequency Analysis
A vibrational analysis was carried out using the previously optimised Cl2Al(μ-Br2)AlCl2 structure (DFT, B3LYP, GEN).
Results from the Log. File2Al2Br2Cl4freq:
D Space: http://hdl.handle.net/10042/23805
The low frequency values have been extracted from the corresponding output file and show that the frequency calculation is complete:
Low frequencies ---   -5.1798   -5.0280   -3.2282   -0.0042   -0.0039   -0.0033
Low frequencies ---   14.8293   63.2820   86.0840
        Item               Value     Threshold  Converged?
Maximum Force            0.000013     0.000450     YES
RMS     Force            0.000004     0.000300     YES
Maximum Displacement     0.000231     0.001800     YES
RMS     Displacement     0.000100     0.001200     YES
Predicted change in Energy=-2.135929D-09
Optimization completed.
   -- Stationary point found.
GradGradGradGradGradGradGradGradGradGradGradGradGradGradGradGradGradGrad
Cis-BrClAl(μ-Cl2)AlClBr Optimization
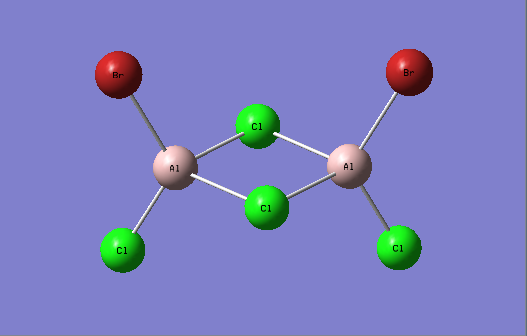
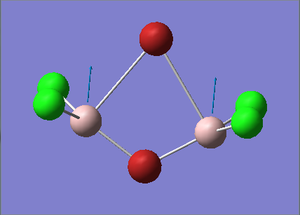
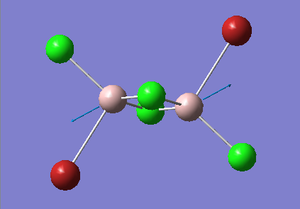
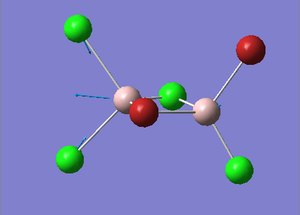
Figure 28. A Gaussview image of an optimized Cis-BrClAl(μ-Cl2)AlClBr molecule
After an initial basis set of 3-21G was set, a calculation involving a medium level basis set (GEN) was chosen along with a DFT method and B3LYP hybrid functional.
Results from the Log. File3Al2Br2Cl4 and gaussview summary provided below:
D Space:http://hdl.handle.net/10042/23667
| Parameters | |
|---|---|
| File Type | .log |
| Calculation Type | FOPT |
| Calculation Method | RB3LYP |
| Basis Set | GEN |
| Charge | 0 |
| Spin | Singlet |
| Total energy(a.u.) | -2352.41626677 a.u |
| RMS Gradient(a.u.) | 0.00001470 a.u |
| Dipole Moment(Debye) | 0.1658 |
| Point Group | C2v |
| Time taken | 4 minutes 18.0 seconds |
The optimization data for the medium level basis set (GEN) confirms that the forces are converged. The data also tells us that the placements are converged, which means that for a small displacement the energy does not change. This therefore shows that the optimization is complete.
       Item               Value     Threshold  Converged?
Maximum Force            0.000040     0.000450     YES
RMS     Force            0.000016     0.000300     YES
Maximum Displacement     0.001360     0.001800     YES
RMS     Displacement     0.000424     0.001200     YES
Predicted change in Energy=-2.577421D-08
Optimization completed.
   -- Stationary point found.
The data from the gaussview summary and Log. File3Al2Br2Cl4 indicates that the optimization at the initial basis set has been completed.
Cis-BrClAl(μ-Cl2)AlClBr Frequency Analysis
A vibrational analysis was carried out using the previously optimised Cis-BrClAl(μ-Cl2)AlClBr structure (DFT, B3LYP, GEN).
Results from the Log. File3Al2Br2Cl4freq:
D Space: http://hdl.handle.net/10042/23741
The low frequency values have been extracted from the corresponding output file and show that the frequency calculation is complete:
Low frequencies ---   -3.8194   -2.2357    0.0020    0.0030    0.0042    1.3863
Low frequencies ---   17.2011   50.9456   78.5393
        Item               Value     Threshold  Converged?
Maximum Force            0.000048     0.000450     YES
RMS     Force            0.000015     0.000300     YES
Maximum Displacement     0.001466     0.001800     YES
RMS     Displacement     0.000541     0.001200     YES
Predicted change in Energy=-4.001551D-08
Optimization completed.
   -- Stationary point found.
GradGradGradGradGradGradGradGradGradGradGradGradGradGradGradGradGradGrad
Trans-BrClAl(μ-Cl2)AlClBr Optimization
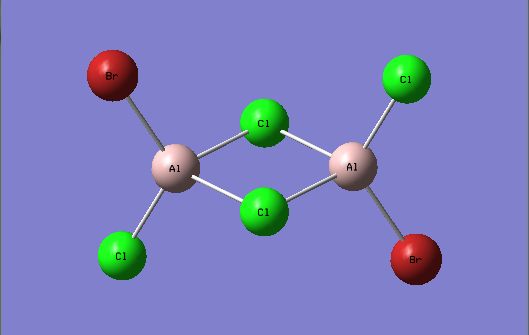
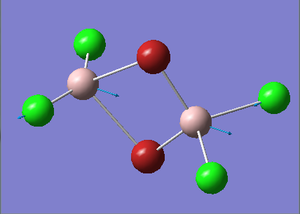
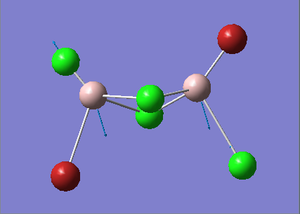
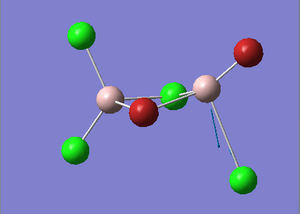
Figure 29. A Gaussview image of an optimized Trans-BrClAl(μ-Cl2)AlClBr molecule
After an initial basis set of 3-21G was set, a calculation involving a medium level basis set (GEN) was chosen along with a DFT method and B3LYP hybrid functional.
Results from the Log. File4Al2Br2Cl4 and gaussview summary provided below:
D Space: http://hdl.handle.net/10042/23680
| Parameters | |
|---|---|
| File Type | .log |
| Calculation Type | FOPT |
| Calculation Method | RB3LYP |
| Basis Set | GEN |
| Charge | 0 |
| Spin | Singlet |
| Total energy(a.u.) | -2352.41629858 a.u |
| RMS Gradient(a.u.) | 0.00001470 a.u |
| Dipole Moment(Debye) | 0.1567 |
| Point Group | C2h |
| Time taken | 5 minutes 21.1 seconds |
The optimization data for the medium level basis set (GEN) confirms that the forces are converged. The data also tells us that the placements are converged, which means that for a small displacement the energy does not change. This therefore shows that the optimization is complete.
        Item               Value     Threshold  Converged?
Maximum Force            0.000039     0.000450     YES
RMS     Force            0.000015     0.000300     YES
Maximum Displacement     0.000467     0.001800     YES
RMS     Displacement     0.000168     0.001200     YES
Predicted change in Energy=-2.435676D-08
Optimization completed.
   -- Stationary point found.
The data from the gaussview summary and Log. File4Al2Br2Cl4 indicates that the optimization at the initial basis set has been completed.
Trans-BrClAl(μ-Cl2)AlClBr Frequency Analysis
A vibrational analysis was carried out using the previously optimised Trans-BrClAl(μ-Cl2)AlClBr structure (DFT, B3LYP, GEN).
Results from the Log. File4Al2Br2Cl4freq:
D Space: http://hdl.handle.net/10042/23755
The low frequency values have been extracted from the corresponding output file and show that the frequency calculation is complete:
Low frequencies ---   -4.7980   -0.0036   -0.0005    0.0002    1.4530    2.2597
Low frequencies ---   18.1745   49.1209   73.0074
        Item               Value     Threshold  Converged?
Maximum Force            0.000050     0.000450     YES
RMS     Force            0.000016     0.000300     YES
Maximum Displacement     0.000576     0.001800     YES
RMS     Displacement     0.000258     0.001200     YES
Predicted change in Energy=-3.233506D-08
Optimization completed.
   -- Stationary point found.
GradGradGradGradGradGradGradGradGradGradGradGradGradGradGradGradGradGrad
BrClAl(μ-Br,Cl)AlCl2 Optimization
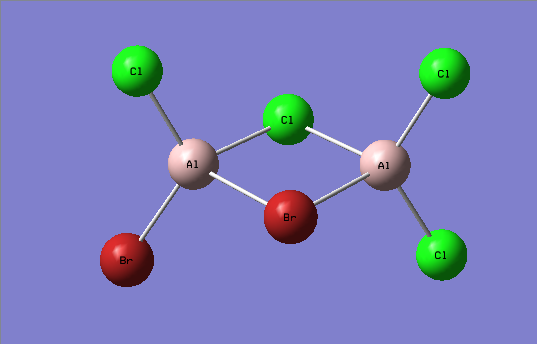
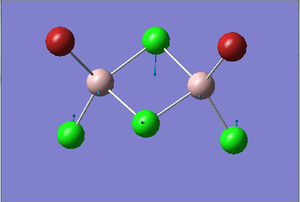
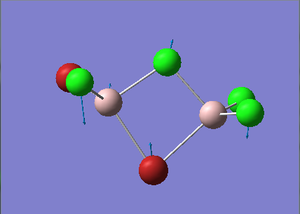
Figure 30. A Gaussview image of an optimized BrClAl(μ-Br,Cl)AlCl2 molecule
After an initial basis set of 3-21G was set, a calculation involving a medium level basis set (GEN) was chosen along with a DFT method and B3LYP hybrid functional.
Results from the Log. File5Al2Br2Cl4 and gaussview summary provided below:
D Space: http://hdl.handle.net/10042/23693
| Parameters | |
|---|---|
| File Type | .log |
| Calculation Type | FOPT |
| Calculation Method | RB3LYP |
| Basis Set | GEN |
| Charge | 0 |
| Spin | Singlet |
| Total energy(a.u.) | -2352.41109944 a.u |
| RMS Gradient(a.u.) | 0.00001557 a.u |
| Dipole Moment(Debye) | 0.1386 |
| Point Group | C1 |
| Time taken | 4 minutes 2.7 seconds |
The optimization data for the medium level basis set (GEN) confirms that the forces are converged. The data also tells us that the placements are converged, which means that for a small displacement the energy does not change. This therefore shows that the optimization is complete.
        Item               Value     Threshold  Converged?
Maximum Force            0.000035     0.000450     YES
RMS     Force            0.000014     0.000300     YES
Maximum Displacement     0.000508     0.001800     YES
RMS     Displacement     0.000182     0.001200     YES
Predicted change in Energy=-2.016863D-08
Optimization completed.
   -- Stationary point found.
The data from the gaussview summary and Log. File5Al2Br2Cl4 indicates that the optimization at the initial basis set has been completed.
BrClAl(μ-Br,Cl)AlCl2 Frequency Analysis
A vibrational analysis was carried out using the previously optimised BrClAl(μ-Br,Cl)AlCl2 structure (DFT, B3LYP, GEN).
Results from the Log. File5Al2Br2Cl4freq:
D Space: http://hdl.handle.net/10042/23769
The low frequency values have been extracted from the corresponding output file and show that the frequency calculation is complete:
Low frequencies ---   -2.2907    0.0027    0.0030    0.0031    1.2467    3.3241
Low frequencies ---   17.1613   55.9533   80.0564
       Item               Value     Threshold  Converged?
Maximum Force            0.000034     0.000450     YES
RMS     Force            0.000016     0.000300     YES
Maximum Displacement     0.001351     0.001800     YES
RMS     Displacement     0.000528     0.001200     YES
Predicted change in Energy=-3.668579D-08
Optimization completed.
   -- Stationary point found.
GradGradGradGradGradGradGradGradGradGradGradGradGradGradGradGradGradGrad
Infrared Spectroscopy
Cl2Al(μ-Br2)AlCl2 Infrared Spectrum

Figure 31. Infrared Spectrum of Vibrating Cl2Al(μ-Br2)AlCl2 Molecule
 = Chlorine
  = Bromine
  = Aluminium
Cis-BrClAl(μ-Cl2)AlClBr Infrared Spectrum
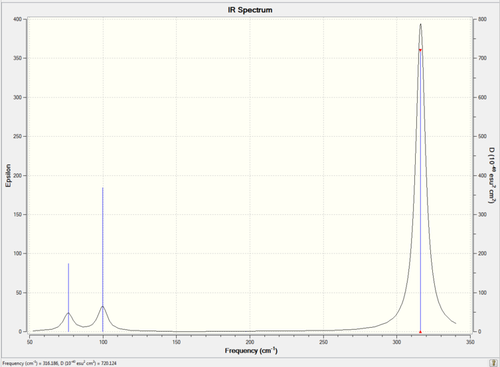
Figure 32. Infrared Spectrum of Vibrating Cis-BrClAl(μ-Cl2)AlClBr Molecule
 = Chlorine
  = Bromine
  = Aluminium
Trans-BrClAl(μ-Cl2)AlClBr Infrared Spectrum
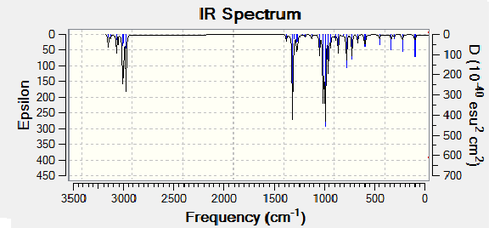
Figure 33. Infrared Spectrum of Vibrating Trans-BrClAl(μ-Cl2)AlClBr Molecule
 = Chlorine
  = Bromine
  = Aluminium
BrClAl(μ-Br,Cl)AlCl2 Infrared Spectrum

Figure 34. Infrared Spectrum of Vibrating BrClAl(μ-Br,Cl)AlCl2
 = Chlorine
  = Bromine
  = Aluminium
Infrared Spectra Analysis
| Isomer Name | Symmetry Group | Number of IR Inactive Stretches | Number of IR Active Stretches |
|---|---|---|---|
| Cl2Al(μ-Br2)AlCl2 | D2h | 10 | 8 |
| Cis-BrClAl(μ-Cl2)AlClBr | C2v | 3 | 15 |
| Trans-BrClAl(μ-Cl2)AlClBr | C2h | 9 | 9 |
| BrClAl(μ-Br,Cl)AlCl2 | C1 | 0 | 18 |
All four of the Al2Br2Cl4 isomers contain eight atoms and as a result there are 18 vibrational modes (3N-6, N=8) for each isomer. Isomer 1 has the least number of infrared active vibrational modes because ten of the vibrational modes do not have a dipole moment and so they are IR inactive and therefore have an intensity of zero. Isomer 4 on the other hand has the most infrared active vibartional modes because all of the vibrational modes result in a change in dipole moment and so all have an intensity greater than zero. Another interesting point worth mentioning is the fact that the cis isomer has fifteen infrared active vibrational modes whereas the trans isomer has only nine infrared active vibrational modes. The reason behind this difference is explained in the text below.
In order for a vibrational mode in a molecule to be infrared active it must be associated with a change in dipole moment. A permanent dipole is not necessary, as the rule requires only a change in dipole moment. The vibrational frequency of a molecule is also proportional to the force constant as illustated in the equation below:

This equation indicates that the stronger the bond between atoms in a molecule the faster the vibration will be. In the context of the Al2Br2Cl4 molecule it is evident from the vibrational data above that the Al-Br bonds in the terminal positions are much stronger than that of the Al-Br bonds in the bridging positions.
The Al2Br2Cl4 molecule above has four different infrared spectra which each spectrum corresponding to one of the four stereoisomers that the molecule adopts. The reasoning behind each stereoisomer illustrating different spectral bands is as a result of the different relative positions of the chlorine and bromine atoms in the four isomer molecules which has a considerable impact on the vibrations of the molecule despite the fact that the isomers all have the same empirical formulae and structure.
The main peaks which arise in each spectrum are as a result of the infrared active vibrational modes (stretching and deformation) of each stereoisomer which have and intensity greater than zero. These infrared active vibrational modes lead to a change in molecular dipole moment and as a result appear as distinct peaks in each of the spectra.
From the spectra above it is clear that the Cis-BrClAl(μ-Cl2)AlClBr and Trans-BrClAl(μ-Cl2)AlClBr have identical spectra due to the fact that they are almost identical structurally with the only difference being the position of a bromine and chlorine atom in each isomer.
The main difference between the isomers and consequently the spectra of the Cis-BrClAl(μ-Cl2)AlClBr and Trans-BrClAl(μ-Cl2)AlClBr isomers arises due to the stretching infrared active vibrational mode (461cm-1) of the Cis-BrClAl(μ-Cl2)AlClBr isomer which is not active in the Trans-BrClAl(μ-Cl2)AlClBr isomer as the vibrational mode (459cm-1) is perfectly symmetric and therefore no change in dipole moment occurs. Therefore only a distinct peak (Intensity = 34.5) appears on the cis-isomer spectrum and not the trans-isomer spectrum (Intensity = 0.00). Although this vibrational mode results in a minor difference between the two spectra, in general both the symmetric isomers have few distinct peaks.
The lack of disctinct peaks is a common feature of symmetric isomers due to the fact that a consequence of having a highly symmetretical molcule is that the number of infrared active vibrational modes is reduced considerably. This is illustrated in the spectra above as the Cl2)Al(μ-Br2)AlCl2 isomer and the BrClAl(μ-Br,Cl)AlCl2 isomer has considerably more peaks than that of the more symmetric Cis-BrClAl(μ-Cl2)AlClBr and Trans-BrClAl(μ-Cl2)AlClBr isomers.
Comparison of Relative Energies
| Molecule | Energy/a.u | Energy/KJ mol-1 | Relative Energy/KJ mol-1 |
|---|---|---|---|
| Cl2Al(μ-Br2)AlCl2 | -2352.40630798 | -6176242.762 | 26.23 |
| Cis-BrClAl(μ-Cl2)AlClBr | -2352.41626677 | -6176268.908 | 0.08 |
| Trans-BrClAl(μ-Cl2)AlClBr | -2352.41629858 | -6176268.992 | 0 |
| BrClAl(μ-Br,Cl)AlCl2 | -2352.41109944 | -6176255.342 | 13.65 |
The energies of the minima were recorded from the optimisation analysis which was carried out for each isomer of the Al2Br2Cl4 molecule.
These energies were then compared in order to determine the stability of the isomers. It is evident from the data and that the Trans-BrClAl(μ-Cl2) isomer had the lowest energy since it had the most negative value.
The energies of the minima are determined by:
1) The atoms that take up the μ-bridging positions
2) The electronegativity of these atoms that take up the μ-bridging positions.
The three isomers which have the chlorine atoms in the μ-bridging positions have a closer energy. Since the bromine atom is larger and hence has more diffuse orbitals than the chlorine atoms, the extent of the orbital overlap is much less and and as a result the bonding is much weaker.
Dissociation Energy Calculation
| Molecule | Energy/a.u |
|---|---|
| Cl2Al(μ-Br2)AlCl2 | -2352.40630798 |
| Cis-BrClAl(μ-Cl2)AlClBr | -2352.41626677 |
| Trans-BrClAl(μ-Cl2)AlClBr | -2352.41629858 |
| BrClAl(μ-Br,Cl)AlCl2 | -2352.41109944 |
From the calculated energies shown above it is clear that the most stable isomer is the trans-BrClAl(μ-Cl2)AlClBr because it has the lowest energy. The trans-BrClAl(μ-Cl2)AlClBr isomer is composed of two AlBrCl2 monomer fragments . The chlorine atom in one of the monomer fragments acts as a electron donor(Lewis Base) and the aluminium atom in the other fragment act as an electron acceptor and is the conjugate Lewis acid to the chlorine atom.
The isomer is stabilised by the interaction between the electron donor atom and electron acceptor atom which results in the formation of two chlorine μ-bridging atoms between the aluminum atoms in each monomer.
The dissociation energy of Trans-BrClAl(μ-Cl2)AlClBr is calculated by subtracting the sum of two monomer energies from the isomer energy:
ΔE = EIsomer + 2EMonomer
ΔE = (-2352.41629858) + 2(-1176.190136978)
ΔE = -0.036024624 a.u
Edissociation = -94.58 KJmol-1
The positive value of the dissociation energy suggests that the isomer is in fact more stable than the individual monomers.
AlBrCl2 Optimization

Figure 35. A Gaussview image of an optimized AlBrCl2 molecule
After an initial basis set of 3-21G was set, a calculation involving a medium level basis set (GEN) was chosen along with a DFT method and B3LYP hybrid functional.
Results from the Log. File1AlBrCl2 and gaussview summary provided below:
D Space: http://hdl.handle.net/10042/23794
| Parameters | |
|---|---|
| File Type | .log |
| Calculation Type | FOPT |
| Calculation Method | RB3LYP |
| Basis Set | GEN |
| Charge | 0 |
| Spin | Singlet |
| Total energy(a.u.) | -1176.190136978 a.u |
| RMS Gradient(a.u.) | 0.00000291 a.u |
| Dipole Moment(Debye) | 0.1134 |
| Point Group | C2h |
| Time taken | 0 minutes 47.8 seconds |
The optimization data for the medium level basis set (GEN) confirms that the forces are converged. The data also tells us that the placements are converged, which means that for a small displacement the energy does not change. This therefore shows that the optimization is complete.
        Item               Value     Threshold  Converged?
Maximum Force            0.000005     0.000450     YES
RMS     Force            0.000002     0.000300     YES
Maximum Displacement     0.000022     0.001800     YES
RMS     Displacement     0.000012     0.001200     YES
Predicted change in Energy=-1.397815D-10
Optimization completed.
   -- Stationary point found.
The data from the gaussview summary and Log. File1AlBrCl2 indicates that the optimization at the initial basis set has been completed.
AlBrCl2 Frequency Analysis
A vibrational analysis was carried out using the previously optimised AlBrCl2 structure (DFT, B3LYP, GEN).
Results from the Log. File1AlBrCl2freq:
D Space: http://hdl.handle.net/10042/23794
The low frequency values have been extracted from the corresponding output file and show that the frequency calculation is complete:
Low frequencies ---   -2.4223   -0.0053   -0.0042   -0.0041    2.7464    2.9629
Low frequencies ---  120.5194  133.8347  185.7791
      Item               Value     Threshold  Converged?
Maximum Force            0.000008     0.000450     YES
RMS     Force            0.000003     0.000300     YES
Maximum Displacement     0.000021     0.001800     YES
RMS     Displacement     0.000009     0.001200     YES
Predicted change in Energy=-1.460239D-10
Optimization completed.
   -- Stationary point found.
GradGradGradGradGradGradGradGradGradGradGradGradGradGradGradGradGradGrad
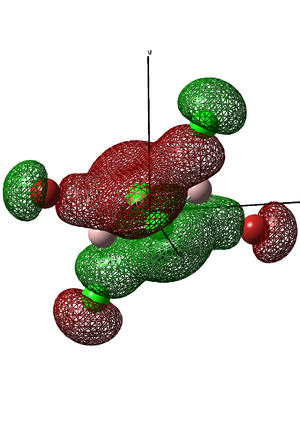
Molecular Orbital Analysis
The table below shows five molecular orbitals associated with the trans isomer of the Al2Br2Cl4 molecule. The molecular orbitals are explained in terms of:
•Whether the atomic orbital interactions are strong or weak...
•Whether the atomic orbital interactions are bonding or antibonding...
•Whether there are any through space interactions...
•How many nodes there are...
•How delocalised the MO is...
References
1.↑ M. Schuurman, W. Allen, H. Schaefer, Journal of Computational Chemistry, 2005, 26, 1106
2.↑ J. Blixt et al., J. Am. Chem. Soc. , 117, 1995, pp 5089 - 5104
3.↑ M. Anatosov et al., J. Phys. Chem. , 105, 2001, pp 5450 - 5467
4.↑ Paula, Peter Atkins, Julio de (2009). Elements of physical chemistry (5th ed. ed.). Oxford: Oxford U.P. pp. 459. ISBN 978-0-19-922672-6.
5.↑ Iijima, K. et al., <it> Chem. Lett. </it>, 1983, 251
6.↑ Bondi (1964) J. Phys. Chem. 68, 441


