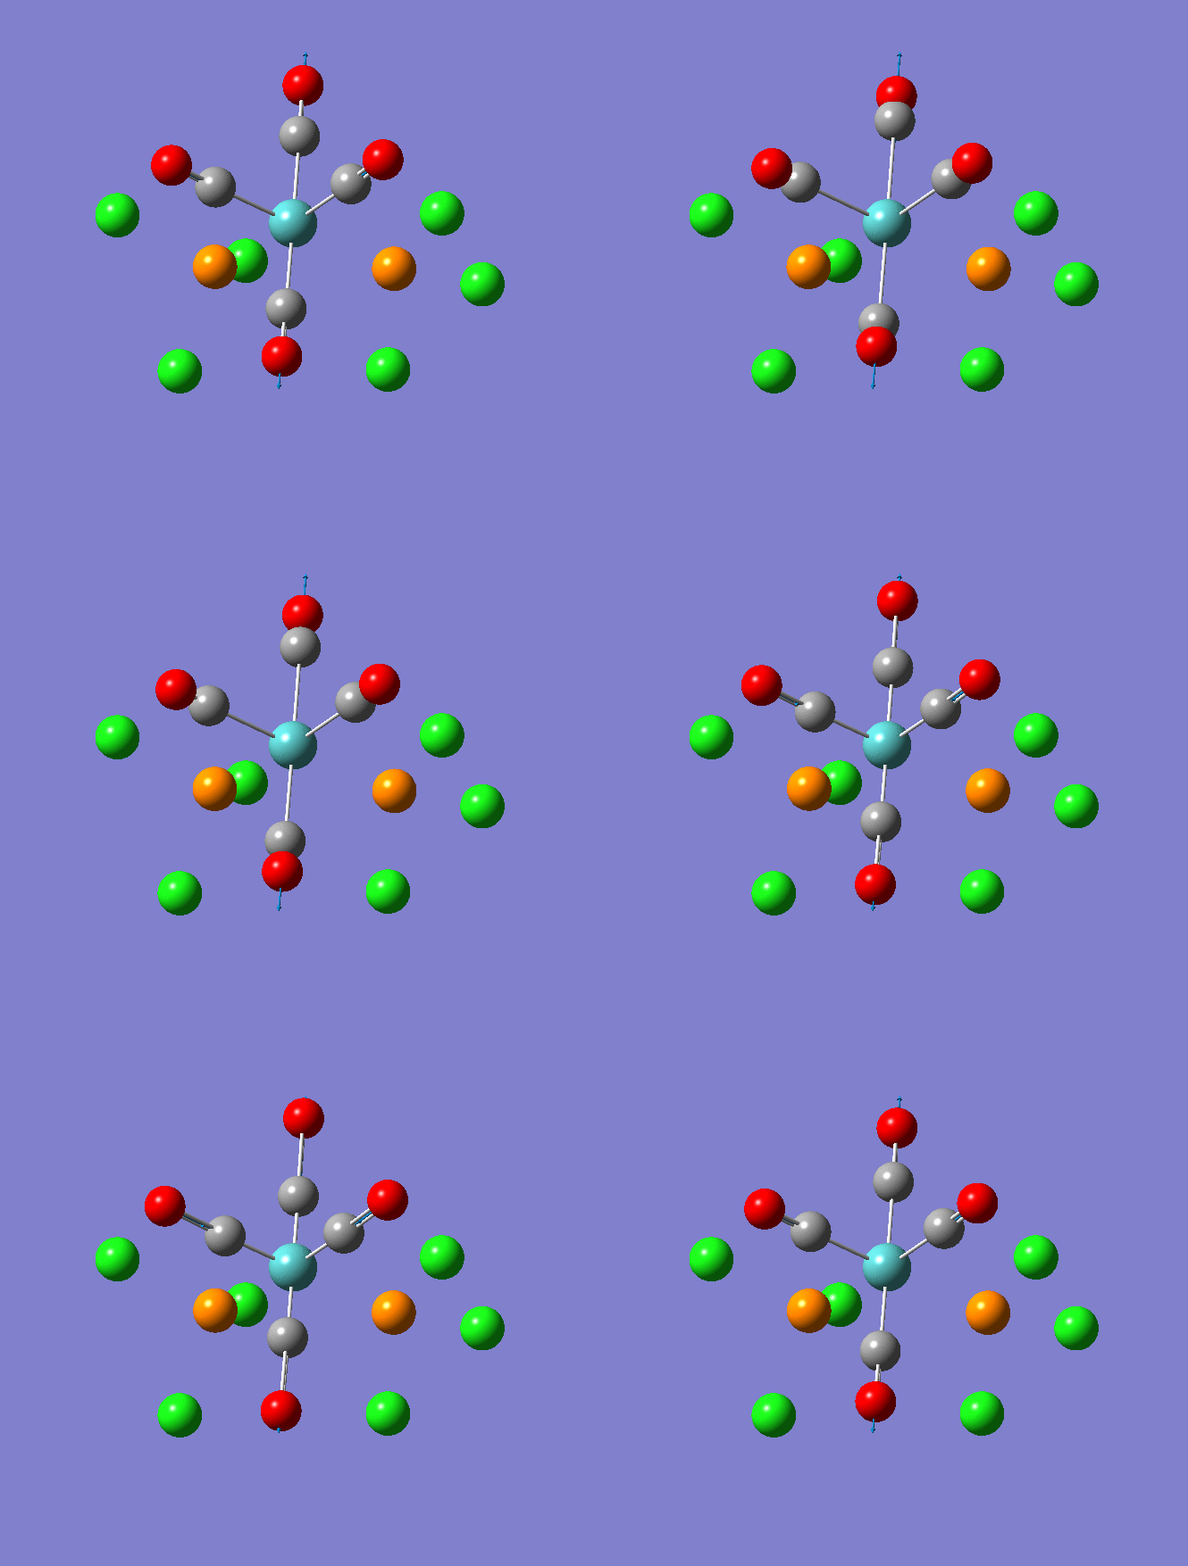
Rep:Mod:Inorganicrg1709
Module 2: Inorganic Computational Laboratory
Thallium(III) tribromide: TlBr3
Through modelling TlBr3 using the optimisation B3LYP method with LanL2DZ basis set in Guassian it is possible to determine key information about TlBr3. For example the optimised bond length of each Tl-Br bonds in TlBr3 was determined to be 2.65Â and the optimised Br-Tl-Br bond angle was found to be 120o. This is key information about TlBr3 which can quickly and easily be determined by computational methods.
The Jmol view of TlBr3 can be viewed here.
TLBR3_OPT |
The important information from the optimisation process of TlBr3 in Guassian is shown below.
| Item | Value | Threshold | Converged? |
| Maximum Force | 0.000002 | 0.000450 | YES |
| RMS Force | 0.000001 | 0.000300 | YES |
| Maximum Displacement | 0.000022 | 0.001800 | YES |
| RMS Displacement | 0.000014 | 0.001200 | YES |
| Predicted change in Energy=-6.083D-11 | |||
| Optimization completed. | |||
| -- Stationary point found. | |||
| ---------------------------- | |||
| ! Optimized Parameters ! | |||
| ! (Angstroms and Degrees) ! | |||
| -------------------------- -------------------------- | |||
| ! Name Definition Value Derivative Info. ! | |||
| -------------------------------------------------------------------------------- | |||
| ! R1 R(1,2) 2.65 -DE/DX = 0.0 ! | |||
| ! R2 R(1,3) 2.65 -DE/DX = 0.0 ! | |||
| ! R3 R(1,4) 2.65 -DE/DX = 0.0 ! | |||
| ! A1 A(2,1,3) 120 -DE/DX = 0.0 ! | |||
| ! A2 A(2,1,4) 120 -DE/DX = 0.0 ! | |||
| ! A3 A(3,1,4) 120 -DE/DX = 0.0 ! | |||
| ! D1 D(2,1,4,3) 180 -DE/DX = 0.0 ! | |||
The full optimisation report can be viewed here. File:TLBR3_OPTIMISATION_textreport.txt
The 2.65Â Tl-Br bond length as opitimised through the method described above is very similar to a literature value of 2.51Â (within 0.14Â), as determined by X-ray diffraction measurements of TlBr3 [1]. This suggests that the computational methods used here are reasonable.
- ↑ J. Glaser and G. Johansson, Acta. Chemica Scandinavica, 1982, 36, p125 - 135, http://actachemscand.dk/pdf/acta_vol_36a_p0125-0135.pdf
Frequency Analysis of TlBr3
It is possible to confirm that the strucutre proposed above is a minima by frequency analysis using GaussView. The method used to perform this analysis was DFT 'B3LYP' using basis set 'LanL2DZ'. This is the same method and basis set as for the optimisation of TlBr3 which is important because it is only possible to compare computed relative energies from the same molecule where the energies have been computed using the same conditions. It would not make sense to compare computed energies created by different methods.
Frequency analysis is required to determine the if this TlBr3 molecule has been fully optimised because this vibration analysis is the second derivative of the potential energy surface, therefore if all of the vibrational frequencies are positive the molecule is at a minimum on the potential energy surface (i.e. in the ground state optimial structure).
The low frequencies that are caused by the motion of the centre of mass of a TlBr3 molecule are listed here (cm-1): -3.4213, -0.0026,-0.0004, 0.0015, 3.9367 and 3.9367. The lowest 'real' normal vibration mode occurs at 46.43 cm-1. This corresponds to a symmetric bending mode of vibration. The full list of vibrations frequencies are listed here (cm-1): 46.43, 46.43, 52.14, 165.3, 210.7 and 210.7.
The output file showing the full vibrational analysis of TlBr3 is shown here.File:TLBR3_Frequency.txt
Some structures in gaussview are not drawn with bonds that were expected. This does not mean that there is no bonding interactions between interacting nuclei and electrons within a molecule/complex. In many molecules or complexes 2-centre-2-electron bonds are not accurate representations of the nature of the 'bonding' present in certain species. In such species molecular orbtials often describe the bonding better than conventional 2-centre-2-electron bonds. Therefore just because guassview does not show a bond between two atoms does not mean that there is no bonding interaction the two atoms.
A chemical bond is where there is attractive interactions between electron density situated between two or more nuclei. This results in a sharing of electron density between nuclei. This can most accurately be described by Molecular Oritbal Theory, instead of using conventional 2-centre-2-electron bonds. (Ionic bonding is different where the attraction between oppositely charged ions is purely coulombic and the electron density is not shared between nuclei).
Borane: BH3
- Opitimisation
Borane, BH3, can easily be optimised using GuassView. The Jmol of the optimised strucutre of BH3 is shown below.
Opitimised BH3 |
These important details of the opitimisation report are shown below.
| Item | Value | Threshold | Converged? |
| Maximum Force | 0.000413 | 0.000450 | YES |
| RMS Force | 0.000271 | 0.000300 | YES |
| Maximum Displacement | 0.001610 | 0.001800 | YES |
| RMS Displacement | 0.001054 | 0.001200 | YES |
| Predicted change in Energy=-1.072D-6 | |||
| Optimization completed. | |||
| -- Stationary point found. | |||
| ---------------------------- | |||
| ! Optimized Parameters ! | |||
| ! (Angstroms and Degrees) ! | |||
| -------------------------- -------------------------- | |||
| ! Name Definition Value Derivative Info. ! | |||
| -------------------------------------------------------------------------------- | |||
| ! R1 R(1,2) 1.19 -DE/DX = 0.0004 ! | ! R2 R(1,3) 1.19 -DE/DX = 0.0004 ! | ||
| ! R3 R(1,4) 1.19 -DE/DX = 0.0004 ! | |||
| ! A1 A(2,1,3) 120 -DE/DX = 0.0 ! | |||
| ! A2 A(2,1,4) 120 -DE/DX = 0.0 ! | |||
| ! A3 A(3,1,4) 120 -DE/DX = 0.0 ! | |||
| ! D1 D(2,1,4,3) 180 -DE/DX = 0.0 ! | |||
The full optimisation report can be viewed here.File:BH3_opitimisation1.txt
- Vibrational analysis of BH3 (IR Spectrum)
Further vibrational analysis can be conducted also using GuassView to examine the different vibrational modes of BH3. A summary of the vibrational modes present in BH3 are shown in the table below.
| Number | Form of Vibration | Frequency (cm-1) | Intensity | Symmetry (D3h point group) |
| 1 | All hydrogen atoms oscilate in a concerted fashion between opposite faces of the boron atom | 1140 | 93 | A1 symmetric bend |
| 2 | 2 hydrogen atoms bend towards each other while the 3rd is stationary | 1200 | 12 | E symmetric bend |
| 3 | 2 hydrogen atoms bend towards each other while the 3rd bends | 1200 | 12 | E asymmetric bend |
| 4 | All hydrogen atoms stretch in concerted fashion with boron atom at the centre | 2600 | 0 | A1 symmetric stretch |
| 5 | 2 hydrogen atoms stretch out of phase while the 3rd is stationary | 2740 | 104 | E asymmetric stretch |
| 6 | 2 hydrogen atoms stretch in phase while the 3rd stetches out of phase | 2740 | 104 | E asymmetric stretch |

An animation of the A1 symmetric stretch is shown here.
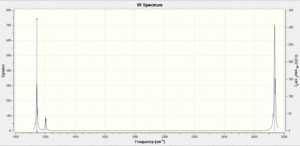
The IR spectrum as calculated through GuassView is shown here.
This spectrum does not show all of the six calculated vibrational modes, instead only 3 are observed. This is because some of the vibrations modes are degenerate and therefore the absorption bands will occur at the same frequency of the spectrum, for example the bending modes at 1203.64 cm-1. The totally symmetric stretch at 2598.42 cm-1 is also not observed in this spectrum because it has zero intensity. This is because the intensity of the absorption bands is proportional to the change in dipole moment caused by the vibration mode. The totally symmetric stretch does not cause a change of dipole moment in the BH3 unit therefore it will not be observed in the IR spectrum.
- Natural Bond Order Analysis
Through Bond Order Analysis in GaussView it is possible to determine the charge distribution of a BH3 molecule. The result shows that the boron atom is partially positivity charged of 0.333 while each hydrogen is partially negatively charged with -0.111. Thid supports the idea that BH3 acts as a lewis acid, electron acceptor, at the boron atom. This distribution is shown here.
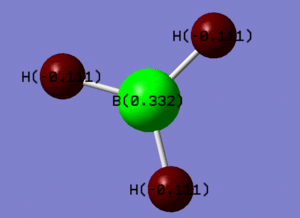
The file showing the natural bond order analysis of BH3 can be found here.http://hdl.handle.net/10042/to-13011
MO diagram of BH3
Using molecular orbital theory it is possible to predict the molecular orbitals expected for BH3. Using computational methods it is possible to model the real molecular orbitals and compare to the theory. The diagram shown below shows the predict molecular orbital diagram of BH3 along with also the computed molecular orbitals showing the electron density surfaces.
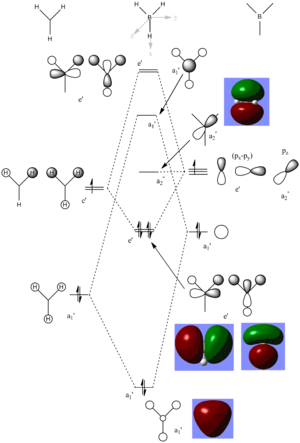
This diagram shows that there is little predict MOs via LCAO and the 'real' computed MOs of BH3. All of the predicted a1', e' and a2 MOs are very similar to the computed MOs. The computed MOs show more a delocalised picture of the electron density compared to the predict MOs via LCAO however they both have a similar shape and size of the orbitals.
This shows that qualitative MO analysis is reasonably accurate to understand the electron distribution within simple molecules like BH3. However with more complex molecules qualitative analysis becomes harder appreciate as a LCAOs will not give an accurate picture of the electron density. So qualitative MO analysis is very useful and effective for simple molecules.
Isomers of Mo(CO)4L2
Mo(CO)4L2 can have either a trans or cis geometry, where L=PCl3. Both of these isomers where optimised by using the B3LYP method with LANL2MB basis set in GuassView submitting to SCAN.
These results can be found below.
Initial Opitimisation:trans-Mo(CO)4(PCl3)2: http://hdl.handle.net/10042/to-13024
Initial Opitimisation:cis-Mo(CO)4(PCl3)2: http://hdl.handle.net/10042/to-13025
GuassView has not included the Cl-P bonds or Mo-P bonds for these isomers as it does not recognise them as 'formal' bonds.
To fully optimise the dihedral angles the precise starting orientation of the ligands needs to be carefully controlled so that the lowest energy minima is found. The conditions used to carefully control the dihedral angle optimistaion were again using B3LYP but with a more accurate basis set of LANL2DZ in GuassView computing the data via SCAN.
These results can be found below.
Dihedral Angle Optimisation: trans-Mo(CO)4(PCl3)2: http://hdl.handle.net/10042/to-13032
Dihedral Angle Optimisation: cis-Mo(CO)4(PCl3)2: http://hdl.handle.net/10042/to-13031
Optimised trans-Mo(CO)4(PCl3)2
Opitimisied Trans Structure |
Optimised cis-Mo(CO)4(PCl3)2
Opitimisied Trans Structure |
Again GuassView has not included formal Cl-P or Mo-P bonds.
To check that the dihedral angle optimisation has resulted in the location of the global minmia for both complexes vibrational analysis has been conducted on the dihedral angle optimised structures. Again the method used was B3LYP with a basis set of LANL2DZ but this time to determine the frequency of vibrations instead of optimisation.
These results can be found below.
Frequency Analysis: trans-Mo(CO)4(PCl3)2: http://hdl.handle.net/10042/to-13045
Frequency Analysis: cis-Mo(CO)4(PCl3)2: http://hdl.handle.net/10042/to-13044
All of the frequencies computed for both the cis and trans complexes are positive and therefore this confirms that these complexes have truely been optimised to a global minima.
- Analysis of Results for Mo(CO)4(PCl3)2 complexes
Structure
Both the cis and trans geometries of Mo(CO)4(PCl3)2 have interesting geometrical structures (which can be view in the Jmols below). The Mo-P bond length in the trans complex was computed to be 2.44Â while the Mo-P bonds in the cis complex were established to be slightly longer at 2.51Â. Both of these values are very similar to the 'expected' literature values of between 2.3-2.4Â for Mo-PCl3 bonds[1]. It makes sense that the Mo-P bonds in the cis complex are slightly longer than the trans complex because the PCl3 ligands are large bulky groups that occupy alot of space. Therefore in the cis complex the Mo-PCl3 bond needs to be slightly larger to avoid these unfavourable steric clashing of the cis PCl3 ligands which is not a problem in the trans complex.
The P-Cl bonds are slightly shorter in the cis complex, by 0.01Â, compared to the P-Cl bond length in the trans complex. Again these slightly shorter P-Cl bonds minimises steric clashing between the cis PCl3 ligands which are not present in the trans complex.
Interestingly the Cl-P-Cl bond angles in the trans complex are all equal at 99.2o while in the cis complex the Cl-P-Cl bond angles are all slightly different ranging between 98.8o and 100.2o. These values are again very similar to the literature value of 98.3o [2]. This difference between the cis and trans isomers is expected to minimise the steric clashing between the two PCl3 ligands in the cis complex while there is more space in the trans complex for the chlorine atoms to spread out resulting in equal Cl-P-Cl bond angles.
- ↑ E.C. Alyea and S. Song, Inorg. Chem., 1995, 34, p3864 - 3873, http://pubs.acs.org/doi/pdf/10.1021/ic00119a006
- ↑ E.C. Alyea and S. Song, Inorg. Chem., 1995, 34, p3864 - 3873, http://pubs.acs.org/doi/pdf/10.1021/ic00119a006
Energy
The isomer with the greatest (most negative) predicted change in energy is the trans isomer (-6.96 x10⁻⁸ Hartrees, compared to the 1-1.16 x10⁻⁸ Hartrees for the cis complex). This suggest that the trans isomer is more stable than the cis isomer. This makes sense because there is less steric clashing betwee the bulky PCl3 ligands in the trans isomer. In addition to this there is likely to be an electronic term that favour the trans geometry instead of the cis geometry. This electronic term is likely to be similar to the trans-effect which as an effect in the cis complex but not the trans complex. This is because σ donation of electrons by the PCl3 ligand into the Mo d-orbitals can be donated then be donated by the Mo into the trans π* oribital of the carbonyl ligand. This makes the Mo-P bond in the cis complex weaker (i.e. longer) compared to the Mo-P bond in the trans complex as there is no trans interactions between the PCl3 and carbonyl ligands (i.e. the PCl3 and the caronyl ligands do not bond via the same d-orbital of Mo).
The energy difference between the two isomers has been calculated to be 1.4 x10⁻⁴ kJ mol-1. This is a comparatively small (by several orders of magnitude) to the thermal energy available at room temperature ~2.5 kJ mol-1, which suggests that isomerisation between the cis and trans form of Mo(CO)4(PCl3)2 is a facile process and readily occurs at room temperature.
By altering the halogen atom present in the PCl3 group to PF3 the most stable isomer may shift to favour trans isomers as there will be less unfavourable steric clashes between the PF3 ligands compared to the PCl3 ligands due to their size difference. However changing the halogen of the PX3 group will also have an electronic effect on the stability of both of the isomers.
IR Analysis
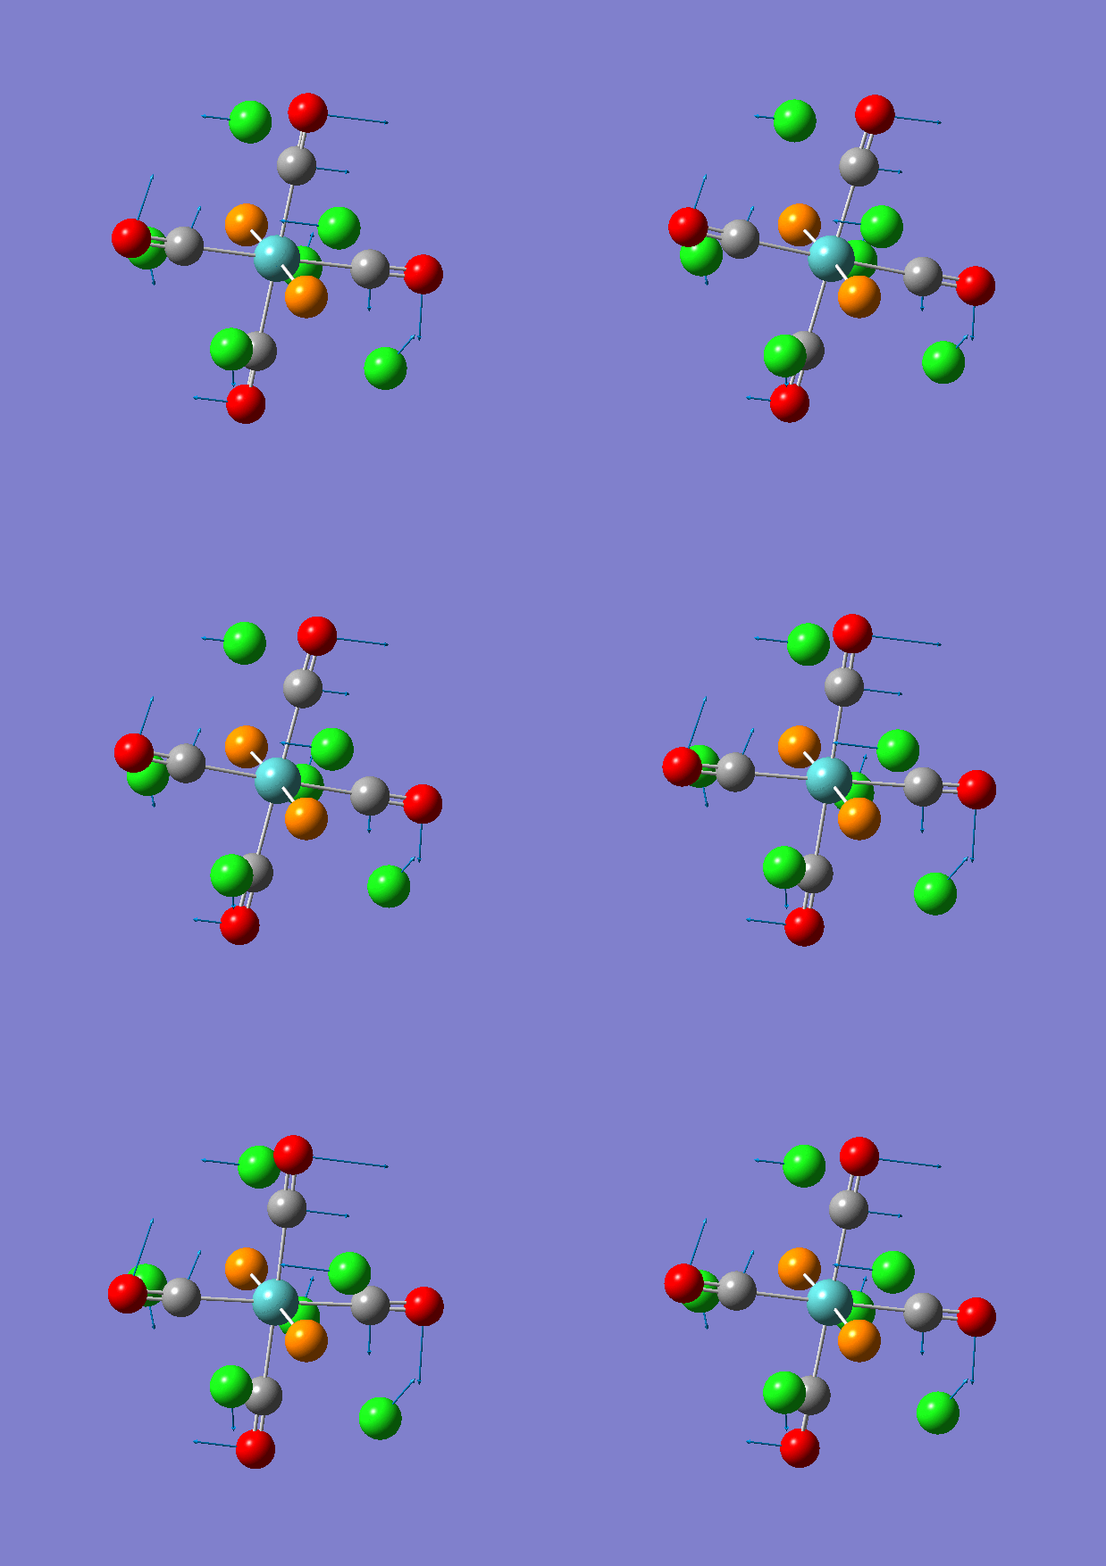
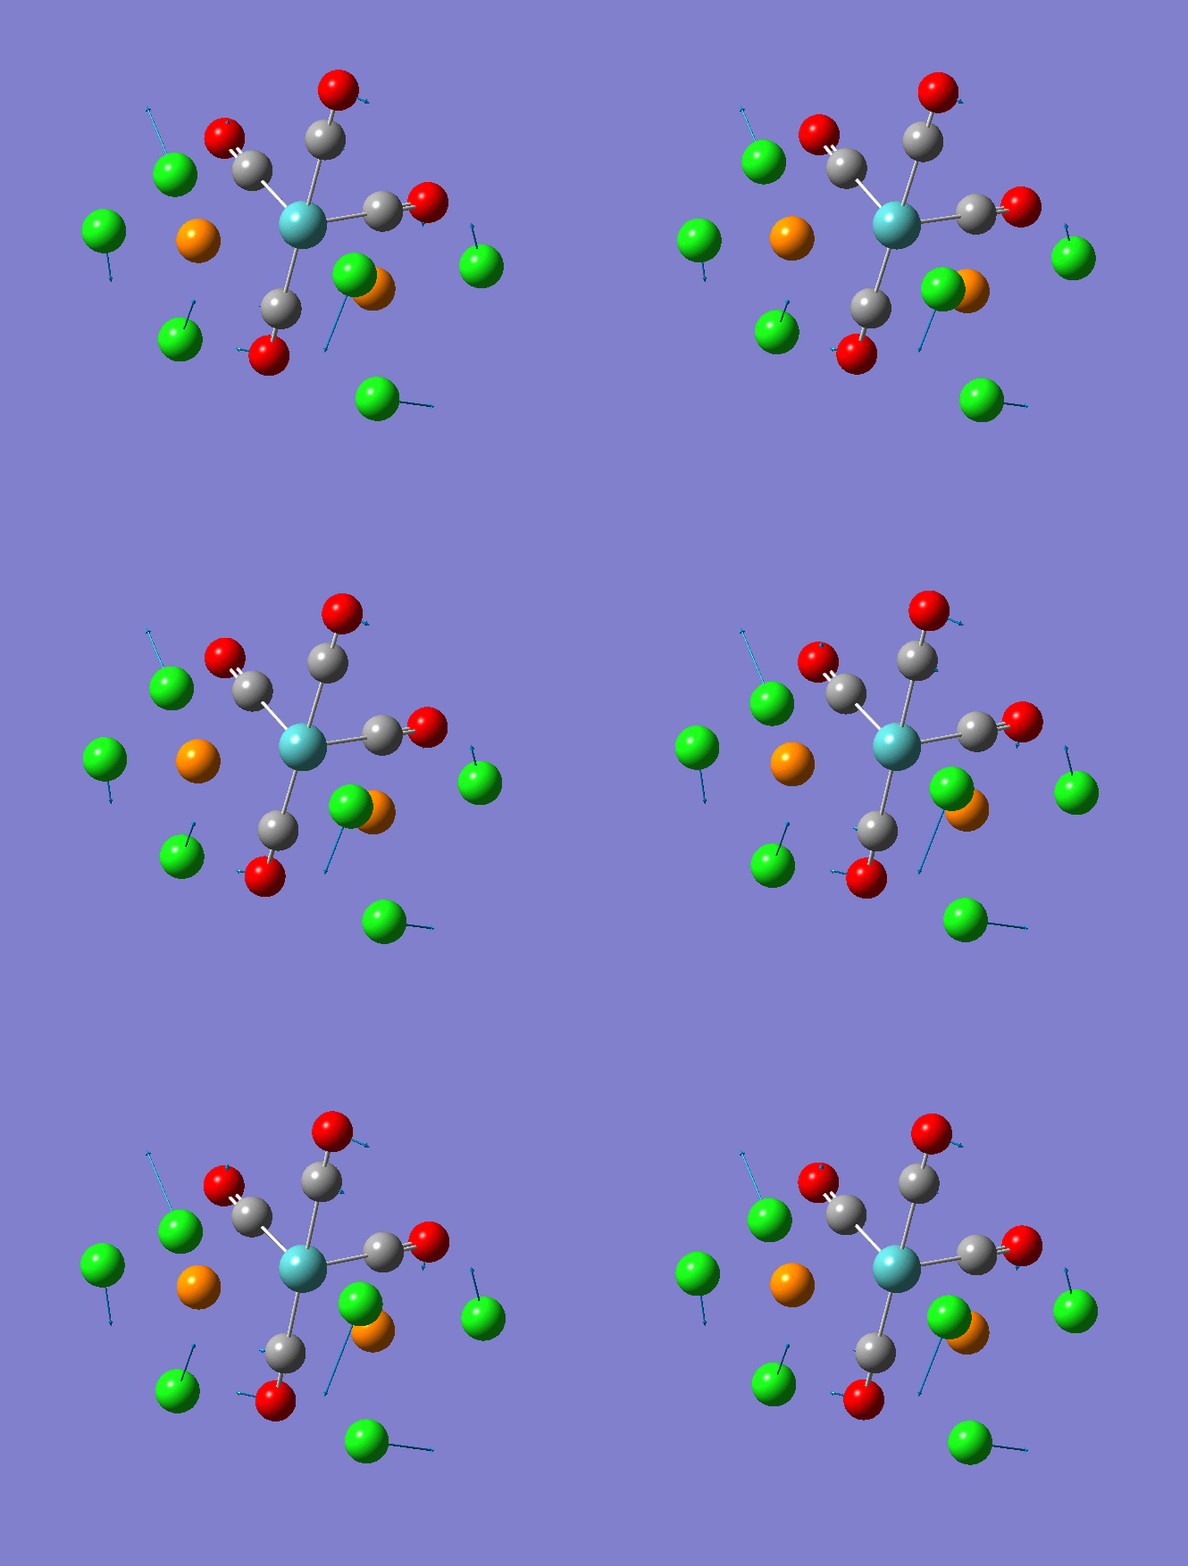
None of the vibrations of either the cis or trans complex have a negative frequency or a frequency very close to zero which suggests that these structure are fully optimised. The lowest frequency vibrations for both the cis and trans complexes are around 10cm-1. These low energy vibrtaions correspond to rotations of certain group within each complex which requires only a small amount of energy. As only a small amount of energy is required to cause these rotational modes this suggests that they will readilly occur at room temperature as there is enough thermal energy to activiate these vibrational modes.
This indicates that the PCl3 ligands are purely acting as σ donor ligands where no backbonding from the metal is present. This is because π donor ligands (with or without backbonding from the metal) would not be able to freely rotate due to the constrained bonding geometry that is imposed on these ligands.
Low frquency vibration (rotation of PCl3 ligands) at 5cm-1 of trans-Mo(CO)4(PCl3)2.
Low frquency vibration (rotation of PCl3 ligands) at 10cm-1 of cis-Mo(CO)4(PCl3)2.
Carbonyl stretching frequencies
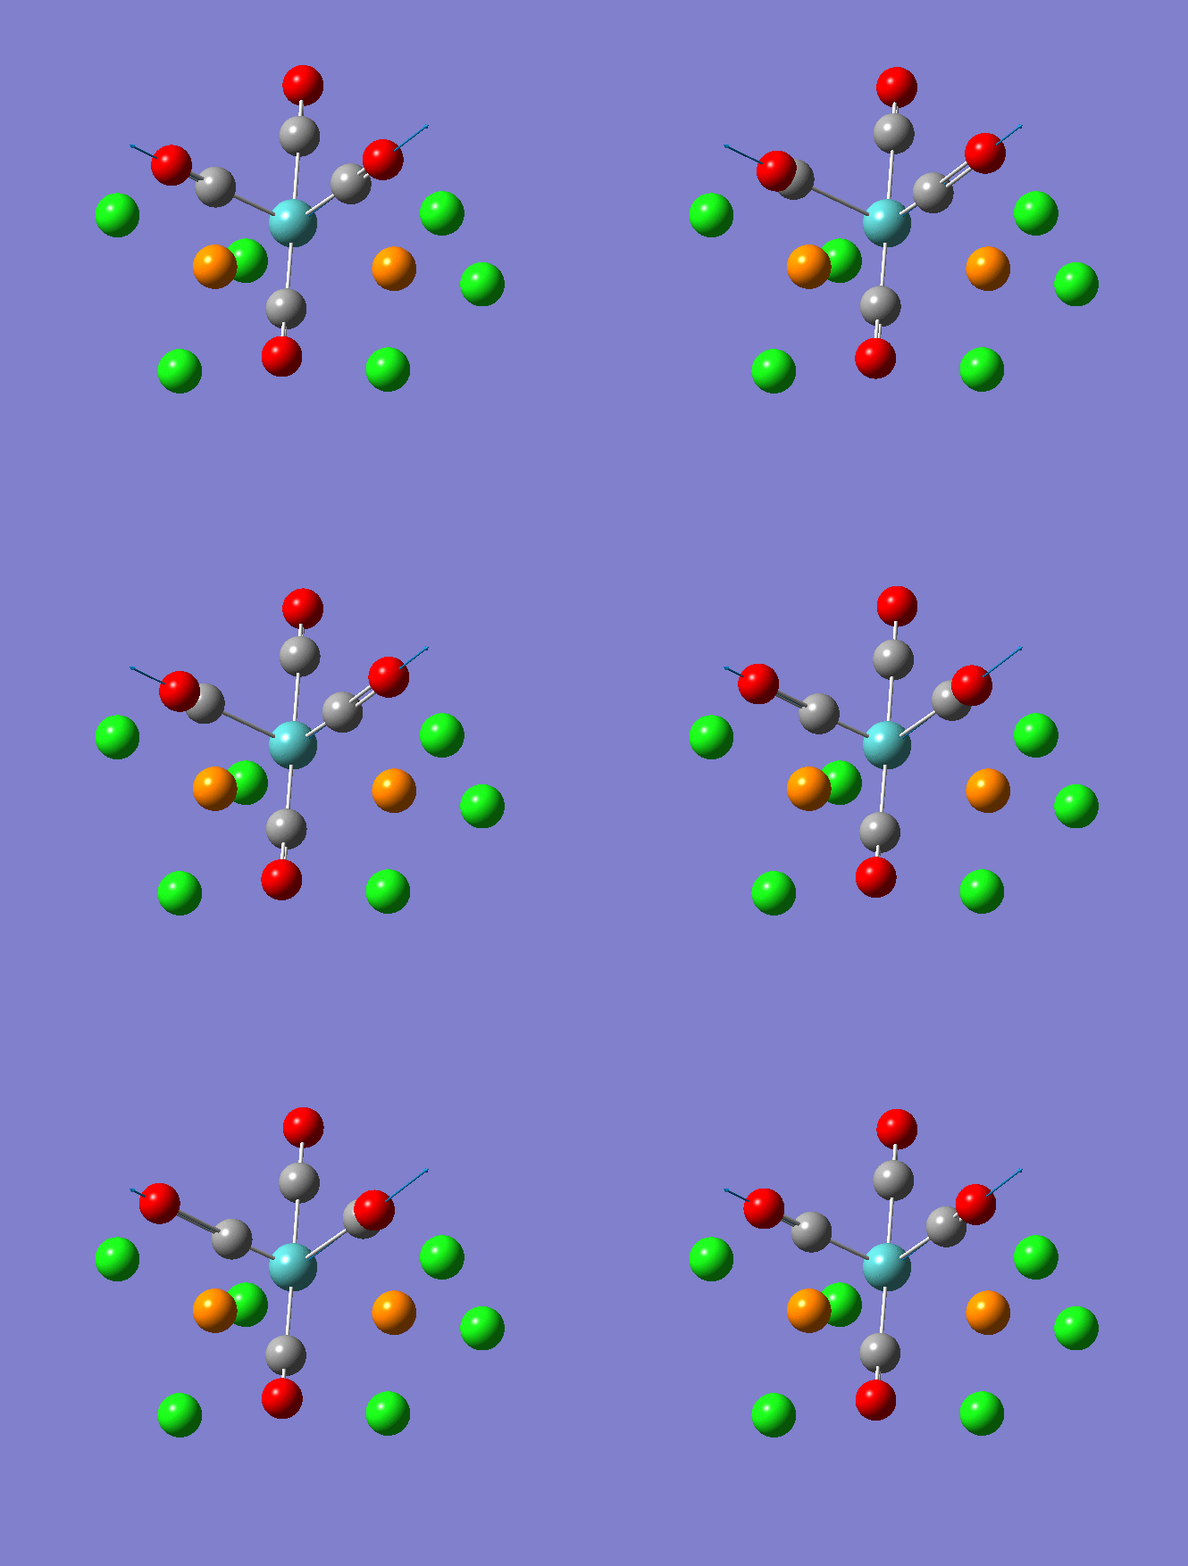
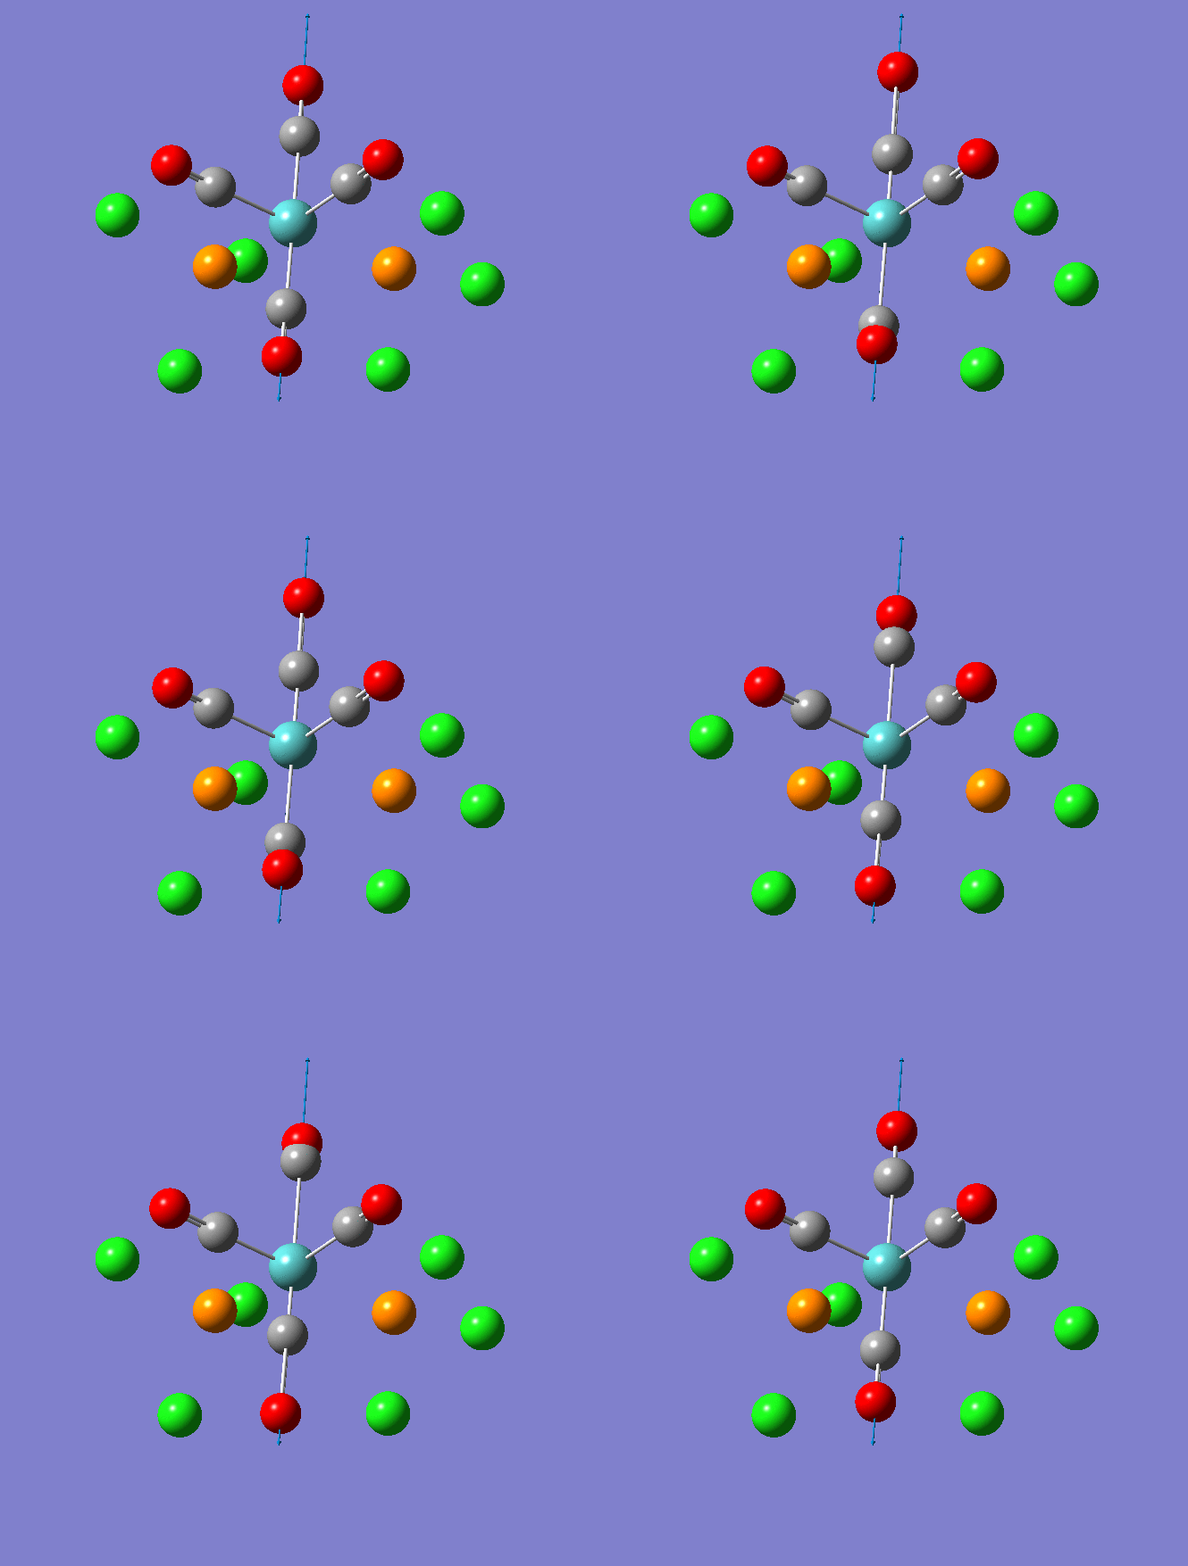
Both the cis and the trans complexes have 4 different vibrational stretching modes for the carbonyl ligands. There are two symmetric stretches for pairs of the carbonyl groups (B1 and B2) and then there is a totally symmetric stretch where all four carbonyl ligands stretch in phase with each other (A12) and also an antisymmetric stretch where the carbonyl pairs stretch out of phase with each other (A11).
The stretching frequencies of the carbonyls are very similar for both the cis and trans complexes. The difference between the cis and trans complexes is that only two of the vibrational modes cause a change in dipole moment for the trans complex (B1 and B2) so only these two absorption bands appear are active in the IR spectrum of the trans complex. However since the stretching frequencies of the B1 and B2 stretches are very similar, due to the symmetry of the trans complex, only one absorption band is visble in the real spectrum of the trans complex as both the B1 and B2 stretches overlap.

The computed C=O stretching frequencies for the trans complex are shown below.
| Wavenumber (cm-1) | Intensity | Assignment |
|---|---|---|
| 1950 | 1475 | B2 |
| 1950 | 1466 | B1 |
| 1977 | 1 | A11 |
| 2031 | 4 | A12 |
The cis complex, on the other hand, has 4 active vibrational stretching modes which cause a change in dipole, so there should be 4 absorption bands in the spectrum of the cis complex. However, similar to the trans complex, the B1, B2 and A11 stretches are very similar in energy so they overlap in the real IR spectrum of the cis complex. Therefore 2 absorption stretching peaks are observed in the real IR spectrum of the cis complex.
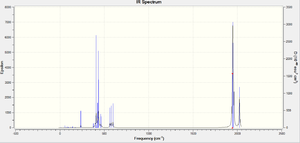
The computed C=O stretching frequencies for the cis complex are shown below.
| Wavenumber (cm-1) | Intensity | Assignment |
|---|---|---|
| 1945 | 763 | B2 |
| 1948 | 1499 | B1 |
| 1958 | 633 | A11 |
| 2023 | 597 | A12 |
Animations of the C=O stretches for the cis complex are shown below.
B2 carbonyl stretch
B1 carbonyl stretch
A11 carbonyl stretch (Out of phase)
A12 carbonyl stretch (In phase)
The computed stretching frequencies and IR spectrum of both the cis and trans complex match very similar to the literature values and spectra that are observed experimentally[1]. This indicates that the methods and basis set used to model these complexes are accurate and reliable.
- ↑ D.J. Darensbourg and R.L. Kump, Inorg. Chem., 1978, 17, 9, p2680 - p2682
Project - Comparison of Borazine with its phosphorus analogue
This project aims to investigate and compare the nature and bonding of a borazine molecule with its phosphorus analogue molecule. Chlorine atoms have been choosen as the substituent atoms for the borazine molecule and its phosphorus analogue to mimic large mesityl groups that where used by Dias and Power to measure the crystal strucuture of 2,4,6-Me3C6H2BPC6H11)3 (the phosphorous analogue of borazine)[1]. Using chlorine atoms instead of mesityl groups will cut down the computing power needed to model these molecules.
The proposed structures of borazine and the phosphorus borazine are shown below.
Chlorine substituted borazine:B3N3Cl6
Borazine |
Chlorine substituted phosphorus-borazine:B3P3Cl6
Phosphorus-Borazine |
Both of these molecules were optimised in GaussView using the B3LYP method with a basis set of 6-31g with the keywords of 'opt=loose' where the input files were sent to SCAN to process. The 6-31g basis set has been choosen because it is a medium detailed basis set so the calculations should not take extended periods of time but yet the results should still be accurate. The output files can be found here:
Initial Optimisation
B3N3Cl6: http://hdl.handle.net/10042/to-13181
B3P3Cl6: http://hdl.handle.net/10042/to-13179
To check that the resulting molecules were fully optimised the frequency analysis was performed on of both B3N3Cl6 and B3P3Cl6 using the same method and basis set as previously stated. The output files from this frequency analysis can be found here:
Initial Frequency analysis
B3N3Cl6: http://hdl.handle.net/10042/to-13185
B3P3Cl6: http://hdl.handle.net/10042/to-13186
The borazine molecule has been fully optimised as there were no negative frequencies observed. However the phosphorus-borazine molecule was not fully optimised as there were three vibrational modes that had a negative frequency with a magnitude of over 100. Therefore further optimisation was needed for B3P3Cl6 before the MOs could be calculated.
To further optimise the 3P3Cl6 structure the initial optimisation output structure underwent a further optimisation step (again using the same method and basis set) however this time with the keywords set as 'int=ultrafine scf=conver=9'. This resulted in the output optimisation strucutre that can be found here:
Second optimisation of B3P3Cl6
B3P3Cl6: http://hdl.handle.net/10042/to-13189
Again to check whether this was the final optimised structure frequency analysis was undertaken (using the same method and basis set). This time all of the observed vibrational frequencies were positive, so this structure was fully optimised. The resulting frequency analysis output file can be found here:
Second frequency analysis of B3P3Cl6
B3P3Cl6: http://hdl.handle.net/10042/to-13191
Once both of the optimised structures had been found the energies for the borazine and the phosphourus-borazine were then calculated inorder to visualise the key Molecular Orbitals for these molecules. The same method and basis set as stated previous were used with the keywords as 'pop=full'. The resulting output files can be found here:
Energy analysis
B3N3Cl6: http://hdl.handle.net/10042/to-13192
B3P3Cl6: http://hdl.handle.net/10042/to-13195
Geometry Analysis
The fully optimised structures of both molecules are displayed below.
Chlorine substituted borazine:B3N3Cl6 (fully optimised)
Borazine |
Chlorine substituted phosphorus-borazine:B3P3Cl6 (fully optimised)
Phosphorus-Borazine |
The optimised borazine molecule is planar like the initally proposed structure. Therefore aromatic characteristics can be expected similar to a standard borazine molecule which is also planar. The computed B-Cl bond length of 1.79Â is in very good agreement with the observed length as determined by X-ray crystallography of 1.76Â[2]. The B-N bond length 1.44Â is also very similar to the observed length of 1.41Â[3]. Therefore this indicates that the model, including the method and basis set used, represent the borazine molecule accurately.
However, the optimised phosphorous-borazine structure is very different to the intially proposed structure. The optimised strucutre is no longer planar which suggests that any aromaticity expected in the borazine molecule is not present in this phosphorus-borazine structure (which is not a true borazine strucuture as it is not planar). Instead a boat like confirmation is preferred which allows for overlap of orbitals between two of the phosphorus atoms in the cycle which are not adjacent to each other. Therefore there has been a distortion from the inital planar structure to a more bent structure which allows more favourable molecular orbital mixing resulting in a more stabilised state compare to the initial planar arrangement.
This was certainly not the expected outcome as the fully optimised phosphorus molecule is not the phosphurous analogue of borazine. However this is still an interesting result. The B-P bond lengths calculated in this model were 1.94Â which is slightly larger than the expected/observable length of 1.84Â which can be found in a planar borazine type strucutre[4]. One possible reason why this distortion has occurred is that the chlorine atoms, used to mimic mesityl groups, do not accurately represent the larger mesityl groups. Therefore the distortions observed here are possible and favourable with the chlorine atoms present however these distortions are not possible with the more sterically demanding mesityl groups so the molecule has to adopt a planar borazine like structure.
Vibrational Analysis
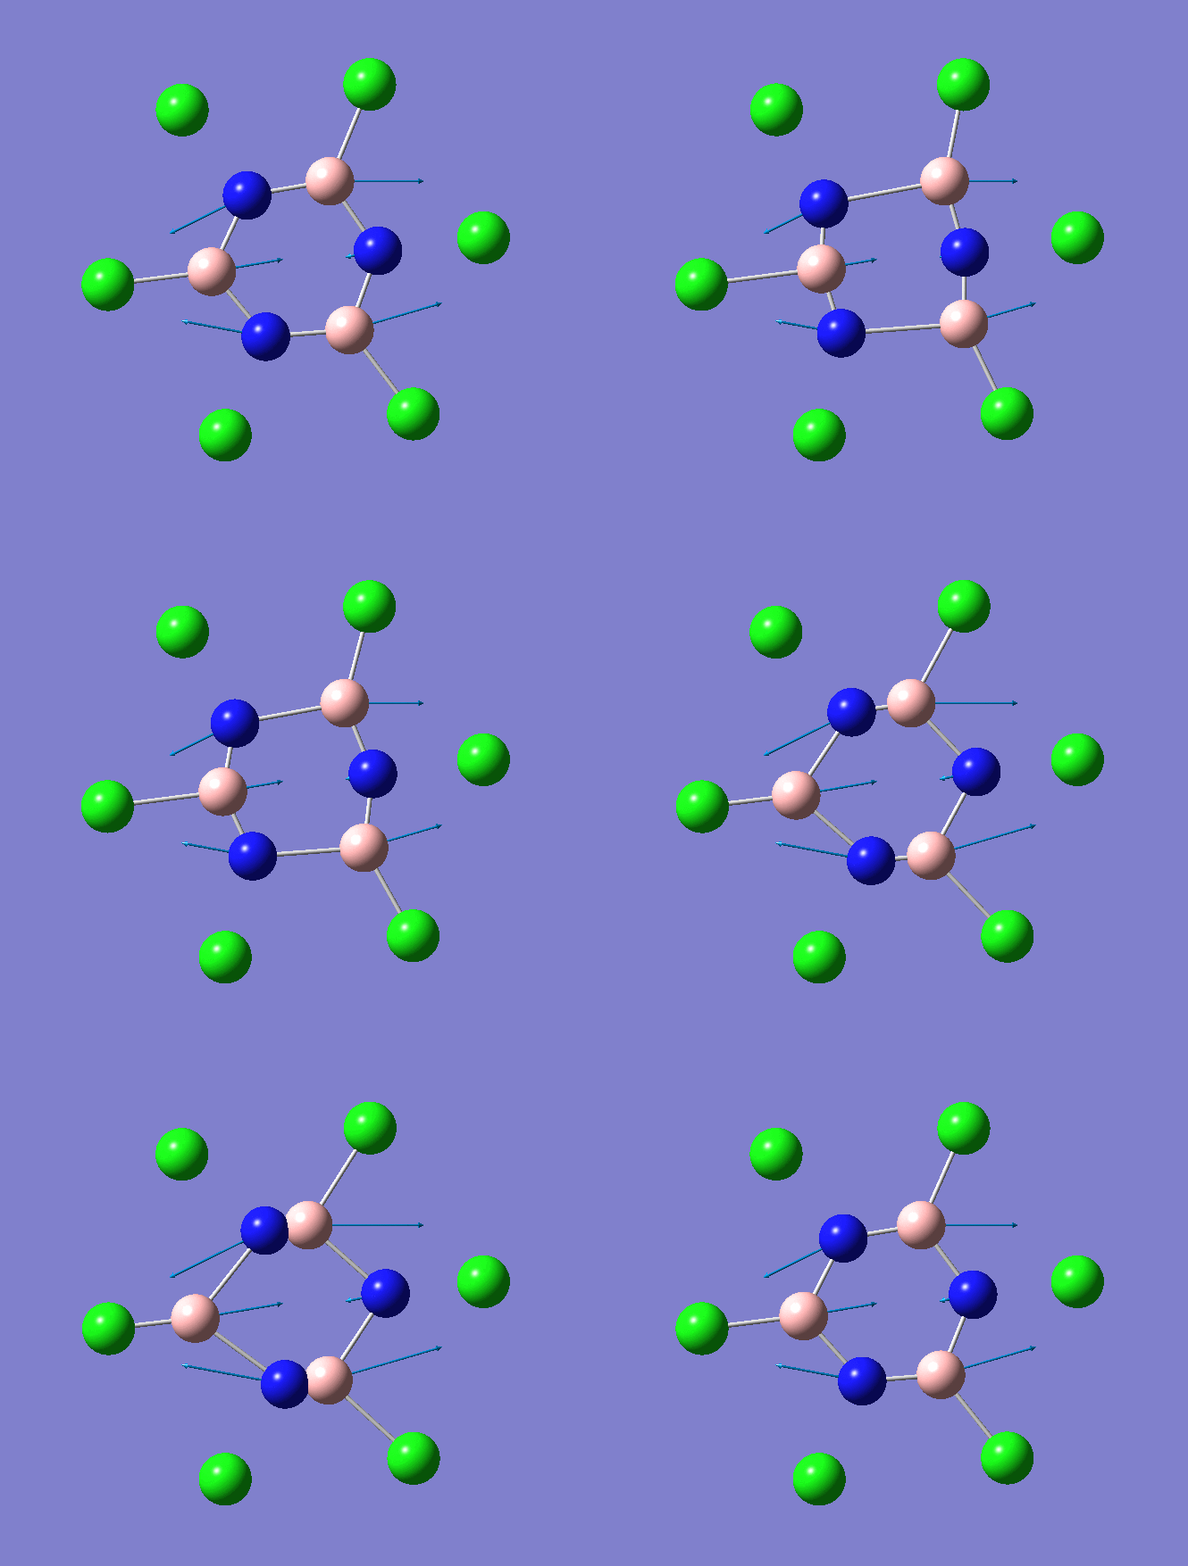
The IR spectrum of the borazine molecule B3N3Cl6 is dominated by two B-N stretching modes both of which have a very similar vibrating frequency (1371.86cm-1 and 1371.91cm-1), and so therefore overlap into one absorption peak in the IR spectrum at 1372 cm-1. This stretching frequency is similar to observed value of 1363 -1[5]. This key vibrations of B3N3Cl6 is displayed below.
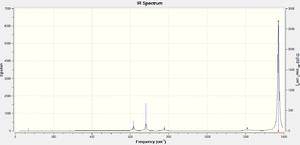
B-N stretching mode in B3N3Cl6
The IR spectrum of B3P3Cl6 shows several weak absorption vibrational modes. The absorption bands that are most notable occur at 897cm-1 and 908cm-1 and correspond to the B-Cl stretching modes. These key vibrational modes are animated below.

B-Cl stretching mode in B3P3Cl6 at 897cm-1
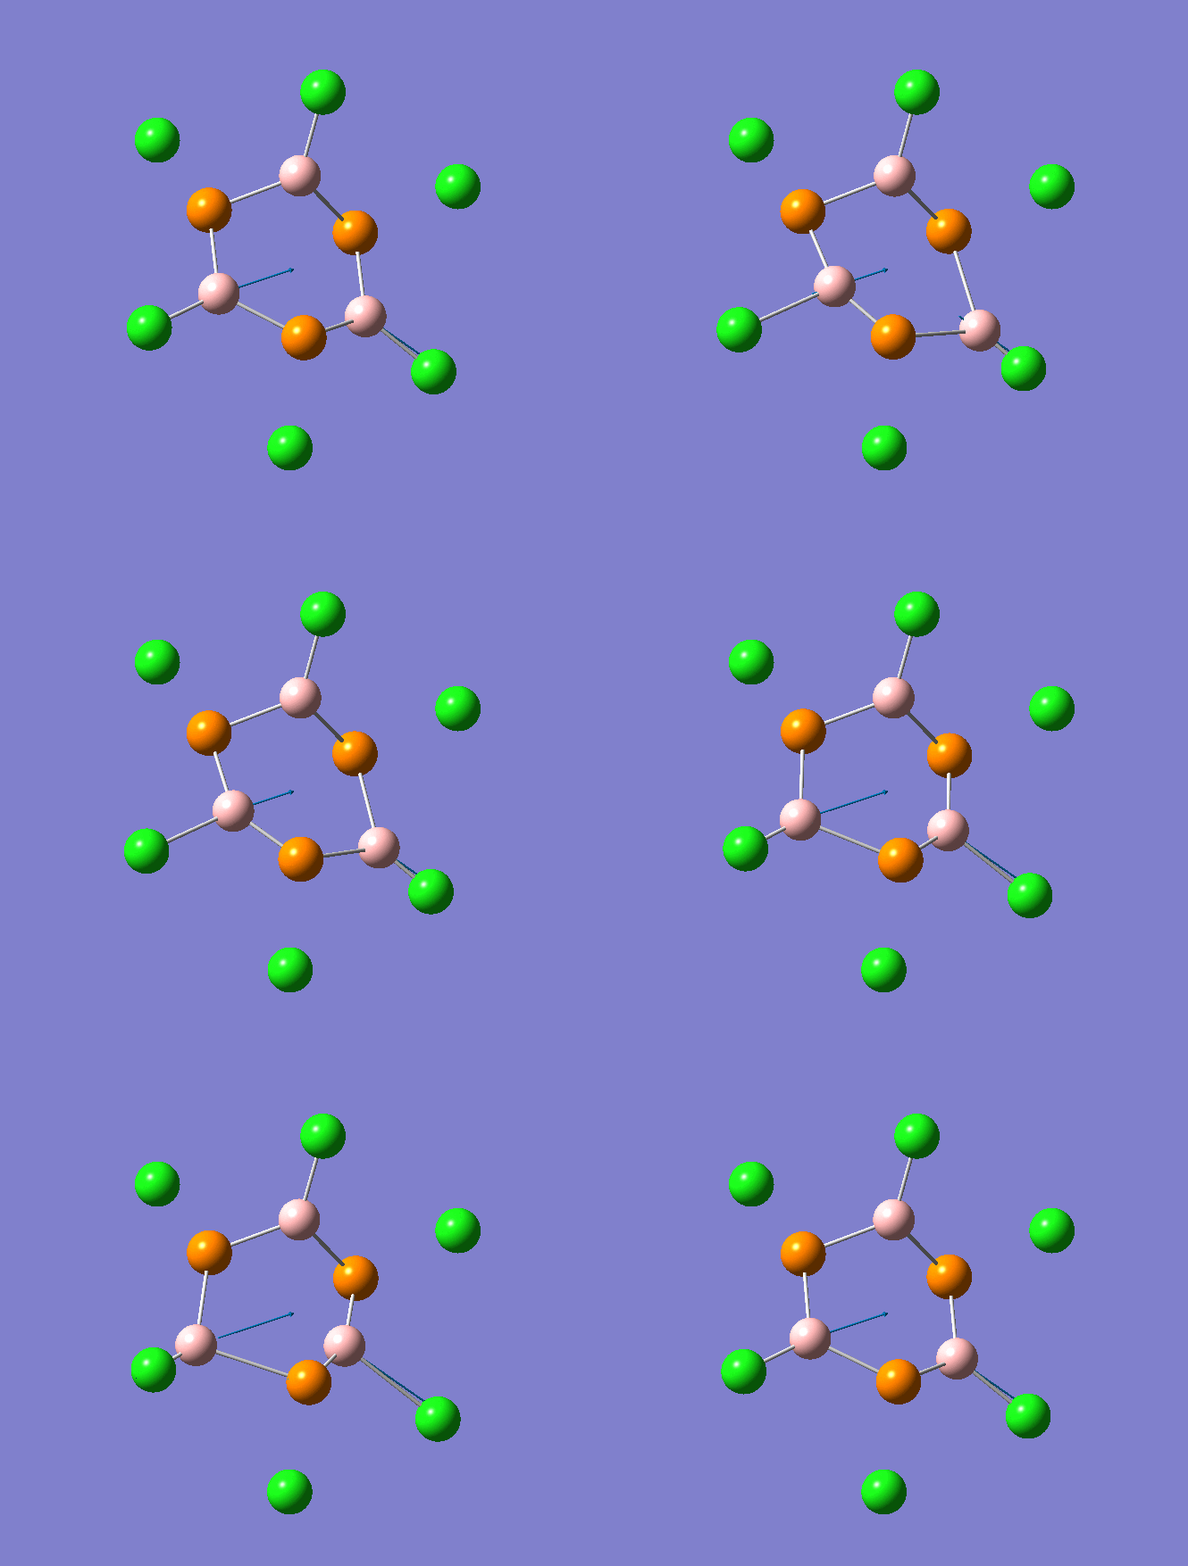
B-Cl stretching mode in B3P3Cl6 at 908cm-1

Energy Analysis
The main Molecular Orbitals around the HOMO-LUMO level of the phoshporus-borazine (B3P3Cl6) optimised structure have been examined to attempt to rationalise why the distortion from the planar borazine strucutre has occuried. (There were many many core MOs (60+) which have not been considered).
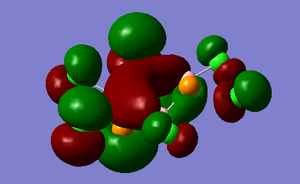
The HOMO-2 MO is occupied and shows the P orbitals of the two phosphorus overlaping the a P orbital of the boron atom between these two phoshporus atoms. This creates what look likes a п bond (same symmetry) between P-B-P. The P orbitals of the phosphorus are not strictly parallel to the p oritbal of the sandwiched boron atom however there is significant overlap to allow this п bond like MO.
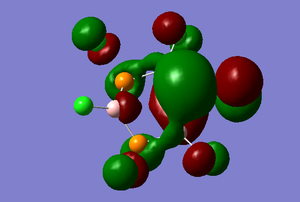
The HOMO-1 MO is occupied and dominated by the p orbital of the apical phosphorus atom. Bonding interactions between the chlorine atoms can also be observed as the P orbital of some of the chlorine atoms (shown at the top and bottom of the picture) are tilted at an angle to allow bonding interactions with the nearby chlorine atom. This could be one reason why B3P3Cl6 is is not planar as this type of interaction would not be possible in a planar structure.

The HOMO shows the п type bonds between B-P-B. Therefore it is expected that this MO arises from the P orbitals of the phosphorus atoms which donate electron density towards the adjacent electron deficient boron atoms.
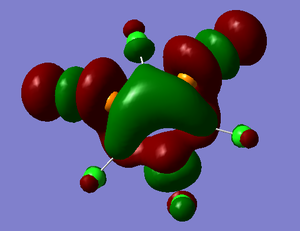
The LUMO MO shows two different interactions. Firstly the two P-Cl σ* bonds show highly antibonding interactions. However there is a bonding interaction between all three boron atoms and all three phosphorus on opposite sides of the ring structure that sort of resembles bonding that you might expect in aromatic benzene, i.e. the electron density is shared between atoms and not localised to one particular atom.
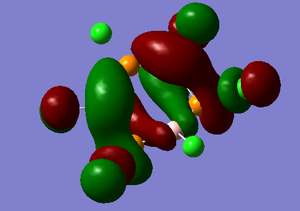
The LUMO+1 MO looks like a twisted three-dimensional π* bond which has highly antibonding characteristics, espically with respect to the chlorine atoms.
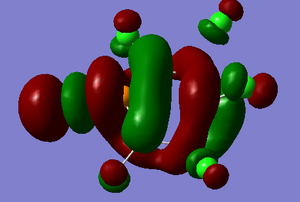
The LUMO+2 MO is dominated by the apical P-Cl σ* bond which has highly antibonding characteristics. There is also interesting delocalised ineractions between two boron atoms that are not adjacent and also over all of the atom on the ring (shown in red) which has a 3-D loop structure. These interactions also display strongly antibonding characteristics.
Conclusion
The B3P3Cl6 structure that has been optimised here shows interesting delocalised molecular orbitals even though this molecule does not have a planar strucutre. One possible reason for this is that by having a slightly bent structure there can be more favourable interactions between P orbitals of the boron, phosphorus and also the chlorine atoms by tilting of each atom to have an optimised geometry. If mesityl groups where used instead of chlorine atoms then it is likely the structure would be planar like the true phosphorus-borazine structure.
This would be investigated next if more time was available.
- ↑ H.R. Dias and P.P. Power, Angewandte Chemie Interational Edition in English, 1987, 26, 12, p1270 - 1271
- ↑ B. Anand, H. Nöth, H. Schwenk-Kircher and A. Troll, Eur. J. Inorg. Chem., 2008, p3186 - 3199
- ↑ B. Anand, H. Nöth, H. Schwenk-Kircher and A. Troll, Eur. J. Inorg. Chem., 2008, p3186 - 3199
- ↑ P.P. Power et al., Pure & Appl. Chem., 1991, 63, 6, p859 - 866
- ↑ B. Anand, H. Nöth, H. Schwenk-Kircher and A. Troll, Eur. J. Inorg. Chem., 2008, p3186 - 3199

