
Rep:Mod:EL1612/INORG
Inorganic Computational Lab - Part 1
Introduction to the Concept of Optimisation
In the first part of this report, small molecules were drawn using Gaussview 5.0.9. The geometries of the molecules were then optimised using Gaussian 09W. The purpose of this exercise is to explore basic features of the programs and to understand the principle of optimisation.
The concept of optimisation can be explained using the Lennard-Jones potential. First, let's take a simple diatomic molecule, like H2, to highlight the key features of the Lennard-Jones potential. As the internuclear distance between the two hydrogen atoms goes to infinity, the diatom dissociates. The potential energy plateaus because the interaction between the two hydrogen atoms decreases with increases in r. Thus, at large values of r further increases in the internuclear distance have little effect on the total energy. This is pictured in Figure 1. As r goes to values below the equilibrium bond distance, repulsive interactions dominate and the potential energy shoots up. This is because the repulsive interactions get stronger as the value of r is reduced. Note that at the equilibrium bond distance, there is no net force acting on the molecule. At r0, the potential energy is at a minimum and therefore the gradient or slope of the curve is zero. In other words, very small changes in the internuclear distance of the diatom have almost no effect on its energy. The gradient at a given value of r can obtained by calculating the first derivative of the curve at that point.
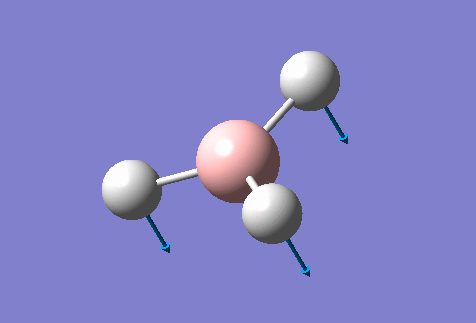
When optimising the structure of a molecule, the program computes what it thinks is the equilibrium structure. In other words, it finds the geometry for which the molecule is at an energy minimum. In order to do this, it generates various structures by modifying the atomic coordinates of the input structure and computes the energy of those geometries. This is shown in Figure 2. The optimisation is completed when the forces converge to zero and when small changes in the structure of the molecule have little effect on its total energy (i.e. the gradient of the total potential energy curve converges to zero). The program will stop the optimisation at this point. It is relevant to note that Gaussview does not "see" bonds, only atomic coordinates. Indeed, Gaussview draws bonds by default when the internuclear distance between a pair of atoms reaches a certain magnitude.


For molecules with more than two atoms, there is more variables. The first molecule that was optimsied is a molecule of BH3 (see section 1.4). BH3 has four atoms and therefore there is four X, Y and Z sets of atomic coordinates for the program to optimise. With increases in molecular complexity comes greater potential energy surface complexity. For instance, the potential energy surface of BH3 may have many minima. If the guess structure is not close enough to the actual structure, there is always the possibility that a local minimum will be found by Gaussian rather than a global minimum.
Bonding in Gaussview
As mentioned previously, Gaussview does not see bonds. It draws bonds when atoms reach a certain interatomic distance from one another based on their atomic coordinates. This rises the following question: What is a bond? A bond results of the attractive interaction between two atoms. Bonds are ionic in character when the electronegativy difference between the two atom is such that the electropositive species effectively loses one or more valence electrons to the electronegative species. A bond is described as polar covalent when it comprises two atoms of different electronegativity. The electronegative atom adopts a partial negative charge and the electropositive atom adopt a partial positive charge. Covalent bonds can also be non-polar. This occurs when two equivalent atoms are bonded to one another (catenation). Metallic bonds are found in is found in metals. They consist of metal cations layers in between which lies a sea of delocalised electrons. The electrons are delocalised because they can jump from the orbital that they occupy to orbitals in the conduction band called "holes". Bonds can be dative in character. An example of this is the ammonia borane adduct in which ammonia acts as a Lewis base and boron act as a Lewis acid. In other words, nitrogen donates electrons to the boron atom. Moreover, strong long range Van der Waal's attractive interactions, such as hydrogen bonding can be classified as bonds. ultiple bonding can occur between two atoms. Alkenes and alkynes are example of multiply bonded species. The electrons in a bond can be delocalised. This is found in conjugated double bonds like in benzene rings or between layers of cations in metals exhibiting metallic bonding. In general, bonds will resemble one of the types of bonds listed above. We can say that the bond is ionic, covalent, metallic, dative or classify it as a Van der Waal's interaction, but in reality no bond fall 100% into one of those category.
Bond strength varies greatly from one bond to another. Let's compare the bond strength of diatomic molecules. For instance, N2 and carbon monoxide are strong bonds and have bond dissociation energy of 945 and 1076 kJ/mol respectively. [1] Strong bonds have a magnitude of about 103. Dioxygen is weaker with a bond strength of 498 kJ/mol.[1] Bonds dissociation energies of the order of 102 correspond to medium strength bonds. Bromine also fall into this category with a bond energy of 194 kJ/mol.[1] The bonding in both O2 and Br2 is non-polar covalent in character. Hydrogen bonds are usually about 10 % of the magnitude of a covalent bond. They are weak bonds. Another example of weak bonds is bonds between nobles gases. Noble gases have an octet valence shell and are less keen to form bonds. For instance, Ar-Ne has a bond dissociation energy of 4.27 kJ/mol and Ar-Xe has a bond dissociation energy of 5.28 kJ/mol.[1]
Pseudo-Potentials and Basis Sets
In the section 1.6 of this report, a molecule of GaBr3 will be investigated. It is relevant to study gallium species as they are important in the semi-conductor industry. For example, GaAs is used in the optoelectronics devices. [2] GaBr3 has recently been shown to catalyse the reduction of esters to their corresponding ethers.[3] GaBr3 is challenging using the basic Schrödinger equation as the atoms exhibit relativistic effects. Moreover, bromine has 35 electrons (1s22s22p63s23p63d104s24p5) and gallium has 31. This is a lot of variables for the level of quantum mechanical theory that will be used to compute the properties of the molecule.
Relativistic effects can be partly accounted for by using pseudo-potentials. Pseudo-potentials (PP) are used to model the core electron of atoms. This simplifies the calculation and allows us to focus on the valence electrons. PP calculations can be used for our GaBr3 because it is made up of heavy atoms. PPs can not be used to accurately model the core electrons of small atoms (i.e. with atomic number below that of Si14). For the optimising of the BH3 molecule carried out in the section 1.4 and 1.5, the simple 3-21G basis set was used. However, when dealing with heavier atoms like bromine and gallium, a more complex basis set must be used. A basis set is a collection of functions. We can describe a basis set as modelling a shape. In the figure below, functions are represented as circles and are used to model the shape of a d-orbital. It can be observed that the basis set made up of two functions can model the shape of the orbital much more accurately than the basis set that only has one function. Indeed, if a basis set is made up of a great variety of functions, it will be able to model shapes accurately. However, using more complex the basis set, increasing the computing time of calculations. A balance must be found between the accuracy of the results and the time-efficiency of the calculations.

DFT(B3LYP)/3-21G optimisation of a BH3 molecule
Method
A molecule of BH3 was sketched using Gaussview. It is interesting to note that the default B-H bond length in Gausview was 1.18 Å, which is close to the literature value, 1.19 Å.[4] A first, a second and the remaining B-H bond were set respectively to 1.53, 1.54 and 1.55 Å. The internuclear distances in the molecule were then distorted from the equilibrium bond length by 0.34-0.36 Å. This is done in order to better observe the results of the optimisation that will be carried out. The bonds are set to unequal lengths to break the symmetry of the molecule. The rational behind this will be explained at a later time. The BH3 was optimised at the DFT level of theory with the B3LYP functional and the 3-21G basis set. The 3-21G basis set makes many approximations which results in a quick computation time, but also in less accurate results.
Results
The results are shown in Table 1. From the summary table in Table 1, it can be observed that the root mean square gradient (RMS gradient) goes to zero. In other words, for small displacements in the atomic coordinates of the optimised structure, its energy does not vary significantly. This suggests that the optimisation was successful and that the structure obtained is close to a minima on the potential energy surface. The Items Table shows that the forces have converged, further indicating that a stationary point was found.

The point group of the optimised molecule is not the expected D3h. This can be explained by two factors. Firstly, the optimisation method used is too basic for the program to obtain the accurate symmetry for the molecule. Secondly, the C3 axis of symmetry of the molecule was broken before in the input file used for the optimisation. The angles, bond lengths and atom labels can be obtained from the jmol rotatable image, but for the purpose of clarity, this data is listed explicitly in the table below. The optimised geometry does have a C3 symmetry if we take the angle and the bond lengths to four and three significant figures respectively. The mirror planes of symmetry remained after the optimisation this is reflected by a dihedral angle of 180.0° in the output structure. It can be concluded that the optimised geometry does have D3h symmetry. The bond length, 1.19 Å is in exact agreement with the literature value, 1.19 Å, despite the simple calculation method used.[4] The average bond angle is 120.0° consistent with an sp2 boron center.
| Optimised Molecule | Optimisation Summary | B-H Bond Length (in Å) | H-B-H Bond Angle (in °) | Energy (in hartree) | Energy (in kJ/mol) | ||
 |
1.19 | 120.0 | -26.4622637 | -69 476.68 |
1: Optimisation Log file: Click here
We can observe the step by step progress of the optimisation by looking at the plots of the RMS gradient and the total energy as each optimisation step. As the optimisation progresses, the energy of the system decreases. The RMS gradient decreases as we go from step 1 to step 7, indicating that the energy of the structure is approaching a stationary point on the potential energy surface. It can be observed that Gaussview draws bonds once atoms have reached a treshold internuclear distance.

DFT(B3LYP)/6-31G(d,p) optimisation of a BH3 molecule
Method
Before moving on to GaBr3 optimisation, we will re-optimise the BH3 molecule using the 6-31G(d,p) basis set and tight convergence criteria. The DFT(B3LYP)/2-31G optimised molecule is used as the input file. The keywords "scf=conver=9" were added to the default "integral=grid=ultrafine" settings.
Results
The results are shown in Table 2. The bond length obtained, 1.19 Å is in agreement with the literature value, 1.19 Å.[4] The H-B-H bond angle is 120.0°, which is in accordance with having an sp2 hybridised boron center. It is noted that the calculation summary shows the wrong point group for the BH3 molecule. This is because the program takes into account a certain number of significant figures when assigning the point group of the molecule. Indeed, the D3h symmetry of the molecule breaks down if we take the bond lengths and angles to six significant figures.
| Optimised Molecule | Optimisation Summary | B-H Bond Length (in Å) | H-B-H Bond Angle (in °) | Energy (in hartree) | Energy (in kJ/mol) | ||
 |
1.19 | 120.0 | -26.6153236 | -69 878.54 |
1: Optimisation Log file: Click here
The RMS gradient converges to zero as shown in the calculation summary in Table 2. The Items table shown in Figure 6 also confirms that the gradient and forces have converged. Note that the energy obtained using the two basis sets can not be compared. The energy of computed molecules can only be compared when they are generated using the same level of theory, functional and basis set. They must also have the same number of atoms.

DFT(B3LYP)/LanL2DZ Optimisation of a GaBr3 Molecule
Method
A molecule of GaBr3 was drawn on Gaussview. The geometry of the trigonal planar molecule was restricted to D3h symmetry and the tolerance was set to very tight (0.0001). An gaussian input file (gif) was then generated for the DFT(B3LYP)/LanL2DZ optimsation. The job was submitted to the HPC.
Results
The first thing that we notice is that the molecule has D3h symmetry with a dihedral angle of 180.0°, three equal Br-Ga-Br angles of 120.0° and three equal Ga-Br bond lengths of 2.35 Å. This is not surprising since the input molecule was restricted to the D3h point group. The Ga-Br bond length is close to the value reported in the literature, 2.33 Å.[5]
| Optimised Molecule | Optimisation Summary | Ga-Br Bond Length (in Å) | Br-Ga-Br Bond Angle (in °) | Energy (in hartree) | Energy (in kJ/mol) | ||
 |
2.35 | 120.0 | -41.7008277 | -109 485.53 |
1: Optimisation Log file: Click here or DOI:10042/195263
The RMS Gradient goes to zero as shown by the calculation summary in Table 3. The Items Table shown in Figure 7 confirms this and also shows that the forces converge to zero. The output files shows that the stationary point was found after three optimisation steps. Thus, the method used was time-efficient.

DFT(B3LYP)/6-31G(d,p)&LanL2DZ Mixed PP and Basis Set Optimisation of a BBr3 Molecule
Method
The DFT(B3LYP)/6-31G(d,p) optimised BH3 molecule was used as a template for a BBr3 molecule. The three hydrogen atoms where changed to bromine atoms. The molecule was optimised using the density funtional theory (DFT) and the B3LYP functional. The additional keywords "pseudo=read gfinput" and "integral=grid=ultrafine" were added. The basis set was set to "GEN". The input file was saved. The "GEN" option allows to specify the basis set for each atom in the saved input txt file. 6-31G(d,p) is used for the light boron centre and LanL2DZ is used for the heavy bromine atoms.
Results
The average bond length is 1.93 Å. This is close to the literature value: 1.96 Å.[6] The average Br-B-Br angle is 120.0°. This suggests an sp2 boron center and fits the expected trigonal planar geometry. Once again, the calculation is not precise enough to yield the correct point group. The molecule has a C3 and 3 C2 axis of symmetry. The optimised molecule also has a σh and 3 σv planes of symmetry. Therefore, the molecule has D3h symmetry.
| Optimised Molecule | Optimisation Summary | B-Br Bond Length (in Å) | Br-B-Br Bond Angle (in °) | Energy (in hartree) | Energy (in kJ/mol) | ||
 |
1.93 | 120.0 | -64.4364496 | -169 177.91 |
1: Optimisation Log file: Click here or DOI:10042/195262
The RMS Gradient goes to zero as shown by the calculation summary in Table 4 and the forces converge to zero as depicted in Figure 7. Once agaim, the lowest energy structure was found after three optimisation steps. The method used was time-efficient.

A Comparison of the Results of the Four Optimisations Carried Out
All the AX3 molecules have the same number of atoms and where computed using the same method therefore their energies are comparable. BBr3 has the lowest electronic energy because of the three electronegative bromine atoms. GaBr3 also has three bromine the the gallium atom is less electronegative than boron because its nucleus is more shielded. Hydrogen is more electronegative than boron and gallium, but not has electronegative has bromine therefore the BH3 molecule has the highest electronic energy. All the computed molecules are trigonal planar and have D3h symmetry. The central atom in the three molecules is sp2 hybridised.The B-H bond length in borane is shorter than the B-Br bond. This is because the bromine ligands in BBr3 is larger than the hydrogen atom in BH3. Bromine has a covalent radius of 1.20 Å whereas hydrogen has a covalent radius of 0.31 Å. [7] Moreover, Bromine is much more electronegative than boron and thus polarises the bond towards itself. This increases the electron density around the Br atoms, which in turn increases the repulsive interactions between the bromine atoms. The electronegativity difference between boron and hydrogen is smaller and does not lead to a great degree of polarisation of the bonding orbitals towards H.
The Ga centre in GaBr3 has a much bigger covalent radius than the boron in BBr3, 1.22 Å versus 0.84 Å.[7] This partly explains why the A-Br bonds are longer in Ga-Br than in B-Br. As before, the bonding ordinals are polarised towards the electronegative bromine atom, increasing the bromine-bromine repulsion in both species. However, the electronegativity difference between gallium and bromine is bigger than that between boron and bromine. Therefore, the electron cloud distortion towards bromine is greater in GaBr3. The bromine-bromine repulsive interactions are thus larger in energy in GaBr3. This contributes to the increased bond length in the latter AX3 species. We can also hypothesise on the relative energies on the B-Br and the Ga-Br bonds. B is closer in electronegativy with Br. From an energy point of view, the boron and the bromine valence orbitals are closer in energy than the Ga-Br orbitals and should interact more strongly than gallium and bromine. However, there is an orbital size mismatch between the boron 2s and 2p valence orbitals and the bromine 4s and 4p orbitals. On the other hand, the Gallium 4p and 4s orbitals could overlap better with the bromine valence orbitals. It is hypothesised that the B-Br bond is stronger overall. This could be confirmed or infirmed by carrying out a frequency analysis and looking and the energy of the B-Br and Ga-Br bonds.
| Optimised Molecule | B-H Bond Length (in Å) | H-B-H Bond Angle (in °) | Energy (in hartree) |
| BH3 | 1.19 | 120.0 | -69 476.68 |
| GaBr3 | 2.35 | 120.0 | -109 485.53 |
| BBr3 | 1.93 | 120.0 | -169 177.91 |
DFT(B3LYP)/6-31G(d,p) Frequency Analysis of BH3
Method
The output molecule of the DFT/6-31G(d,p) optimisation of BH3 does not have the correct symmetry (Cs instead of D3h). The optimised molecule is constraint to D3h symmetry and reoptimised. The output structure is set-up for a frequency calculation and saved to be submitted to the HPC.
Results
The output molecule has the same energy as the DFT(B3LYP)/6-31G(d,p) optimised BH3 molecule. This makes sense as the latter was used as the input molecule. The six frequencies shown in Figure 9 correspond to motions of the center of mass of the molecule. They are the origin of the "-6" term in the 3N-6 formula which is used to calculate the number of vibrational mode in a non-linear molecule with N atoms. They should be around 0 ± 15 cm-1. The range obtained is -14 to 0 cm-1. These value converge to zero when better computational basis sets are used. The six frequencies are at least two orders of magnitude smaller than the lowest energy vibrational mode.

| Optimised Molecule | Optimisation Summary | Frequency (in cm-1) | Intensity | IR active? (yes/no) | Desctription | ||
 |
1163 | 93 | yes | wagging, out-of-plane bend | |||
| 1213 | 14 | yes | rocking, in-plane bend | ||||
| 1213 | 14 | yes | scissoring, in-plane bend | ||||
| 2583 | 0 | no | symmetric stretch | ||||
| 2716 | 126 | yes | asymmetric stretch | ||||
| 2716 | 126 | yes | asymmetric stretch |
1: Optimisation Log file: Click here
The IR spectrum of the optimised BH3 molecule is shown is Figure 10. Note that there is no imaginary frequency which confirms that the optimised molecule is an energy minimum of the potential energy surface and not a transition state geometry. Bond stretching vibrations are found at higher frequencies than bending vibrations. Of the six expected vibrations, only five are observed in the IR spectrum. The symmetric stretch is not observed because is does not cause a change in the dipole moment of the molecule. The in-plane bends are degenerate. Therefore, they have the same energy and are seen as a single peak on the spectrum. The two asymmetric stretches are also degenerate and thus the pair gives rise to a single peak on the spectrum. The IR peak for the degenerate pair of in-plane bending vibrations would not be observed experimentally as its intensity is too low. It is however shown in the computed IR spectra. The out-of-plane bending vibration is the lowest energy vibration and is observed as a single strong peak. All in all, three peak are seen in the IR spectrum of the computed BH3 molecule.

DFT(B3LYP)/LanL2DZ Frequency Analysis of GaBr3
Method
The output structure of the DFT(B3LYP)/LanL2DZ optimisation of the GaBr3 hasthe correct D3h symmetry. The file can thus be set-up and saved as a gaussian input file for a frequency calculation. The file was then submitted to the HPC.
Results
The low frequencies corresponding to motions of the center of mass of the molecule are one order of magnitude smaller than the lower vibrational frequency and they are close to zero. This spread was larger for the BH3 (minimum two orders of magnitude smaller). Nevertheless, this suggest that the frequency calculation was successful.

As expected, the energy of the molecule is the same as that of the DFT(B3LYP)/LanL2DZ optimised GaBr3 molecule. This is because the latter was used as the input molecule. It is noted that the output molecule has C3h symmetry even though the input molecule was constrained to D3h. This is probably due to an error made by Gaussview when computing the symmetry of the molecule as the dihedral angle is 180.0°, the bond lengths are equal at 2.35 Å and the angles are all the same at 120.0°.
| Optimised Molecule | Optimisation Summary | Frequency (in cm-1) | Intensity | IR active? (yes/no) | Desctription | ||
 |
76 | 3 | yes | in-plane bend, scissoring | |||
| 76 | 3 | yes | in plane bend, rocking | ||||
| 100 | 9 | yes | out-of-plane bend, wagging | ||||
| 197 | 0 | no | symmetric stretch | ||||
| 316 | 57 | yes | asymmetric stretch | ||||
| 316 | 57 | yes | asymmetric stretch |
1: Optimisation Log file: Click here
The Infrared spectrum of GaBr3 is shown in Figure 12. The first thing to note in the IR spectrum is that there is no imaginary frequency. This indicate that the optimisation carried before the frequency analysis yielded an energy minima on the potential energy curve and not an energy maxima. This means that a stable structure was obtained and not a transition state geometry. Again, there is two pair of degenerate vibrational modes. The two in-plane bends and the two asymmetric stretch appear as one peak. The symmetric stretch is IR inactive as before and is not observed on the spectra. As before, a total of three peaks is observed.

Comparing the computed BH3 and the GaBr3 IR spectrum
Remember than in order to be able to compare results of calculations, they must be carried using the same method and therefore the same basis set. This is because different basis set generate different electronic energies and vibrational energies for a given structure. It is also important to use the same basis set for the optimisation and the frequency calculations. This is to ensure that the optimised structure does not change during the frequency calculation and that the frequency analysis is performed on the energy minima structure. A frequency calculation is useful because it tells us about the stretching frequency of bonds which in turn helps up to identify the relative energies of bonds within a molecule. It also allows us to compare the energy of a given bond across a variety of molecules containing this bond (as long as the freq calculation is carried out using the same method for the molecules compared). The IR spectrum generated can be compared with the literature and this is useful to determine whether the computed molecule is a true energy minimum and corresponds to the "real" experimental structure.
It is interesting to note that the out-of-plane bend is higher in energy than the in-plane bending vibrations for the GaBr3 molecule whereas the opposite is true for the BH3 molecule. Also, corresponding vibrational mode are one order of magnitude lower in energy and intensity in the GaBr3 than in the BH3 molecule. The frequency of a vibration is directly proportional to bond strength. The bond strength is represented as k in the equation for the vibrational energy (see equation below where v is the vibrational quantum number, k represents the bond strength and comes from the the spring constant and μ is the reduced mass). Therefore, this suggests that Ga-Br bonds are weaker than B-H bonds. This is most likely due to the diffuse valence orbitals of the fourth row elements Ga and Br which form weaker diffuse bonding orbitals. Moreover, vibrational energy is inversely proportional to the reduced mass, μ, as pictured in the equation below. The reduced mass of the gallium bromide bond is much larger than that of B-H bond. It makes sense the Ga-Br bond is longer than the B-H bond as its component atoms are larger atoms than B and H and they form weaker bond to one another.

When a vibration gives rise to weak peak, this means that the vibration causes small the change in the dipole moment molecule. On the opposite, a strong peak corresponds to a vibration which causes a big change in the dipole moment of the molecule. Earlier, I mentioned that the intensity of the vibrations were weaker for the GaBr3 molecule. This is most pronounced for the out-of-plane "umbrella" bending mode. This is because in BH3, this vibration causes the motions of all three H atoms where only the Ga center moves during the GaBr3 umbrella vibration. The overall displacement vector is greater in the BH3 vibration. Links to movies showing the vibrational mode in the two molecules in shown below.
Click here to see the umbrella vibration in BH3
Click here to see the umbrella vibration in GaBr3
DFT(B3LYP)/6-31G(d,p) Natural Bonding orbital (NBO) Analysis of BH3
Method
The DFT(B3LYP)/6-31G(d,p) optimised BH3 molecule was used as the input structure for a natural bonding orbital optimisation (NBO). The job type was set to energy and the additional keyword "pop=full" were used. Under the NBO tab, the "full NBO" option was selected. The input file was saved and submitted to the HPC. The checkpoint output file was used to visualise the molecular orbitals (MOs).
Results
The results are summarised in the annotated MO diagram below. Here is the link to the output checkpoint file of the NBO calculation: DOI:10042/195283 . Note than the core boron 1s orbital is too low in energy to interact with the hydrogen 1s orbital. As a result, the corresponding 1a'1 molecular orbital is non-bonding. It can be observed that the LUMO is non-bonding. This gives BH3 the ability to accept electron in its LUMO without decreasing the bond order of the molecule.

Note that the linear combination of atomic orbitals (LCAO) are shown next to the molecular orbitals (MOs) on the above diagram. The LCAOs gives us bonding and anti-bonding orbitals that are localised on atoms. The molecular orbital picture shows the delocalisation of those orbitals between bonded atoms. The real MOs show the polarisation of the electron density around the molecule. The LCAO picture shows the valence orbitals involved in the bonding orbital and their relative contribution. The MO picture is a more accurate description of bonding orbitals but LCAOs can be useful to understand which orbital contributes to the bond and to predict MO diagrams. Indeed, the above diagram could have been generated without knowledge of the real MOs using LCAO of the H3 and boron fragments. A huge amount of information can be gathered from a predicted MO diagram. This includes the relative energies of the molecular orbitals, the contribution of each atom to the predicted MOs, the bonding in the HOMO and LUMO of a molecule, the Lewis acidity/basicity of a molecule, the stability of the molecule and its bond order, etc. For instance, we could have predicted the Lewis acidic behaviour of borane. This gives insight into the reactivity of the molecule. However, things like the magnitude of the HOMO-LUMO gap cannot be predicted easily using qualitative MO theory. Also, the ordering of MOs can be hard to predict in some cases. For instance, in BH3, it can be hard to predict whether the 3a'1 orbital is higher or lower in energy than the 2e' orbital without computing the real MOs. Nevertheless, the usefulness of qualitative MO theory is unquestionable.
DFT(B3LYP)/6-31G(d,p) Optimisation, Frequency and Natural Bonding orbital (NBO) Analysis of NH3
Method
The optimisation of the molecule was carried using the 6-31G(d,p) basis set straight away. This can be done because the molecule is small. The keywords "scf=conver=9" were used in addition to the default "integral=grid=ultrafine". The output molecule of the DFT(B3LYP)/6-31G(d,p) optimisation was used to carry out a frequency analysis using the same level of theory. To carry out the NBO calculation, the output checkpoint file of the optimisation was used. The calculation job type was changed to energy and the keywords pop=full were added. Under the NBO tab, the option "Full NBO" was selected. The calculation was then submitted to the HPC.
Results
The results are tabulated in Table 7. The calculation summary lists the correct point group for optimised structure, C3v. The bond lengths are equal and the angles and equal at 105.7°. This H-N-H bond angle value is as expected for an sp3 center with a lone pair. The bond length obtained is in close agreement with the literature 1.01 Å.[8]
| Optimised Molecule | Optimisation Summary | Point Group | N-H Bond Distance (in Å) | H-N-H Bond Angle (in °) | Energy (in hartree) | Energy (in kJ/mol) | ||
 |
C3v | 1.02 | 105.7 | -56.5577687 | -148 492.43 |
1: Optimisation Log file: Click here

The six low frequencies attributed to motions of the center of mass are close two zero. They are also three to four orders of magnitudes lower than the lowest energy vibrational mode. These two observations suggest that the frequency calculation was successful. The energy of the molecule has not changed after the frequency optimisation. This tells us that the IR of the lowest energy structure was indeed computed.

The table below shows the computed frequency and their assigned vibration.
| Optimised Molecule | Optimisation Summary | Frequency (in cm-1) | Intensity | IR active? (yes/no) | Desctription | ||
 |
1089 | 93 | yes | wagging, out-of-plane bend | |||
| 1694 | 14 | yes | rocking, in-plane bend | ||||
| 1694 | 14 | yes | scissoring, in-plane bend | ||||
| 3461 | 1 | yes | symmetric stretch | ||||
| 3590 | 0 | yes | asymmetric stretch | ||||
| 3590 | 0 | yes | asymmetric stretch |
1: Optimisation Log file: Click here
The IR spectrum of the molecule is shown below. There is no peak with a negative frequency confirming that an energy minimum was found and not an energy maximum. In the ammonia molecule, all the vibrations are IR active. However, the asymmetric stretching vibrations cause such a small change in the dipole moment that their intensity is close to zero. The same applies to symmetric stretching of the N-H bonds. Those three peak would most likely not be observed in the experimental spectrum of the molecule. The asymmetric stretches are degenerate and are highlighted on the spectrum by a red cursor. The degenerate in-plane bending vibration have a slightly higher intensity and give rise to the peak at 1694 cm-1 in the computed spectrum. The intensity of those bending vibrations is still not very high and may be lost in the baseline of experimental spectra. The out-of-plane umbrella bending vibration is strong and would be see in an experimental IR spectrum.

Then, the MO orbitals were visualised using the output file of the NBO calculation. It was noted that both ammonia and borane have a non-bonding orbital. The latter is the HOMO of ammonnia whereas it is the LUMO in borane. This makes ammonia a good Lewis base and borane a good Lewis acid. Indeed, borane can accept electron in its non-bonding orbital readily. The output formatted checkpoint file can be found at: DOI:10042/195282 .
Finally, a charge distribution analysis of NH3 was carried out using the .log output file of the NBO calculation. A bright green colour is associated with a + 1.0 positive charge and a bright red colour is associated with a -1.0 charge. The colour range and its associated charge is shown below in the right hand side figure. The middle figure shows that the electronegative nitrogen center is highly negatively charged whereas the hydrogen atoms are positively charged. The actual charge of the atoms is shown in the picture on the left. The nitrogen atom as a charge of -1.1 and the hydrogen atoms have a charge of +0.4.

|

|

|
1: Log file: Click here
DFT(B3LYP)/6-31G(d,p) Optimisation and Frequency Analysis of NH3BH3
Introduction
As mentioned previously, ammonia is a good lewis base and borane is a good lewis acid. The two molecule can thus form an adduct. This adduct is intersting because of its high hydrogen content. It has the potential to be used as fuel. The ammonia and the borane moiety and joined together by a dative bond, a concept which was explained in the Bonding in Gaussview introduction section. In ammonia-borane, the nitrogen atom acts as a Lewis base and donates two electrons to the electron deficient Lewis acidic boron. In practice, the electrons are delocalised between the two atoms.
Method
The optimisation of the molecule was carried using the 6-31G(d,p) basis set straight away. This can be done because the molecule is small. The keywords "scf=conver=9" were used in addition to the default "integral=grid=ultrafine". The optimisation was carried exactly as for the BH3 and the NH3 molecule in order for the results to be comparable. The output molecule of the DFT(B3LYP)/6-31G(d,p) optimisation was used to carry out a frequency analysis. Note that the same level of theory must be used for the frequency calculation.
Results
The results of the geometry optimisation are tabulated in Table 9. The calculation summary lists the incorrect point group for optimised structure, C1 instead of C3v. This is most likely because the program computed the point group incorrectly since the molecule does have C3v symmetry. Indeed, the structure has three σv mirror plane and a C3 axis of symmetry. Note that the hydrogens bounded to the nitrogen atom and the boron bound hydrogens are in a perfectly staggered arrangement (60.0°).
| Optimised Molecule | Optimisation Summary | Point Group | Bond Lenghts (in Å) | Bond Angles (in °) | Energy (in hartree) | Energy (in kJ/mol) | ||
 |
C3v |
|
|
-83.2246890 | -218 506.44 |
1: Optimisation Log file: Click here

Since the output molecule did not have the correct point group, it was constrained to C3v and reoptimised before the frequency calculation was run. The output of the reoptimisation has the correct point group assignment, C3v. As before, the six low frequencies attributed to motions of the center of mass were analysed. They are close to zero and they are much smaller than the lowest frequency vibrational mode. The frequency calculation was thus successful. The energy of the output structure is very close to that of the input structure which confirms that the IR of the molecule with the correct geometry was computed. Note that the program assigns the wrong symmetry, C3, but in fact the molecule is still C3v. The correct results are obtained since the low frequencies are between 0 ± 15 cm-1 and the energy of the frequency calculation output molecule is essentially the same as that of the optimised geometry reported previously (the last two decimal places are different but that is not significant).

The table below shows the computed frequencies and their assigned vibration.
| Optimised Molecule | Optimisation Summary | Frequency (in cm-1) | Intensity | Degeneracy | IR active? (yes/no) | Desctription | ||
 |
263 | 0 | 1 | no | bend | |||
| 633 | 14 | 1 | yes | N-B stretch | ||||
| 638 | 4 | 2 | yes | bend | ||||
| 1069 | 41 | 2 | yes | bend | ||||
| 1196 | 109 | 1 | yes | umbrella bend (borane) | ||||
| 1204 | 3 | 2 | yes | in-plane bends (borane) | ||||
| 1329 | 114 | 1 | yes | umbrella bend (ammonia) | ||||
| 1676 | 28 | 2 | yes | in-plane bends (ammonia) | ||||
| 2472 | 67 | 1 | yes | symmetric stretch (borane) | ||||
| 2532 | 231 | 2 | yes | asymmetric stretch (borane) | ||||
| 3464 | 3 | 1 | yes | symmetric stretch (ammonia) | ||||
| 3581 | 28 | 2 | yes | symmetric stretch (ammonia) |
1: Optimisation Log file: Click here
The IR spectrum of the molecule is shown below. There is no peak with a negative frequency confirming that an energy minimum was found and not an energy maximum. It is relevant to note that there is only one IR inactive vibration.

The Energy of formation of the NH3BH3 adduct from ammonia and borane
The energy of the formation of the NH3BH3 adduct was calculated. The sum of the individual electronic energies of ammonia and borane was used to calculate the energy of the reactants. The energy of the NH3BH3 adduct was computed in the previous section. The energies of the three molecules are comparable because they were all computed using the DFT(B3LYP)/6-31G(d,p) method. The difference between the energy of the free ammonia and borane and the adduct represents the strength of the nitrogen-boron bond. The change in the electronic energy upon adduct formation is -134.47 kJ/mol. This corresponds to a bond dissociation energy of 134.47 kJ/mol. The N-B bond strength is of the order of 102 which correspond to a medium bond strength.
| Energy (in kJ/mol) | |
| NH3 | -148 492.43 |
| BH3 | -69 878.54 |
| Total reactants | -218 371.97 |
| NH3BH3 | -218 506.44 |
| Total products | -218 506.44 |
| ΔEelectronic | -134.47 |
| Dissociation energy | 134.47 |
Inorganic Computational Lab - Part 2 Aromaticity Project
Benzene
Optimisation and frequency analysis
To begin with, a benzene molcule was optimised using the DFT(B3LYP)/6-31G(d,p) method as in part one. The molecule was constrained to D6h symmetry. This will be important for the frequency and the NBO analysis. Note that the "tight convergence criteria" was used for the convergence on the displacement and the forces. The later converged to zero as shown in the items table below. This suggests that the computed structure is a stationary point was found on the potential energy surface. Moreover, the calculation summary shows that the RMS gradient is almost to zero. This is confirmed by the results in the Items table.

The C-C bond length and the C-C-C bond angle of the computed structure 1.40 Å and 120.0° is in accordance with the data reported in the literature, 1.39 Å and 120.0°.[9] The C-C bond length is shorter than the typical C-C single bond and longer than the average C=C double bond. This is due to the delocalisation of the three double bonds over the ring. The C-C-C bond angle suggest that the carbon atoms are sp2 hybridised as is the case. The planar benzene ring has D6h symmetry.
| Optimised Molecule | Optimisation Summary | Bond Lenghts (in Å) | Bond Angles (in °) | Energy (in hartree) | Energy (in kJ/mol) | ||
 |
|
|
-232.2582020 | -609 793.96 |
1: Optimisation Log file: Click here
As before, a frequency analysis was then carried to ensure that the structure found corresponds to an energy minimum on the potential energy surface and not to a maximum. There were no negative frequencies which shows that the structure obtained is an energy minimum. The energy of the optimised structure is the same as that of the output structure of the frequency calculation and The low frequencies have a range of -10 to 0 as shown in Figure 22. The highest of the six low frequencies is much smaller than the lowest energy vibrational mode of the computed molecule. The energy and low frequencies analysis suggests that the frequency calculation was successful.

The key IR-active benzene stretching frequencies are shown below. The out-of-plane bending frequency is strong, as expected. The degenerate carbon-carbon stretching frequency is higher than that of a typical C-C single bond and lower than that of a typical C=C double bond. The C-H doubly degenerate stretching frequency suggest sp2 carbons.
| Optimisation Summary | Frequency (in cm-1) | Intensity | Degeneracy | IR active? (yes/no) | Desctription |
|
695 | 74 | 1 | yes | out-of-plane bend |
| 1524 | 7 | 2 | yes | asymmetric C-C stretch | |
| 3197 | 47 | 2 | yes | asymmetric C-H stretch |
1: Frequency analysis .log file: Click here
The IR spectrum of the computed molecule is shown below. Note that most of the vibrational mode are IR inactive because of the high degree of symmetry of benzene.

NBO analysis
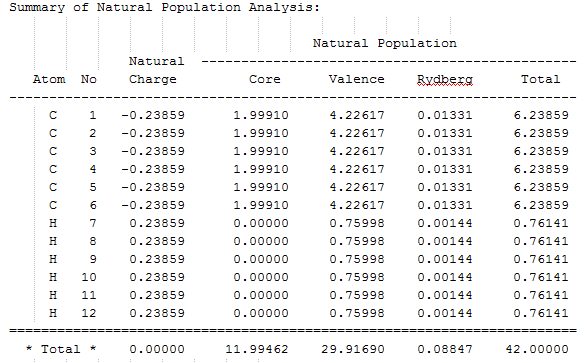
The NBO calculation file can be found here: DOI:10042/195333 and the summary of the natural population analysis can be found here. The population analysis tells us about the s- and p-character of the C-C, C-H and the core C-C bonds. Let's take a carbon atoms around the ring, C1, and look at its valence bonding orbital. The carbon forms a carbon-carbon single bond with each of the neighbouring carbon atoms and a carbon-hydrogen single bond with a hydrogen atom. The occupancy of each of those bonds is about two electrons. The carbon orbitals involved in single bonds are sp2 hybridised and the hydrogen orbital has 100 % s-character, as expected. Note that carbon is more electronegative than hydrogen and therefore its sp2 orbital contributes more to C-H bond (62% vs. 38% contribution respectively). There is also a carbon-carbon double bond between C1 and one of the adjacent atoms. Both of the carbon orbitals involved are p-orbitals. The NBO calculations can give inaccurate results for the occupancy of aromatic compounds. The C=C double bond does have an occupancy of 2.


A cropped table illustrating the key points of the "Second Order Perturbation Theory Analysis of Fock Matrix in NBO Basis" is displayed in Figure 26. The two electron stabilisation energy, E(2) is calculated using the equation on the right where qd is the donor's orbital occupancy, εd and εa are the donor and acceptor orbitals energies and F(d,a) is the NBO Fock matrix element. The E(2) energies show that each C=C double bonds acts in a Lewis base fashion and donate electrons in the π* antibonding orbital other two other C=C bonds. In other words, there is mixing between the three π and the three π* orbitals.

A section of the MO diagram of benzene was selected and portrayed in the figure below. The six low energy molecular orbitals made up from combinations of the carbon 1s orbital were ignored. This is because the latter MOs do not provide insight into the bonding and the reactivity of benzene. Indeed, the summary of the natural popultaion analysis shows that there are 12 electrons "core" electrons. The six orbitals ignored contain those "core" elecrons. The orbitals containing the 30 valence electrons as well as a few of the lowest energy unoccupied orbitals will be studied. The NBO calculation file can be found here: DOI:10042/195333 and the summary of the natural population analysis can be found here.

Usually, when describing aromaticity in benzene, we think about an cyclic array of in-phase pz orbitals with delocalised electrons. This correspond to the 1a2u orbital. However, we can see from the MO diagram that this MO only contains 2 electrons. In which MO do the other four delocalised electrons lie? It is likely that the two degenerate 1e1g MOs contribute to the aromaticity. The two orbitals are the HOMO of benzene. One of the MOs has two through bond in-phase interactions and two through space anti-bonding interactions. The other one contains two through bond out-of-phase interactions and four through bond in-phase interactions. It is interesting that bonding MOs with weakly anti-bonding components can contribute to the aromaticity.
Cyclic compounds must be planar to be considered aromatic. The 1a2u and the 1e1g of the computed benzene molecule are weak and are most likely not the MOs enforcing the planarity of the molecule. The computed molecular orbitals suggest that the planarity is maintained by a strong sigma-framework. Distortion of the molecule from D6h symmetry to a cyclohexatriene species with D3h symmetry would destabilise the σ-framework and stabilise the π-electrons.[10], [11] Therefore, the high degree of symmetry of benzene is imposed by its rigid σ-framework.[12], [13], [14], [15] However, the viability of the HF calculations leading to this result in the literature is subject to some controversy.[16] The most recent literature reports above-cited use HF calculations to define the contribution of the σ- and π-electrons to the symmetry of benzene. In order to do so, approximations must be made for the potential energy term of the Hamiltonian. The nuclear-nuclear repulsion term, Vnn, and the σ- and π-electron exchange interactions, Veσeπ, must be broken down to separate the σ- and π-electron contribution. This has been somewhat successfully achieved for Vnn but not for Veσeπ. [12], [15] A recent piece of literature discusses the issue of separating Vnn and Veσeπ and investigates the extrinsic aromaticity of benzene.[17] Again, this report is in agreement with the result obtained here, which suggests that the σ-framework contributes the most to the planarity of benzene.
The first MO shown on the diagram, labelled 1a1g, is a fully in-phase through bond and through space bonding orbital. The 1e1u, 1e2g 2a1g orbitals also have strong bonding through bond interactions. Despite some weakly antibonding through space interactions in the 1e1u and 1e2g orbitals these are all strongly bonding orbitals. Upon distortions in the symmetry of the molecule from D6h to D3h the bonds between the carbon p-orbitals and carbon or hydrogen s-orbitals would be weakened. As a result those orbital would be destabilised of of the orbitals in the D3h configuration. The same principle applies to the 1b2u orbital. The 1a1g orbital also most likely be destabilised because the through space C-C and H-H interactions would be weakened. On the opposite, the 1b1u orbital would most likely be stabilised by the adoption of a D3h chair-like conformation as the weakly anti-bonding through space interactions would be weakened and weakly bonding through space interactions would arise. Through bond interactions would be unchanged. Distortion for the planar configuration of the ring would affect the energy of the 2e1u and the 2e2g orbital greatly as it would greatly weaken, if not completely eliminate the through space bonding interactions. On the opposite, the 1b1u orbital would be more stable in a D3h structure. In general, the orbitals making up the σ-framework would be destabilised. It is interesting to note that one π-like HOMO would be stabilised in the D3h structure and the other π-like orbitals would not be greatly affected. This suggests that the π-framework favours a non-planar symmetry. This goes along with the hypothesis that the planarity of the molecule is imposed by the σ-framework.
Finally, the charge distribution within the symmetrical molecule was obtained from the NBO calculation. The results will displayed and compared alongside that of boratabenzene and pyridinium at a later time.
Boratabenzene
Optimisation and frequency analysis
The RMS gradient, showed in Table 14 under "Optimisation Summary", is close to zero. Moreover, the items table shows that the optimisation was completed succesfully (i.e. the forces and the displacement converges to zero). The items table is displayed below:

Looking further into the "Optimisation Summary", we can see that the molecule obtained in is the singlet state and has a charge of -1 as expected. The assigned point group is also correct, C2V. Despite the fact that boratabenzene is isoelectronic with benzene, the bond lengths are different. The carbon-boron bond length, 1.51 Å, is much longer than the carbon-carbon interatomic separation in benzene, 1.40 Å. The two C-C bonds adjacent to the negatively charged boron atom are shorter by 0.01 Å than the other two C-C bonds. The long C-B bonds and the unequal C-C bonds reflects a less effective delocalisation of π-electrons around the ring than in benzene. The average C-C bond length is however the same as in benzene, 1.40 Å. The C-C bonds length is indicative of sp2 carbon atoms, alike benzene. The B-H bonds are longer than the B-H bond in the BH3 molecule computed in "Part 1", 1.22 versus 1.19 Å. The average C-H bond length, 1.09 Å, is the same as in benzene. The C-B-C angle tells us that the boron center is between sp2 and sp3 hybridised whereas the C atoms are sp2-like. The hybridisation of boron could affect the p-orbital overlaps around the ring and reduce the extent of delocalisation of the electrons around the ring compare to benzene.
| Optimised Molecule | Optimisation Summary | Bond Lenghts (in Å) | Bond Angles (in °) | Energy (in hartree) | Energy (in kJ/mol) | ||
 |
|
|
-219.0205230 | -575 038.43 |
1: Optimisation Log file: Click here
The six low frequencies are within ± 15 cm-1 of zero. The energy of the molecule is closed to that from the optimisation carried out previously. Also, the output molecule from the frequency calculation still has the correct spin, charge and point group (see frequency calculation summary in Table 15). Moreover, there is no imaginary frequency which, shows that the optimised structure is an energy minimum on the potential energy curve and not a transition state geometry. This confirms that the frequency calculation was successful.

Some of the IR active stretches of boratabenzene are displayed below. Note that the C-C stretches are higher in energy than C-B stretches of the same symmetry. The C-C bonds are also shorter than the C-B bonds are mentioned previously. Combined, those two factors confirm that the C-C bonds are stronger than the C-B bonds. The B-H stretch is lower in wavenumber than than C-H stretch. The B-H bond has a length of 1.22 Å whereas the C-H bonds have an average length of 1.09 Å. It can be concluded that the B-H bond is weaker than the C-H bond. All the peaks analysed in the table below are lower in energy than in benzene.
Most of the vibrational modes in boratanenzene are non-degenerate and IR active. This includes symmetric stretches and bends which are IR inactive and degenerate in the high symmetry parent benzene molecule. Only one pair of degenerate and IR inactive vibrations is found in boratabenzene. Two mixed asymmetrical C-C and C-B stretching modes are found at 1565 and 1333 cm-1 in the IR of boratabenzene. The highest energy stretch is at 1565 cm-1 has some symmetrical components and his therefore higher in energy than the concerted C-C and C-B asymmetrical stretch at 1333 cm-1. A stretching vibration involving the five carbon atoms C-C only is found at 1592. The C-C and the C-B vibrations are not fully mixed. This data shows that B- is not equivalent to the carbon atoms despite being isoelectonic. The presence of the weaker and longer C-B bonds along the ring will most likely affect the aromaticity of the molecule. The σ-framework would be weakened, distorting the planarity of the molecule and weakening the p-orbital overlaps. The charge distribution would also be affected.
| Optimisation Summary | Frequency (in cm-1) | Intensity | Degeneracy | IR active? (yes/no) | Desctription |
 |
608 | 11 | 1 | yes | symmetric out-of-plane bend |
| 711 | 3 | 1 | yes | symmetric out-of-plane bend | |
| 1227 | 1 | 1 | yes | C-B asymmetric stretch | |
| 1449 | 9 | 1 | yes | C-B symmetric stretch | |
| 1463 | 14 | 1 | yes | C-C asymmetric stretch | |
| 1592 | 40 | 1 | yes | C-C symmetric stretch | |
| 2447 | 368 | 1 | yes | B-H stretch | |
| 3027 | 108 | 1 | yes | asymmetric C-H stretch | |
| 3060 | 380 | 1 | yes | asymmetric C-H stretch | |
| 3061 | 10 | 1 | yes | asymmetric C-H stretch | |
| 3116 | 112 | 1 | yes | symmetric C-H stretch |
1: Frequency analysis .log file: Click here

NBO analysis
The output files of the NBO calculation can be found here: DOI:10042/195354 . An analysis of the charge distribution and of the molecular orbitals of the molecule will be carried alongside benzene and three isoelectronic benzene analogue at a later time. Let's look at the information collected on the occupancy, bond orbital, coefficient and hybridisation around the atoms in boratabenzene. Some key information is shown in the figure below. We will look at the bonding around C1, C2 and B12.
The carbon orbitals in the first C1-C2 bond are sp2 hybridised and are thus sigma bonded to each other. The two atoms contribute almost equally to the bond. The small difference is due to the fact that C1 is adjacent to an electropositive boron atom. The bond is occupied by two electrons. The second C1-C2 bond is made up of two electrons, one of which comes from the unhybridised p-orbital of C1 and the other comes from the unhybridised p-orbital of C2. The two atoms contribute almost equally to the п-bond. Again, the difference is due to the proximity of C1 and B12. In the C-H bond, C1 is sp2 hybridised and H7 has 100 % s-character. Hydrogen is less electronegative than carbon therefore H7 contributes less to the bond than C1. The carbon orbital involved in the C-B bond is between sp and sp2 hybridised whereas the boron orbital is sp2 hybridised. Carbon is more electronegative than boron therefore it makes sense that C1 contributes more to the bonding orbital and B12. This bond has an occupancy of two electrons like all the other valence bonding orbitals. Hydrogen contributes more to the B-H bond than boron as it is more electronegative. The difference in electronegativity is less pronounced than between carbon and boron. This is relfected by a smaller difference between the boron and hydrogen coefficient than between carbon and boron. In B-H, B12 is sp2 hybridised and H6 has 100% s-character.

Overall, the information from the occupancy, bond orbital, coefficient and hybridisation table tells us that there are double bonds between C1-C2 and C4-C5 and none two boron. The two remaining electron are shared between C3 and B12. The more electronegative carbon gets a greater share of the electron density. The lone pair is localised on the carbon atom and delocalised to the non-Lewis boron lone pair. The occupancy, bond orbital, coefficient and hybridisation of the lone pairs is shown below:

The "Second order pertubation theory analysis of Fock Matrix in NBO basis" is another section of the NBO calculation output file that can be useful. The analysis summary table shows the interaction between Lewis base like filled NBOs and Lewis acid like empty NBOS. This allows to account for the delocalisation of electrons from the localised Lewis bonding orbitals into empty non-Lewis antibonding orbitals. In other words, the NBO calculation first computes the natural bonding orbitals for a stable resonance form of the molecule and then accounts for the delocalisation of the electrons. The resonance forms of boratabenzene are shown below.

As established previously, the output Lewis structure of the NBO calculation corresponds to the second resonance form in the above figure. The selected portion of the "Second order pertubation theory analysis of Fock Matrix in NBO basis" table shows that there is delocalisation from the HOMO of C1-C2 and C4-C5 into the LUMO of C3 and B12 and vice-versa. The electropostitive boron has a higher energy HOMO than C3 and is therefore a better electron donor since it causes the greatest stabilisation energy. Note that E(2) stands for 2 electron stabilisation energy. The bonding HOMO orbital are the worst electron donors as they are much lower in energy than the orbital they are donating into. They give rise to the lowest E(2) as a result. We can observe that the delocalisation of orbitals around the pyridinium ring is uneven unlike in benzene. This is also observed in boratabenzene. A decrease in the ease of delocalisation of the π-electrons reflects a decrease in aromaticity. Therefore, the two isoelectronic benzene anologues will not be as stable as the parent benzene molecule.

Pyridinium
Optimisation and frequency analysis
The gradient at the energy of the optimised structure on the potential energy surface goes to zero. Also, the items table show that the optimisation was completed as the forces and the displacement converged. This suggests that an energy minimum geometry was obtained.

The first thing to notice is that the bonding seems incorrect in the output strutuce. Remember that Gaussview draws bonds and deducts the presence of multiple bonding using the interactomic distances and valence electrons. Because the pyridinium ring is aromatic and has inequivalent bonds and charge distribution, Gaussview misinterprets the bonding. This does not mean that the computed molecule is incorrect. The molecule has the correct symmetry. The N-H bond length is 1.02 Å, as in the computed ammonia molecule. The N-H bond length is in perfect agreement with the literature value, 1.02 Å.[18]. The N-H bond length is shorther than C-H in benzene, which in turn is shorter than the B-H bond length in boratabenzene. This reflect the respective strength of the X-H bonds. The two C-C bonds close to the nitrogen atom are shorter than the two C-C bonds further away from it. The same applies to the C-H bonds although the latter are less affected. The N-C bond is shorter than the C-C bonds in pyridinium and both benzene and boratabenzene.
| Optimised Molecule | Optimisation Summary | Bond Lenghts (in Å) | Bond Angles (in °) | Energy (in hartree) | Energy (in kJ/mol) | ||
 |
|
|
-248.6680609 | -652 878.04 |
1: Optimisation Log file: Click here
After the frequency calculation, the energy of the molecule hasn't changed significantly and the correct symmetry and charge are maintained. Moreover, the six frequencies due to motions of the center of mass are within ± 15 cm-1 and much smaller than the lowest vibrational mode. Also, there are no imaginary frequencies. All this information demonstrates that the frequency calculation worked well.

It can be observed that there are some IR inactive C-H asymmetric and symmetric stretches. This is a result of the symmetry of the molecule. For example, the symmetric C-H stretching vibration is IR inactive because the vibrational mode has a mirror plane and thus the induced dipole change is cancelled out by each half of the molecule. Note that despite being shorter, the C-N bond is weaker in energy than C-C bonds. As a result, the C-N stretching vibrations are found at a lower frequency than the C-C stretches. The difference in energy between the two bonds is relatively small and therefore we find mixed C-C and C-N vibrational modes. Those vibrations are found at 1374, 1524 and 1657 cm-1. The lowest energy mixed vibrational mode is made up of all asymmetric components where the highest energy mode has symmetrical stretching components. The fact that there are distinct C-C and C-N only vibrational modes highlight that the π-electrons are not fully delocalised around the ring. Despite being isoelectronic with carbon, the nitrogen cation behaves differently and decreases the symmetry of the ring. Note that the equivalent out-of-plane bend is lower in energy in boratabenzene than in pyridinium and lower in energy in pyridinium than in benzene. The same trend applies to the C-H asymmetric stretching vibration. The C-N asymmetric stretch is higher in energy than the corresponding C-B stretch in boratabenzene and lower in energy than the C-C vibrational mode in benzene. The C-C asymmetric stretch in higher in energy in pyridinium than in benzene, suggesting that the C-C bonds are strengthened in pyridinium.
| Optimisation Summary | Frequency (in cm-1) | Intensity | Degeneracy | IR active? (yes/no) | Desctription |
 |
677 | 90 | 1 | yes | symmetric out-of-plane bend |
| 748 | 82 | 1 | yes | symmetric out-of-plane bend | |
| 1300 | 3 | 1 | yes | asymmetric C-N stretch | |
| 1580 | 48 | 1 | yes | C-C asymmetric stretch | |
| 1677 | 34 | 1 | yes | C-C symmetric stretch | |
| 3242 | 11 | 1 | yes | C-H asymmetric stretch | |
| 3252 | 20 | 1 | yes | C-H asymmetric stretch | |
| 3060 | 380 | 1 | yes | asymmetric C-H stretch | |
| 3254 | 0 | 1 | no | symmetric C-H stretch | |
| 3570 | 158 | 1 | yes | N-H stretch |
1: Frequency analysis .log file: Click here
The complexity of the spectrum increases from benzene to boratabenzene and pyridinium. This is due to the decreased symmetry of the latter two molecules, which introduces new vibrational modes and more IR active and non-degenerate modes.

NBO analysis
The NBO calculation file can be found at the following link: DOI:10042/195348 . The analysis of the charge distribution and key molecular orbitals will be carried in later section of this report. For now, we will focus on the natural population analysis. First, we we look at the the occupancy, bond orbital, coefficient and hybridisation table to gather information about the bonding in pyridinium. The C1-C2 bond is a single sigma bond made up of two carbon sp2 hybridised orbitals. It is noted that C1, which is adjacent to the electronegative nitrogen atom, contributes more to the bonding orbital. All the Lewis valence bonding orbital have an occupancy of approximately two electrons. In C1-H7, the sp2 hybridised carbon orbital contributes more to the bond than the less electronegative hydrogen unhybridised s-orbital contributes less. There first C-N bond is a single bond. The carbon orbital is between sp2 and sp3 hybridised whereas the nitrogen orbital is between sp2 and sp hybridised. The more electronegative nitrogen contributes more to this σ-bonding orbital. The nitrogen atom withdraws even more of the bond electron density in the C-N π-bonding orbital. The π-BD is made up of two unhybridised p-orbital. One comes from the nitrogen and the other is from the carbon atom. The N-H6 bond is similar to the C1-H7 bond. One difference to note is that the nitrogen atom contributes more to the N-H bond than the carbon atom to the C-H bond. This is because nitrogen is more electronegative than carbon and therefore has a bigger electronegativity difference with hydrogen.


To sum up, the occupancy, bond orbital, coefficient and hybridisation analysis of the Lewis bonding orbitals tells us about the localised bonding in pyridinium. The localised natural bonding orbital (LNBO) for the computed molecule are shown to the right. The delocalisation of electons is reflected by the occupancy of the non-Lewis valence bonding orbital. These are shown below. It can be observed that the low energy antibonding C-N π* orbital has a high occupancy! The C-C π* orbitals are higher in energy and have a lower occupancy. Notice carbon now contributes more than nitrogen to the antibonding orbital. Similarly, the carbon atoms nearer to the nitrogen atom contribute less to the C-C π* orbitals than the carbon atoms further away from N.

The second order perturbation theory analysis of fock matrix in NBO basis table says more about the delocalisation of electrons. We can see that all the three π-orbitals donate into the three π*-orbitals. The C-N π-orbital should be the lowest energy orbital since the N is the most electronegative atom. The orbital is polarised towards the nitrogen atom. C4-C5 π*-orbital is closer to the nitrogen atom than the C2-C3 π*-orbital. Moreover, the C4-C5 π*-orbital is polarised towards C5, which is adjacent to the nitrogen atom and allows for good overlap with the C-N π-orbital. As a result, electron density is more easily donated into C4-C5 π*-orbital and the E(2) for the latter interation in greater. The C2-C3 π-orbital interacts strongly with the low energy C-N π*-orbital and weakly with the higher energy C4-C5 π*-orbital. In addition, C1 contributes more to the C-N π*-orbital and therefore the C-N π*-orbital overlaps well with the C2-C3 π-bond which itself is localised on C2. Looking at the charge distribution in pyridinium we notice that the overall electronegativity of the atoms in the C2-C3 and the N-C1 bonds are similar and that the C4-C5 is more electropositive. Tt makes sense than the interaction energy of the C2-C3 and the N-C1 π*-orbital with the high energy C4-C5 π-bond is about the same.

Borazine
Optimisation and frequency analysis
The results of the optimisation and frequency analysis will be discussed in this section. The forces and the displacement both converge to zero under the tight convergence threshold criteria. It can be seen in Table 18 that the gradient of the potential energy curve on the potential energy surface also converges to zero. The optimisation of the molecule was thus completed successfully.

The correct symmetry, charge and spin were obtained for the computed molecule are correct. The B-N bond lenght is in close agreement with the values reported in the literature, B-N : 1.44Å [19] The B-N bond length is close to the C-C in benzene. More so than the C-B and C-N bond length in pyridinium and boratabenzene. Since the B-N bonds along the ring are equal in length, the molecule could display a greater aromatic character than boratabenzene and pyridinium. The molecule is planar (dihedral angle of 180.0°). The N-B-N and the B-N-B bond angles suggest that the boron atom is between sp2 and sp3 hybridised and the nitrogen atom is between sp2 hybridised. The B-H bond length is shorter in borazine than in boratabenzene and longer than in borane. The N-H bond is also shorter in borazine than in ammonia and pyridinium.
| Optimised Molecule | Optimisation Summary | Bond Lenghts (in Å) | Bond Angles (in °) | Energy (in hartree) | Energy (in kJ/mol) | ||
 |
|
|
-242.6845992 | -637 168.46 |
1: Optimisation Log file: Click here
The frequency calculation output will now be analysed. The six low frequencies are within ± 15 cm-1 of zero. The energy, the symmetry, the charge and the spin of the optimised structure did not change during the frequency calculation. This shows that the calculation was successful.

The N-H stretches in borazine and pyridinium is higher in energy than the N-H stretches in ammonia. This could be because the nitrogen orbital has a greater s-character and therefore overlaps better with the hydrogen s-orbital in the aromatic species. Also, the nitrogen lone pair is delocalised, which decreases the lone pair repulsive interaction with the N-H bonding orbital. The N-H stretches are higher in energy in borazine than in pyridinium which suggests greater delocalisation of the nitrogen lone pairs. This opposite trend is observed in the boron substituted analogues. The borane B-H stretch has a higher energy and is stronger than the borazine and the boratabenzene B-H stretching vibration. This is because the nitrogen atom in borazine donates electron density into the vacant orbital of boron. This causes a repulsive interaction between the boron p-orbital and the B-H bonding orbital which weakens the later. The out-of-plane bend is found at a lower wavenumber in borazine than in benzene and its mono-substituted analogues. This is because the N-B bonds in borazine are weaker than the C-C bonds in the other species. Indeed, the C-C stretches in the other molecules has a higher frequency than the B-N bonds stretching modes in borazine.
| Optimisation Summary | Frequency (in cm-1) | Intensity | Degeneracy | IR active? (yes/no) | Desctription |
 |
404 | 24 | 1 | yes | symmetric out-of-plane bend |
| 1246 | 0 | 1 | no | B-N asymmetric stretches (B move) | |
| 1314 | 0 | 1 | no | B-N asymmetric stretches (N move) | |
| 1400 | 11 | 2 | yes | B-N asymmetric stretch (N&B move) | |
| 1492 | 494 | 2 | yes | B-N symmetric stretch (N&B move) | |
| 2640 | 284 | 2 | yes | B-H asymmetric stretch | |
| 2650 | 0 | 1 | no | B-H symmetric stretch | |
| 3642 | 0 | 1 | no | N-H symmetric stretch | |
| 3644 | 40 | 2 | yes | N-H asymmetric stretch |
1: Frequency analysis .log file: Click here
Borazine has a higher symmetry than boratabenzene and pyridinium. This causes degenerate B-N stretches to arise and less IR active vibrational modes. The IR of borazine is still more complex than benzene as it only has D3h symmetry and not D6h. Weak N-H stretches N-H pyridinium because the N-H in pyridium is alone, cannot be cancelled out by other N-H motion therefore big net dipole.

NBO analysis

The output files of the population can be found here: DOI:10042/195352 . The charge distribution and key moleculear orbitals will be discussed at a later time. For now, let's look and the natural bonding orbitals in borazine. First, there are no valence nitrogen lone pairs which means that the nitrogen donates enough electron density into the boron vacant p-orbital to form a π-like bonding orbital. The B7-N10 π-bonding orbital is highly polarised towards the nitrogen atom. Both atoms contribute an unhybridised p-orbital to the bonding orbital. The nitrogen atom withdraws less electron density in the B-N single bond. The nitrogen atom contributes an sp2 orbital to the bond whereas the boron orbital is between sp2 and sp3. This is in accordance with the B-N-B and N-B-N bond angles. It is observed that all the valence NBOs have an occupancy of two electrons. Also, all the C-N bonds are equivalent. The same applies to the N-H, C-N and C=N bonding orbitals. The localised natural bonding orbitals of borazine as computed by the NBO calculation is shown to the right.

We will non look at the second order perturbation theory analysis of Fock matrix in NBO basis for borazine. As mentioned before, the π-bonding orbitals are heavily polarised on the nitrogen atom. Consequently, the B-N π antibonding orbitals are polarised on boron. This means that efficient electron delocalisation can only be achieved when the nitrogen atom of the donor π-bond is neighbour to the boron atom of the acceptor π* orbital. Hence, only three sets of π-π* donor-acceptor interactions are possible. They are listed in the table below. The stabilisation energy is the same for all the interactions, as in benzene. The E(2) stabilisation of the interaction is stronger in borazine. However, there are six such stabilising lewis-acid lewis-base partners in benzene. Overall, the stabilisation energy due to the delocalisation of electrons is greater in benzene.
Comparison of Benzene, Boratabenzene, Pyridinium and Borazine
Comparison of the charge distribution
| Molecule | Charge distribution (number) | Charge distribution (colour range) |
| Benzene |  |
 |
| Boratabenzene |  |
 |
| Pyridinium |  |
 |
| Borazine |  |
 |
The charge distribution charge (and colour) range is from -1.102 (bright red) to +1.102 (bright green) in all the molecules. The charge distribution is even in the benzene molecule. This is a reflection of the high degree of symmetry of the molecule. The carbon atoms have a charge number of - 0.239 whereas the hydrogen atoms have the exact opposite positive charge, + 0.239. The electropositive boron atom in boratabenzene is significantly less positively charged than in borazine +0.202 vs. +0.747. This is because the boron atom in borazine is next to two very electronegative nitrogen atoms which are replaced by less electronegative carbon atoms in boratabenzene. The charge of the carbon atoms in boratabenzene is linked to the resonance forms of the molecule. In one of the stable resonance forms, the negative charge will be on either of the carbons next to the boron atom. In one of the resonance forms, the negative charge is on the para-carbon. The meta-carbons are more negatively charged than the para-carbon because they are next to the positively charged boron atom, - 0.588 vs. - 0.340. None of the resonance forms have a negative charge located at the ortho-position which is as a result the less negatively charged carbon atom of the molecule (- 0.250). The same reasoning applies to the charge distribution of the carbon atoms in the pyridinium molecule. The stable resonance forms have the positive charge at the para- and meta- position making those atoms less negatively charged (- 0.122 and + 0.071). In addition to having a partial positive charge, the meta-carbons are adjacent to the electronegative nitrogen atom. The leads to those carbons having a positive charge number.
In borazine, the electropositive boron atoms have positive charge number of + 0.747 and the nitrogen atoms have a highly negative charge of -1.102. The boron and nitrogen atoms have the biggest spread in charge of the four molecule. This is because they also have the biggest electronegativity difference. The N-H hydrogen in pyridinium is the hydrogen atom with the highest positive charge number. This is because the nitrogen atom in pyridinium donates its electrons to a greater extent than in borazine and is more electron deficient as a result. The electron deficient electronegative pyridinium nitrogen will withdraw more electron density from its bond to hydrogen increasing the positive charge of the later. Similarly, the boratabenzene B-H hydrogen has a greater charge than the boron bound hydrogen in borazine. This is because there is a greater extent of π-electron donation into the vacant boron p-orbital in boratabenzene then in borazine. Thus, there is a greater negative charge build-up at the boron atom in boratabenzene, which in turn causes the electropositive boron to donate electron density towards the more electronegative hydrogen. All the carbon bound hydrogen atoms are positively charged. The more negatively charge the carbon that they are bonded to is, the more positively charged they are.
Comparison of three MOs
The first MO that was compared is a sandwich-like π-symmetry orbital made up of a cyclic array of in-phase p-orbital. In all of the four aromatic molecules each atom in the rings contribute one p-orbital orthogonal to the ring to form this bonding MO. There is no node in this orbital, it is non-degenerate and it is occupied by two electrons in all the molecules.
In benzene, the electron density is evenly distributed between the six ring atoms. In boratabenzene, the electron density is dragged away from the electropositive boron by the electronegative carbon atoms. The nitrogen atom in pyridinium withdraws electron density from the delocalised π-orbital. Similarly, the orbital in borazine is polarised towards the electronegative nitrogen atom the boron atoms get less than their share of the molecular bonding orbital. This result is in accordance with the above discussion on the charge distribution in the molecule. The linear combination of atomic orbitals (LCAO) representation shows the polarisation of the bonding orbital.
In all the molecules, the sandwich-like π-symmetry orbital is the 17th lowest energy molecular orbital (orbital number 1 being the lowest energy MO). The presence of electropositive boron atoms or electronegative nitrogen atoms is what differentiates the four aromatic molecules. Their presence or absence determines the relative energy of the MO under investigation. The 17th MO is lowest in energy in pyridinium because the molecule has an electronegative nitrogen atom (-0.64062 hartree). Borazine has three nitrogen atoms, but also has three electropositive boron atoms. Therefore, its 17th MO is only the second lowest in energy of the four molecules (-0.36134 hartree). Benzene has no electronegative nitrogen and its 17th MOs is higher in energy than the 17th MO of the pyridinium and borazine (-0.35994 hartree). Boratabenzene has an electropositive boron atom and no nitrogen atoms therefore its 17th MO as the highest energy of the series (-0.13209 hartree).
| Molecule | Molecular Orbital | LCAO representation | Symmetry | Energy (in hartree) |
| Benzene |  |
 |
a2u | -0.35994 |
| Boratabenzene |  |
 |
b2 | -0.13209 |
| Pyridinium |  |
 |
b1 | -0.64062 |
| Borazine |  |
 |
a"2 | -0.36134 |
The second MO that will be studied is one of the benzene HOMOs. The benzene orbital is compared with the equivalent molecular orbitals of its analogues in the table below. Note that the hydrogen 1s orbitals are not involved in these orbitals. This is because they have the wrong symmetry and cannot interact with the p-orbitals orthogonal to the rings. In benzene and borazine this orbital is degenerate. This is because borazine and benzene have a higher degree of symmetry than the C2v pyridinium and boratabenzene orbitals. The orbital is the HOMO of borazine, boratabenzene and of benzene, but it is not the HOMO of pyridinium. When substituting a carbon atom on the benzene ring with a nitrogen atom to form pyridinium, the electronegative nitrogen lowers the energy of the e1g orbital in which it is involved. The other former benzene e1g has a node on the nitrogen and the later does not contribute to the MO. The energy of the orbital is lowest in the pyridinium molecule because of the electronegative nitrogen atom (-0.50847 hartree) followed by borazine as before (-0.27594) and then by benzene at -0.24690 hartree. Once again, the boratabenzene orbital with its electropositive boron p-orbital has the higest energy (+0.01095 hartree). There seems to be a trend in the relative energy of the MOs of benzene and its isoelectronic analogues in which a given orbital has the lowest energy in pyridinium followed by borazine, benzene and finally boratabenzene. Note than in all the molecules, the MO has one nodal plane which cuts the molecule in approximately two halves.
As before, there is a high degree of symmetry and an even distribution of the molecular around the ring in benzene. In pyridinium, a half of the MO lies on the electronegative nitrogen atom whereas the other half is shared by three carbon atoms. In benzene, each bonding half of the MO is evenly shared by three carbon atoms. In boratabenzene, three carbon atoms are bonded together on one side of the nodal place and two carbon atoms and a boron atom are bonded together in the other half. The boron containing half of the MO gets the greatest share of the MO despite the electropositive boron atom because the carbon atoms adjacent to the electropositive boron are negatively charged and can withdraw more electron density and get a greater share of the MO. Indeed, the other half of the atom is overall less negatively charged and therefore gets a smaller portion of the MO. In borazine, the MO is polarised towards the half of the orbital that has two electronegative nitrogen atoms and only one boron atom rather than the one where there is only one nitrogen atom and two boron atoms.
| Molecule | Molecular Orbital | LCAO representation | Symmetry | Energy (in hartree) |
| Benzene |  |
 |
e1g | -0.24690 |
| Boratabenzene |  |
 |
b1 | +0.01095 |
| Pyridinium |  |
 |
b1 | -0.50847 |
| Borazine |  |
 |
b1 | -0.27594 |
Finally, the lowest energy valence bonding orbital will be compared in all the aromatic species. The symmetry of this orbital is decreased is the benzene analogues compared to benzene itself. The previously identified trend in the relative energy of the orbitals of the molecule applies here. Indeed, the pyridinium molecule MO with its electronegative nitrogen orbital contribution is the lowest in energy at -1.21399 hartree followed by borazine at -0.88856 hartree. We then have the benzene a1g orbital at -0.84671 hartree and finally the boratabenzene MO with the electropositive boron at -0.60437 hartree.
As for the previously studied orbital, there is an even distribution of the MO around the ring in benzene. Uneven charge distribution in the ring of the benzene analogues causes the electron cloud to be polarised towards the most electronegative atoms. In pyridinium, the nitrogen atom withdraw so much electron density from the carbon atoms that they become electron deficient. The three most affected carbon atoms compensate by withdrawing the electron density from the hydrogen atoms that they are bonded to. So much so that the later are no longer involved in the MO. A similar situation is observed in boratabenzene where the electron deficient boron does not want to share electrons with the hydrogen that it is bonded two. The later hydrogen atom is excluded from the MO as a result. In this MO, the orbital is polarised towards the carbon atoms as they are more electronegative than boron. Hydrogen is also electronegative and can withdraw some electron density from the C-H bonds. The polarisation in the borazine orbital is a mix of boratabenzene and pyridinium. The electropositive boron atoms and their hydrogen get less than their share of the electron density. The orbital is polarised towards the electronegative nitrogen atoms and their hydrogen. This is in agreement with the literature.[20]
| Molecule | Molecular Orbital | LCAO representation | Symmetry | Energy (in hartree) |
| Benzene |  |
 |
a1g | -0.84671 |
| Boratabenzene |  |
 |
a1 | -0.60437 |
| Pyridinium |  |
 |
a1 | -1.21399 |
| Borazine |  |
 |
a1 | -0.88856 |
Full MO comparison
The relative energy of the MOs in the four molecules is shown below. We can see that pyridinium has the lowest energy molecular orbitals. As before, this is because of the electronegative nitrogen atom. Boratabenzene has the highest energy MOs. Again, this is because of the electropositive boron atom. Borazine, has three electronegative nitrogen atom and three electropositive boron atoms. The electronegativity of nitrogen and the electropositivity of boron give a net electronegativity alike that of carbon and therefore the energy of the orbital in benzene is similar to the energy of the orbitals in borazine. MOs in borazine which are mainly contributed for by boron atoms have energies higher than the corresponding MO in benzene. Indeed, the antibonding MOs of borazine are higher in energy than the corresponding MOs in benzene. On the opposite, the low energy nitrogen dominated valence MOs are lower in energy in borazine than in benzene. For example, orbital 7 is at -0.88856 hartree in borazine and at -0.84671 hartree in benzene.
Benzene is the molecule with the highest symmetry and therefor it has the most sets of degenerate orbitals. It is followed by borazine, which has the second highest symmetry point group, D3h. Substitution of a main group on the benzene ring to give the two lower symmetry point group C2v analogues, pyridinium and boratabenzene, removes the degeneracy from all the valence orbitals. The biggest homo-lumo gap is observed in borazine at 0.25171 hartree followed by benzene 0.24426 hartree, pyridinium 0.22045 hartree and boratabenzene 0.20377 hartree. A large HOMO-LUMO gap means that it is difficult for molecule to attack the LUMO of borazine to react with it. Based on this, borazine is most likely less reactive than benzene, which itself is less reactive than the positively charged pyridinium. The most reactive of the four aromatic species would be the negatively charged boratabenzene. However, the carbon atoms around the benzene ring are also non-polar, which makes benzene the least reactive species.
Finally, it is noted that substituting carbon atoms for main group elements in a benzene ring to form pyridinium, boratabenzene and borazine causes changes not only in the energy of the orbitals but also in their ordering. For instance, the HOMO of benzene is not the HOMO in pyridinium as highlighted in the previous section of this report.

References
- ↑ 1.0 1.1 1.2 1.3 Y. R. Luo, Comprehensive Handbook of Chemical Bond Energies, CRC Press, Boca Raton, FL, 2007.
- ↑ D. E. Carter, J. B. Sullivan Jr., Clinical Environmental Health and Toxic Exposures, J. B. Sullivan, G. R. Krieger, Lippincott Williams & Wilkins, 2nd edition, 2001, ch. 86, pp. 958-959.
- ↑ Dr. U. Biermann1, Prof. Dr. J. O. Metzger, ChemSusChem, 2014, 7, 644-649. DOI:10.1002/cssc.201300627
- ↑ 4.0 4.1 4.2 K. Kawaguchi, J. Phys. Chem., 1992, 96, 3411. DOI:10.1063/1.461942 Cite error: Invalid
<ref>tag; name "bondBH" defined multiple times with different content - ↑ C. Da Silva, et al. J. Mol. Liq., 2009, 147, 83-95.
- ↑ A. F. Holleman, N. Wiberg, E. Wiberg, Inorganic Chemistry, Academic Press, 34th edition, 2001, pp. 1760.
- ↑ 7.0 7.1 B. Cordero, V. Goméz, A. E. Platero-Prats, M. Revés, J. Echeverría, E. Cremades, F. Barragán, S. Alvarez, Dalton Trans., 2008, 21, 2832-2838.DOI:10.1039/B801115J
- ↑ L. E. Sutton, Tables of Interatomic Distances and Configuration in Molecules and Ions - Supplement 1956—1959, Special Publication No. 18, The Chemical Society, London, 1965.
- ↑ J. Trotter, Tetrahedron, 1960, 8, 13-22. DOI:10.1016/S0040-4020(01)93325-3
- ↑ E. Heilbronner, J. Chem. Educ., 1989, 66, 471–478.
- ↑ R. S. Berry, J. Chem. Phys., 1961, 35, 29–35.; R. S. Berry, J. Chem. Phys., 1961, 35, 2253–2254.
- ↑ 12.0 12.1 S. Shaik, A. Shurki, D. Danovich, P. C. Hiberty, Chem. Rev., 2001, 101,1501–1540.
- ↑ S. Shaik, P. C. Hiberty, J.-M. Lefour, G. Ohanessian, J. Am. Chem. Soc., 1987, 109, 363–374.
- ↑ K. Jug, A. M. Köster, J. Am. Chem. Soc., 1990, 112, 6772–6777.
- ↑ 15.0 15.1 K. Jug,P. C. Hiberty, S. Shaik, Chem. Rev., 2001, 101, 1477–1500.
- ↑ E. D. Glendening, R. Faust, A. Streitwieser, K. P. C. Vollhardt, F. Weinhold, J. Am. Chem. Soc., 1993, 115, 10 952–10 957.
- ↑ B. Kovačević, D. Barić, Z. B. Maksić, T. Müller, ChemPhysChem, 2004, 5, 1352-1364. DOI:10.1002/cphc.200400061
- ↑ Y. Yan, J. Gu, A. B. Bocarsly, Aerosol Air Qual. Res., 2014, 14, 515–521.DOI:10.4209/aaqr.2013.06.0227
- ↑ J. House, K. A. House,Descriptive Inorganic Chemistry, Academic Press, 2010, ch. 8, pp. 198.
- ↑ G. Raj, Advanced Inorganic Chemistry Vol-I, Krishna Prakashan Media, GOEL Publishing House, 31st edition, 2008, ch. 17, p. 691-692. ISBN: 81-87224-03-7