Rep:Mod:EKJ1021
3rd Year Computational Lab: Inorganic Module
Constructing BH3 molecule
Optimisation log file here
Method: B3LYP
Basis set: 3-21G
Calculation type: Optimisation(OPT)
The basis set of 3-21G determines the accuracy which is low in this case.
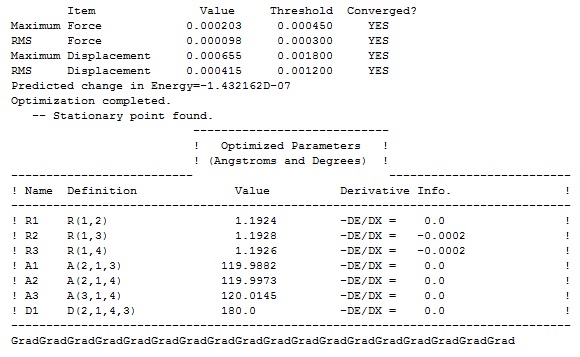
All three bond angles appeared to be 120 degrees.
| 2H | 3H | 4H | |
|---|---|---|---|
| 1B | 1.53 | 1.54 | 1.55 |
Convergence of BH3 molecule
Total energy and RMS plot
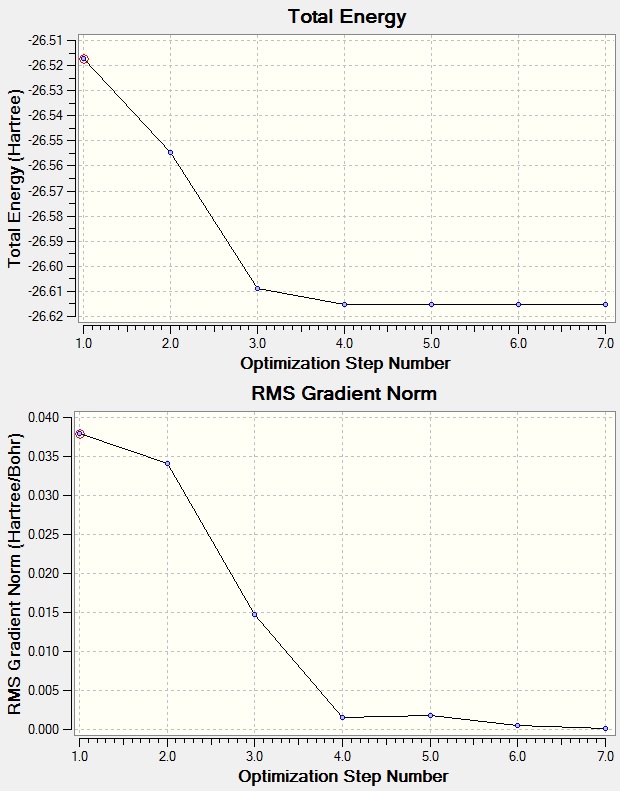
We optimized the molecule to find the equilibrium point where there are no net forces on the molecule (The lowest point on the potential energy vs radius plot).
The 'Total Energy curve' gives information about the program traveling across potential energy surface(PES), whereas second plot gives 'Root Mean Square(RMS)' showing the gradient reaching zero as molecule approaches equilibrium point; minimum.
Optimisation
Improved basis sets
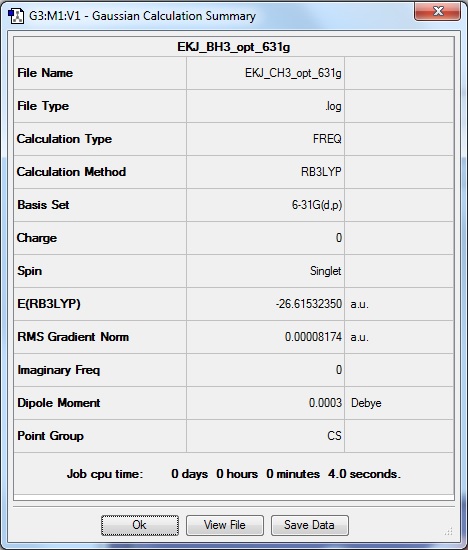
3-21G BH3 molecule is optimised to higher level basis set: 6-31G(d,p)
Optimisation log file here
| summary data | convergence | Jmol | |||
|---|---|---|---|---|---|
|
Item Value Threshold Converged? Maximum Force 0.000203 0.000450 YES RMS Force 0.000098 0.000300 YES Maximum Displacement 0.000680 0.001800 YES RMS Displacement 0.000412 0.001200 YES |
|
Method: RB3LYP
Basis set: 6-31G(d,p)
Calculation type: Frequency
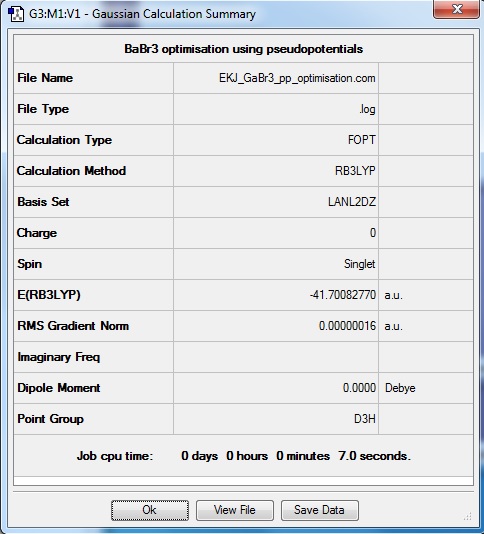
Molecule of BBr3
Optimisation log file here
| summary data | convergence | Jmol | |||
|---|---|---|---|---|---|
|
Item Value Threshold Converged? Maximum Force 0.000000 0.000450 YES RMS Force 0.000000 0.000300 YES Maximum Displacement 0.000003 0.001800 YES RMS Displacement 0.000002 0.001200 YES |
|
Geometry Analysis
| BH3 | BBr3 | GaBr3 | |
|---|---|---|---|
| r(E-X) Å | 1.18 | 2.02 | 2.33 |
| θ(X-E-X) degrees(º) | 120.00 | 120.00 | 120.00 |
All molecules have bond angles of 120º expected from D3H molecule. However the bond lengths were different depending on the nature of central atom or the ligands due to several factors.
As ligands are substituted from BH3 to BBr3 significant change in bond length (0.84 Å) was observed because of the differences in size and bond strength of hydrogen and bromine. BBr3 is a strong lewis acid with bromine withdrawing electron density from central boron atom. Bromine has many more electrons than hydrogen, and the outermost electron is occupied in 4p orbitals which is much more diffuse and larger than 1s of hydrogen. Moreover since Br has 'partially filled 4p orbital' available for back-donation into empty B 2p orbital, which is simply not possible with hydrogen. These factors combine to give B-Br bond length smaller than expected value.
To compare between BBr3 and GaBr3, the difference in bond length is 0.31 Å. The central atom has changed from B to Ga; both in group 13 but Ga in further down on the group. This means that electrons in Ga are occupied in more diffuse 4p orbitals and B electrons in less diffuse 2p orbitals. Since valence electrons of Br are also occupied in 4p orbitals, the interation between 4p-4p of Ga-Br would be stronger than that of 2p-40 B-Br. This results in stronger bonding.
Chemical bond?
Chemical bond is the way that two or more substances are held together by attraction of atoms through transferring and sharing electrons as well as electrostatic forces.
Strong bonds are 'intramolecular' forces which bind the atoms in a molecule. This is done by transferring or sharing electrons between atoms and depends significantly on the electrostatic force between protons in nucleus and electrons in the orbit. Typical strong bonds are ionic, covalent and metallic bonding.
In contrast, weak bonds are 'intermolecular' forces between molecules with dissociation energy of 4-13 KJ/mol. This force of attraction bind a molecule to another. This includes hydrogen bonding, dipole-dipole interactions or London dispersion.
BH3 frequency file
BH3:EKJ BH3/6-31G(d,p) Frequency file: here
optimisation file: DOI:10042/31160
| summary data | low modes |
|---|---|

|
Low frequencies --- -11.7227 -11.7149 -6.6070 0.0005 0.00278 0.4278 Low frequencies --- 1162.9743 1213.1388 1213.1390 |
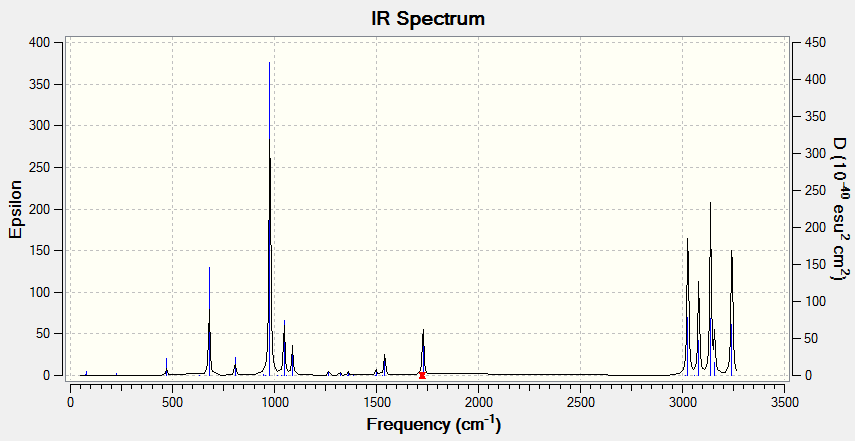
Vibrational spectrum for BH3
| wavenumber | intensity | IR active? | type |
| 1163 | 93 | yes | bend |
| 1213 | 14 | very slight | bend |
| 1213 | 14 | very slight | bend |
| 2583 | 0 | no | stretch |
| 2716 | 126 | yes | stretch |
| 2716 | 126 | yes | stretch |
The IR spectrum obtained from six values of frequencies only give three peaks at 1163, 1213 and 2716 cm-1. The vibrations at 1213cm-1 and 2716cm-1 are degenerate, each giving one peak. Also, vibration at 2583 cm-1 is 'symmetric', hence not shown in IR spectrum.
GaBr3 frequency file
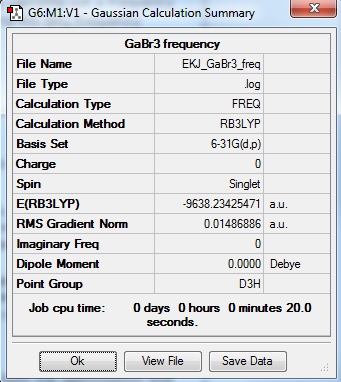
GaBr3:EKJ GaBr3 Frequency file: here
| summary data | low modes |
|---|---|
|
Low frequencies --- 0.0153 0.0216 0.0236 46.8957 46.9079 46.9079 Low frequencies --- 94.3453 94.3456 141.7064 |
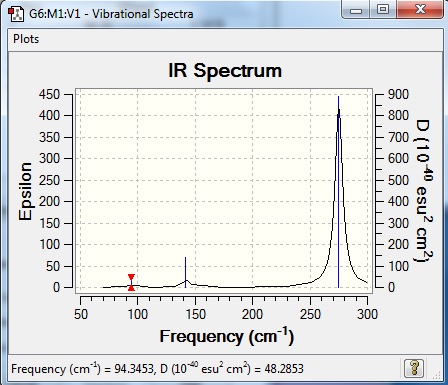
Vibrational spectrum for GaBr3
| wavenumber | Intensity | IR active? | type |
| 94.35 | no | bend | |
| 94.35 | no | bend | |
| 141.7 | very slight | bend | |
| 172.5 | no | stretch | |
| 275.1 | yes | stretch | |
| 275.1 | yes | stretch |
The frequencies for GaBr3 are all significantly lower than those of BH3. The reason for this is because both central atom (B) and ligands (H) are substituted to atoms of higher masses. With increasing mass of the molecule, the vibrational frequency will decrease; frequency is inversely proportional to the square root of reduced mass of atoms in the molecules.
Because of their symmetries of D3h, both spectra show similar vibrations.
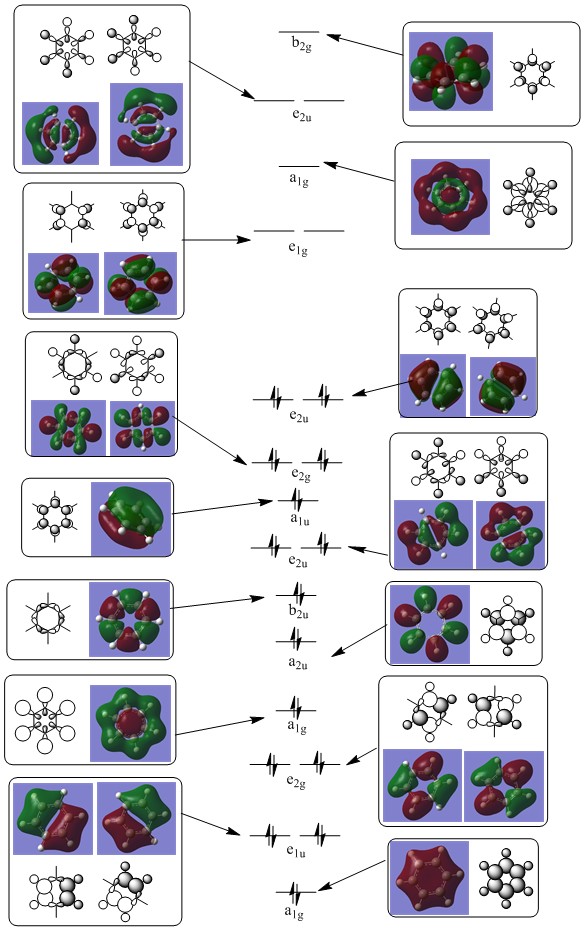
BH3 Molecular orbital diagram
Molecular diagram was constructed with calculations from Gaussian and chemdraw. The energy levels are only estimated.
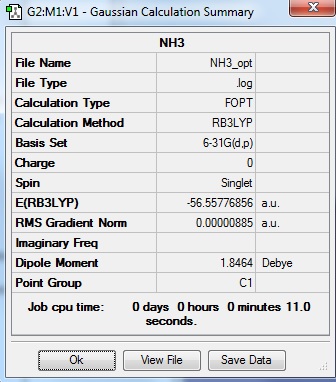
NH3 optimisation
Optimisation log file here
| summary data | convergence | Jmol | |||
|---|---|---|---|---|---|
|
Item Value Threshold Converged? Maximum Force 0.000024 0.000450 YES RMS Force 0.000012 0.000300 YES Maximum Displacement 0.000079 0.001800 YES RMS Displacement 0.000053 0.001200 YES |
|
NH3 frequency file
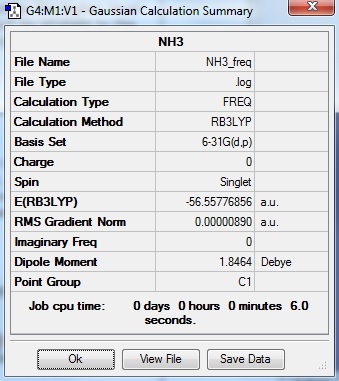
NH3:EKJ NH3 Frequency file: here
| summary data | low modes |
|---|---|
|
Low frequencies --- -30.7178 -0.0013 0.0007 0.0010 20.2209 28.2838 Low frequencies --- 1089.5549 1694.1246 1694.1858 |
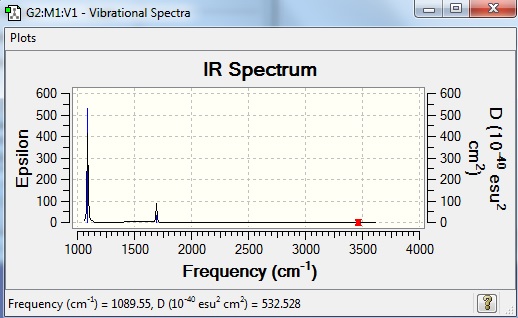
Vibrational spectrum for NH3
| wavenumber | intensity | IR active? | type |
| 1090 | 145.4 | yes | bend |
| 1694 | 13.6 | slight | bend |
| 1694 | 13.6 | slight | bend |
| 3461 | 1.1 | no | stretch |
| 3589 | 0.27 | no | stretch |
| 3589 | 0.27 | no | stretch |
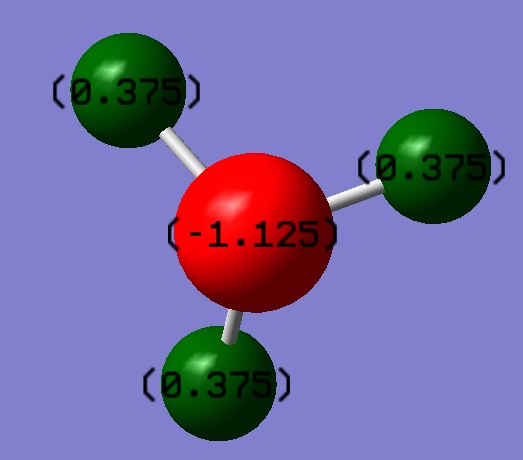
NBO analysis of NH3
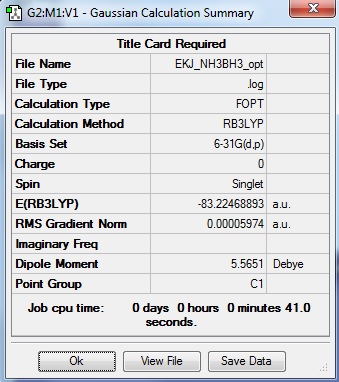
NH3BH3 Analysis
| summary data | convergence | Jmol | |||
|---|---|---|---|---|---|
|
Item Value Threshold Converged? Maximum Force 0.000123 0.000450 YES RMS Force 0.000058 0.000300 YES Maximum Displacement 0.000515 0.001800 YES RMS Displacement 0.000296 0.001200 YES |
|
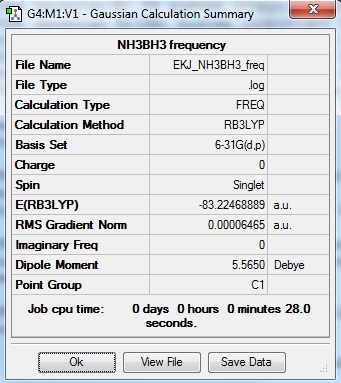
NH3BH33:EKJ NH3BH3 Frequency file: here
| summary data | low modes |
|---|---|
|
Low frequencies --- 0.0010 0.0011 0.0012 17.3560 17.7505 38.8436 Low frequencies --- 266.2320 632.1439 639.3754 |
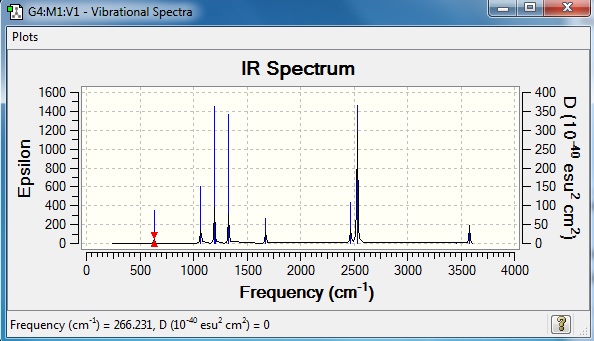
Vibrational spectrum for NH3BH3
| wavenumber | intensity | IR active? | type |
| 266.2 | 0 | no | bend |
| 632.1 | 14 | no | stretch |
| 639.4 | 4 | yes | bend |
| 639.5 | 4 | yes | bend |
| 1069 | 41 | yes | bend |
| 1069 | 41 | yes | bend |
| 1196 | 109 | yes | stretch |
| 1204 | 3 | yes | bend |
| 1204 | 3 | yes | bend |
| 1329 | 113 | yes | stretch |
| 1676 | 28 | yes | bend |
| 1676 | 28 | yes | bend |
| 2470 | 67 | yes | stretch |
| 2530 | 230 | yes | stretch |
| 2530 | 230 | yes | stretch |
| 3462 | 2 | no | stretch |
| 3579 | 28 | yes | stretch |
| 3579 | 28 | yes | stretch |
Determination of bond energy
E(NH3) = -56.5577686 au
E(BH3) = -26.6153236 au
E(NH3 BH3) = -83.2246889 au
ΔE = E(NH3 BH3) - [E(NH3)+E(BH3)]
= (-83.2246889)-[(-56.5577686)+(-26.6153236)]
= -0.0515967 au
1 au = 2625.50 kJ/mol
ΔE = - 135.47 kJ/mol
Aromaticity
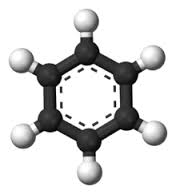
Benzene
The fragments made of benzene and its derivatives are classified as 'aromatics' which has meanings associated the stability resulting from its resonance properties. The identical bond lengths of C-H single bonds and double bonds was lead to Kekule structure with ring structure of π orbitals overlap.
Other analogues of aromatic compounds for example boratabenzene, pyridine and borazine have similar property and structure to benzene with one or more atoms substituted to another are expected to have different chemical and physical properties. Furthermore, since the ring atom is changed, the molecular orbital(MO) will also be changed significantly.
The aim of this project is to analyze benzene and its derivative using computational chemistry program Gaussian.
Optimisation
Benzene was first constructed using 3-21G basis set, then optimised to more accurate 6-31G basis set. The table below shows successive optimisation of the benzene molecule.
Optimisation log file here
| summary data | convergence | Jmol | |||
|---|---|---|---|---|---|

|
Item Value Threshold Converged? Maximum Force 0.000198 0.000450 YES RMS Force 0.000082 0.000300 YES Maximum Displacement 0.000849 0.001800 YES RMS Displacement 0.000305 0.001200 YES |
|
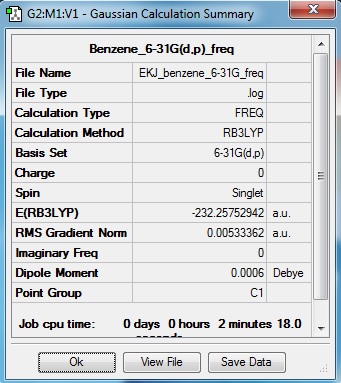
Frequency analysis
Benzene Frequency file: here
| summary data | low modes |
|---|---|
|
 Low frequencies ---  -0.0008  -0.0007  0.0003  55.9811  56.8433  59.3704
 Low frequencies ---  421.8710  422.0833  626.3430
|
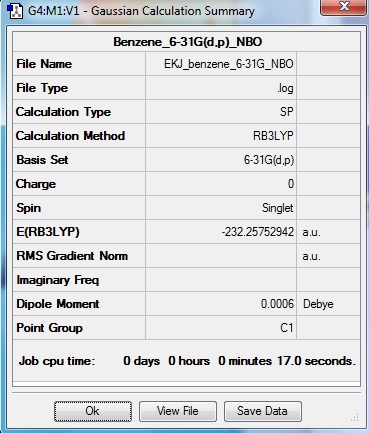
NBO analysis
As expected, benzene is a symmetrical molecule with symmetrical charge distribition. The carbon atoms appear to have -0.085 charge and that of hydrogen is +0.085. The reason that carbon has negative value is because it is more electronegative than hydrogen; drawing electron towards itself. All charges add to zero giving overall zero charge. The dipole moment is very close to zero as expected form charges and distribution of charges.
Optimisation log file here
| summary data | Jmol | |||
|---|---|---|---|---|
|
|
Molecular Orbital Diagram
Molecular orbital diagram for benzene was constructed by NBO analysis of Gaussian.
Optimisation Comparison
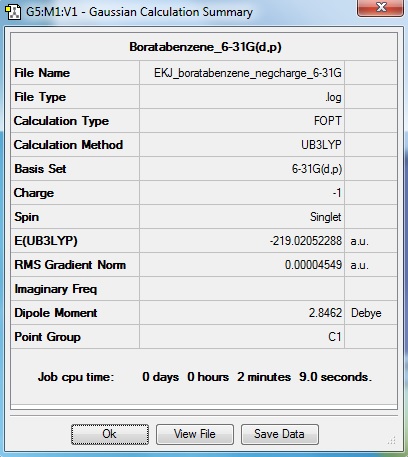
Boratabenzene
Optimisation log file here
| summary data | convergence | Jmol | |||
|---|---|---|---|---|---|
|
Item Value Threshold Converged? Maximum Force 0.000133 0.000450 YES RMS Force 0.000028 0.000300 YES Maximum Displacement 0.000600 0.001800 YES RMS Displacement 0.000171 0.001200 YES |
|
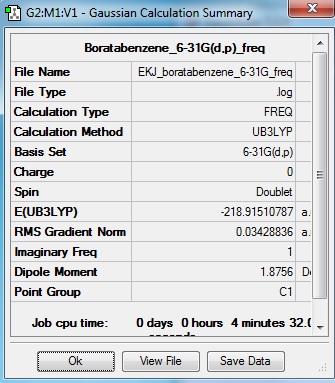
Boratabenzene is an aromatic compound with one C-H unit substituted to B-H. Since B is less electonegative than C, charge distribution will appear differently. Also, the dipole moment appear to be very different to that of benzene.
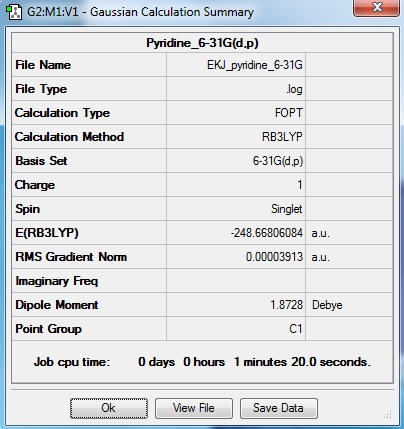
Pyridine
Optimisation log file here
| summary data | convergence | Jmol | |||
|---|---|---|---|---|---|
|
Item Value Threshold Converged? Maximum Force 0.000065 0.000450 YES RMS Force 0.000023 0.000300 YES Maximum Displacement 0.000837 0.001800 YES RMS Displacement 0.000178 0.001200 YES |
|
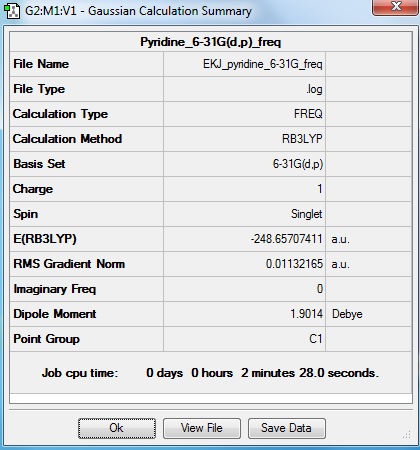
Pyridine is an aromatic compound with one C-H substituted to N-H unit. N is more electronegative than both carbon and borane.
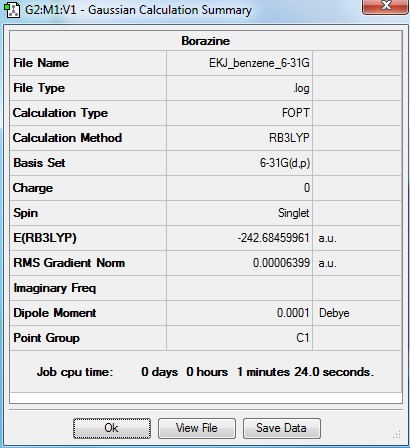
Borazine
Optimisation log file here
| summary data | convergence | Jmol | |||
|---|---|---|---|---|---|
|
Item Value Threshold Converged? Maximum Force 0.000085 0.000450 YES RMS Force 0.000033 0.000300 YES Maximum Displacement 0.000249 0.001800 YES RMS Displacement 0.000077 0.001200 YES |
|
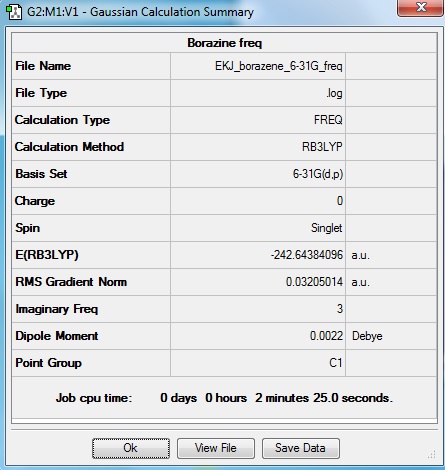
Borazine is an inorganic aromatic compound with NH and BH units alternating. This compound has isostructural and isoelectrical properties to benzene which is why borazine is called 'inorganic benzene'.
Frequency Comparison
Boratabenzene
Optimisation log file here
| summary data | Low modes | Jmol | |||
|---|---|---|---|---|---|
|
Low frequencies --- -713.9558 -237.3218 -217.3403 -0.0009 -0.0009 -0.0007 Low frequencies --- 19.2226 278.1106 326.3331 |
|
Pyridine
Optimisation log file here
| summary data | Low modes | Jmol | |||
|---|---|---|---|---|---|
|
Low frequencies --- 0.0004 0.0006 0.0009 122.2863 123.1958 133.4392 Low frequencies --- 430.1227 433.5911 621.7804 |
|
Borazine
Optimisation log file here
| summary data | Low modes | Jmol | |||
|---|---|---|---|---|---|
|
Low frequencies --- -431.1695 -423.1899 -422.8154 -198.5182 -0.0006 -0.0003 Low frequencies --- 0.0009 46.1688 47.1150 |
|
Charge Distribution
| Charge Distribution by colour | ||
|---|---|---|
| Boratabenzene | Pyridine | Borazine |

|
|
|
| Charge Distribution by number | ||
|---|---|---|
| Boratabenzene | Pyridine | Borazine |
|

|
|
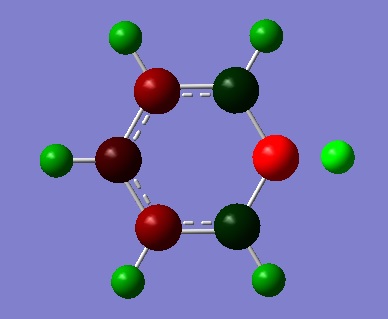
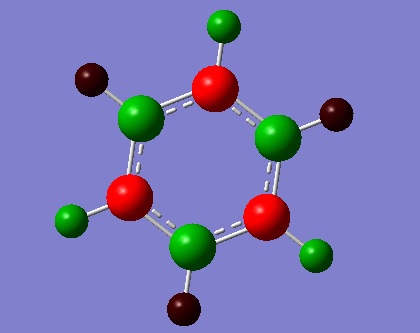
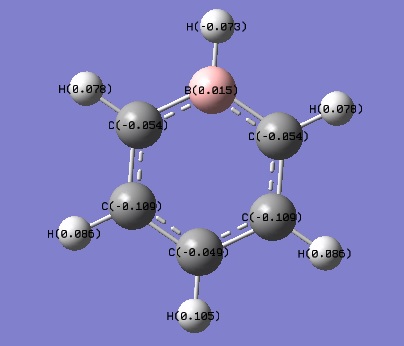
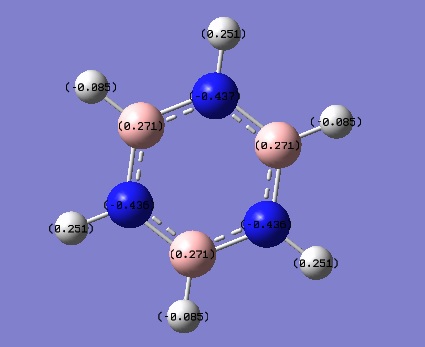
The charge distribution was constructed from the NBO visualisations of Gaussian. The dark(red/blue) atoms show electonegative atoms and light(green) atoms give electopositive atoms.
Compare to NBO visualisations of benzene, there are significant differences on boratabenzene, pyridine and borazine. The colour and charge are given on the table.
Looking at boratabenzene, because of insertion of B-H unit in the place of C-H unit, the symmetrical distribution is broken. B has charge of 0.015 which is larger compare to those of ortho, meta and para carbons(-0.054, -0.109, -0.049). Charge on H also appear different; hydrogen bonded to B bearing charge of -0.073, this is very different to other H bearing positive charges. This is because H is more electronegative than B so B-H gives polar nature. All charge add to zero.
For pyridine, again the symmetrical charge distribution is broken dye to insertion of electronegative N-H unit shown by blue colour on the distribution by number view. The high electronegative nitrogen distort the distribution more than boratabenzene; it can be seen that all Hs have much larger charge than for boratabenzene(0.510, 0.292, 0.301, 0.294). All charge add to 1.
Lastly, 'inorganic benzene' borazine is a symmetric molecule with overall charge of zero as expected. N and B bear charges of 0.436 and 0.271 which are significantly larger than values for boratabenzene and pyridine. H attached to N gives value 0.251 again much larger than -0.085 of B-H. The large difference in electronegativity between N and B increase overall polarity of the molecule.
MO Comparison
| Comparison | Benzene | Boratabenzene | Pyridine | Borazine | ChemDraw diagram |
|---|---|---|---|---|---|
| 1 | 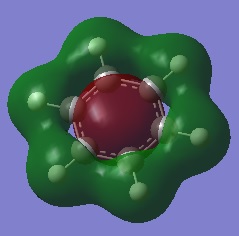 |
 |
 |
 |
|
| Energy (au) | -0.5158 | -0.51429 | -0.77223 | -0.53976 | - |
| MO placement | 12 | 12 | 12 | 10 | - |
| 2 | 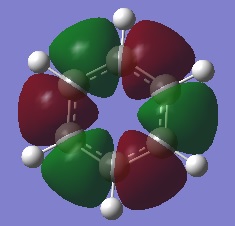 |
 |
 |
 |
|
| Energy (au) | -0.43943 | -0.42674 | -0.70196 | -0.43622 | - |
| MO placement | 14 | 13 | 13 | 13 | - |
| 3 | 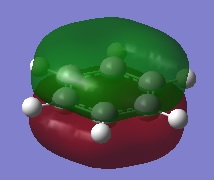 |
 |
 |
 |

|
| Energy (au) | -0.36088 | -0.34654 | -0.62501 | -0.36795 | - |
| MO placement | 17 | 17 | 17 | 17 | - |
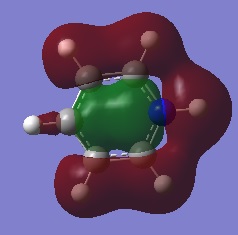
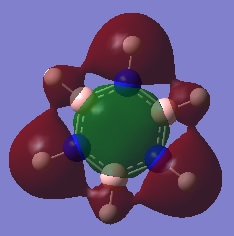
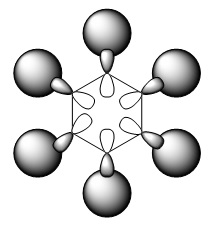
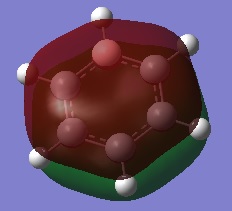
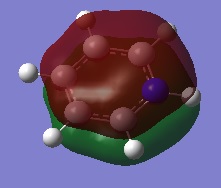
The first comparisons show overlap between s orbital of hydrogen and p orbital of carbon, boron and nitrogen. As seen there is a phase difference between hydrogen and central atoms, giving overall highly bonding character. Benzene has a perfect symmetry whereas boratabenzene has a slightly distorted distribution due to a small difference in electronegativity between B and C(approximately 0.5). Similar energy of benzene and boratabenzene back up this idea. However pyridine and borazine appear very differently. Nitrogen is significantly more electronegative than boron and carbon, so the presence of N polarise the molecule towards N itself. The pyridine MO show that electrons are drawn towards nitrogen. Also, for borazine where there are alternating B-H and N-H units, distribution is highly polarised towards nitrogen. It is more dynamic than pyridine because of the difference in electronegativity between N and B. The highly unsymmetric distribution of pyridine results in more negative energy.
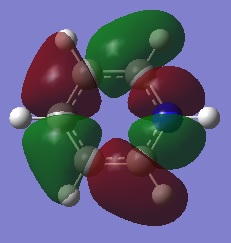
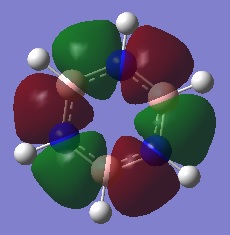
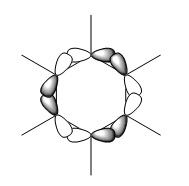
The second sets of MOs show p orbital sigma overlap between adjacent central atoms. For these, there are no contribution from H orbitals. Benzene and borazine are very highly symmetric with relatively low energy around -0.44 au. The MOs are unevenly distributed for boratabenzene and pyridine in the presence of one B-H unit and N-H consecutively; especially for pyridine, the orbitals are drawn towards electronegative N, highly distorted structure gives more negative energy compared to other analogues.
Last MO diagrams are obviously p orbital pi overlap, this is possible because all C, N and B have p orbital available to interact. There are clear phase differences above and below the plane with no nodes so highly bonding character. Just like other comparison sets, the degree of symmetry depends on the nature of replaced units; thus pyridine is highly unsymmetrical. Electrons are drawn towards nitrogen significantly on pyridine and borazine.
Because of the unsymmetrical nature and energy difference of boratabenzene, pyridine and borazine, the shape and energy of molecular orbitals of each will look different.
Conclusion
By studying the electronic structure of benzene and its analogues boratabenzene, pyridine and borazine, it was seen that the orbitals appear significantly different depending on the nature of the atoms, for example electronegativity. Gaussian gave clear view and calculation of the constructed structures which helped to analyse the proposed structures.


