Rep:Mod:1610
Introduction
The aim of this project is to analyse the structure and bonding in molecules using computational chemistry. Computational chemistry is a vital part of chemistry, as it enables scientist to calculate properties of molecules which include the predicted IR as well as the length and angle of bonds. The software used in this project includes Guassian and Gaussview 5; various molecules including BH3, TlBr3 and BBr3 were optimised and information on these molecules was obtained. The results from the project are compared to those in literature to verify the validity of the results.
Optimisation of molecules
By optimising the molecule, it allows us to gain insight into the lowest energy conformer of the molecule, and therefore the most stable state of the molecule.
Borane Optimisation
BH3 3-21G
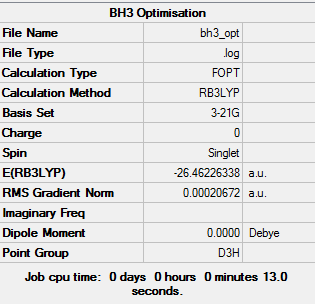
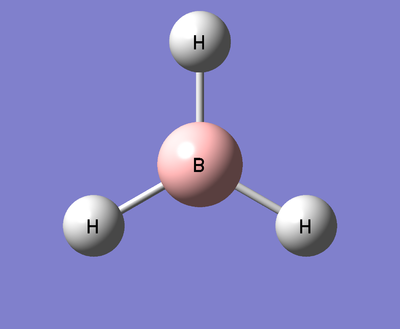
Borane is a trigonal planar compound made up of boron and hydrogen, it mainly exists in the gaseous state and can dimerise to B2H6. At first, a minimal basis set (3-21G) was chosen along with a DFT method and B3LYP hybrid functional, the results obtained from the log file are illustrated below:
        Item               Value     Threshold  Converged?
 Maximum Force            0.000413     0.000450     YES
 RMS     Force            0.000271     0.000300     YES
 Maximum Displacement     0.001643     0.001800     YES
 RMS     Displacement     0.001076     0.001200     YES
The data above shows that the optimisation converged successfully.
| Optimised B-H bond length | 1.19349Å |
| Optimised H-B-H bond angle | 120.0˚ |
These values are in agreement with those in literature [1]
BH3 6-31G d,p
Afterwards, the basis set was changed to 6-31G and the results analysed, compared to the other basis set the 6-31G is more complex however, it gives a clearer view of the molecule. The results from the log file are illustrated below:
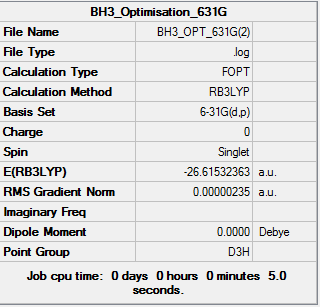
                Item               Value     Threshold  Converged?
 Maximum Force            0.000005     0.000450     YES
 RMS     Force            0.000003     0.000300     YES
 Maximum Displacement     0.000019     0.001800     YES
 RMS     Displacement     0.000012     0.001200     YES
Total energies for the different optimisations of borane:
3-21G optimised structure = -26.46226338 a.u.
6-31G(d,p) optimised structure = -26.61532363 a.u.
Thallium(III) Bromide
Computational chemistry enables us to analyse the molecule Tl without putting ourselves in danger to the toxic properties of the element.The medium basis set LANL2DZ was used with pseudo-potentials (due to the size of the atoms), the point group restriction was set at D3h (0.001 very tight). The HPC server was used to carry out the calculation.
The results from the log file are illustrated below:
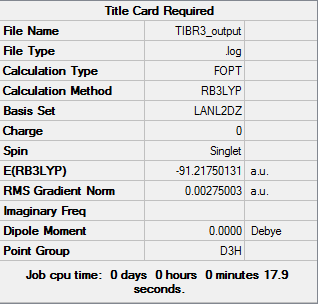
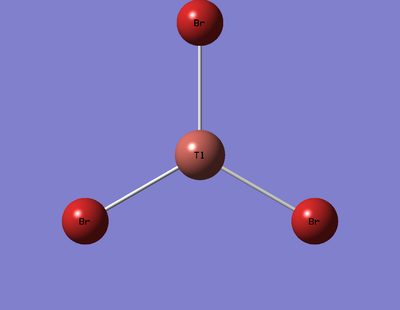
        Item               Value     Threshold  Converged?
 Maximum Force            0.000002     0.000450     YES
 RMS     Force            0.000001     0.000300     YES
 Maximum Displacement     0.000022     0.001800     YES
 RMS     Displacement     0.000014     0.001200     YES
| Optimised TI-Br bond length | 2.65095 |
| Optimised Br-TI-Br bond angle | 120.0 |
These values are in agreement with those stated in literature, 2.52 Å[2] and 120[3]
Boron tribromide
Boron tribromide is also trigonal planar, it is used as a lewis acid in many reactions and also is used as a demthylating and dealkylating agent in the cleavage of ethers. The compound has both light and heavy atoms therefore a mix of pseudo-potentials and basis sets was required. The method was set to GEN and, to account for the basis sets for individual atoms, furthermore the text file was altered before submission to the HPC, with the following text:
B 0
6-31G(d,p)
****
Br 0
LanL2DZ
****

Br 0

LanL2DZ
D-space published link The results from the log file are illustrated below.

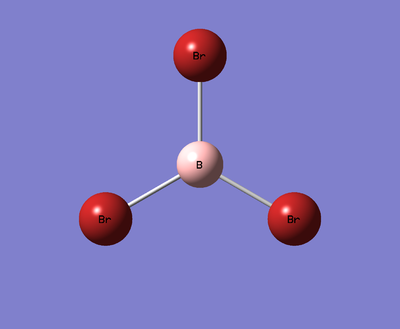
        Item               Value     Threshold  Converged?
 Maximum Force            0.000008     0.000450     YES
 RMS     Force            0.000005     0.000300     YES
 Maximum Displacement     0.000036     0.001800     YES
 RMS     Displacement     0.000023     0.001200     YES
| Optimised B-Br bond length | 1.93396Å |
| Optimised Br-B-Br bond angle | 120.0 |
These values are in agreement with those in literature
Bond Length Analysis
| Molecule | Bond Length (a.u.) | Basis set used |
|---|---|---|
| BH3 | 1.19349 | 6-31G(d,p) |
| TlBr3 | 2.65095 | LanL2DZ |
| BBr3 | 1.93396 | Gen |
The factors that influence the bond length for the molecules above are:
(i) Extent of orbital overlap
(ii) Atom size
(iii) Electronegativity of atoms
From the table above, the results indicate that as the size of the atom changes (from H to Br) the bond length also increases. This can be explained by considering effects of orbital size. For instance, the larger the orbital, the weaker the extent of orbital overlap/interaction and therefore as the bromide is more diffuse than the Hydrogen it results in weaker bonding and will have a longer bond length.
The second observation is that the Tl-Br is longer than the B-Br:
Again, this can be explained by considering the effect of orbital size, as Tl is the larger atom (6p orbitals) and B (2p orbital), as a result more diffuse orbitals and weaker orbital overlap. However, Tl and B have the same number of valence electrons and both have trigonal planar structures.
The Pauling electronegativity values for the atoms are: Br (2.74) [4], B (2.01)[5] REF and H (2.1)[6] REF. Therefore in terms of the electronegativity difference: B-Br > B-H.
Bonding
During the project, Gaussview would sometimes not represent the bonds in the images. This is because when the calculated bond length on gaussview is longer than it is expected to be, the bond is not displayed. Essentially because Gaussview relates to bond lengths in organic molecules. Therefore, it is important to consider the definition of the "bond". A bond can be described as an area where there is high electron density between atoms, for example a bond can be formed when the combined electron configuration leads to a stable energetic interaction. For the molecules discussed so far the bonding is described by that of covalent bonding.
(i) Covalent bond:a chemical bond that involves sharing a pair of electrons between atoms in a molecule.
(ii) Ionic bond:a chemical bond in which one atom loses an electron to form a positive ion and the other atom gains an electron to form a negative ion.
In reality, bonds have both ionic and covalent character.
Frequency Analysis
Frequency analysis, also known as vibrational analysis is an important tool in computational chemistry. Frequency analysis is used to calculate the minimum structure on the potential energy surface and can determine the frequencies of the vibration. If the frequencies have positive values then it corresponds to the minimum however, if one or more of the values are negative it corresponds to the transition state. Infared Spectrums were also obtained.
Borane Vibrational Analysis
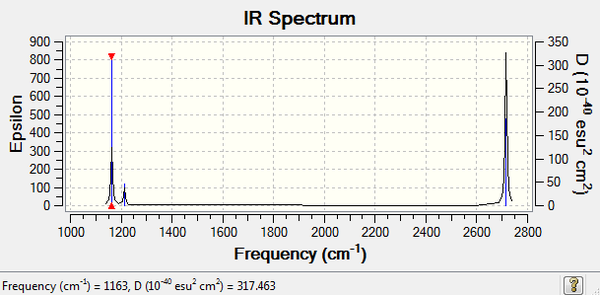
D-space published link The results obtained from the log file are illustrated below:
A "no-symmetry" keyword was used when calculating the frequencies, as a result the point group symmetry should be CS (no symmetry).
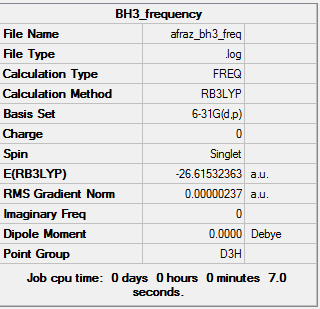

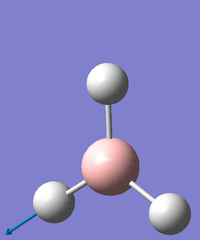
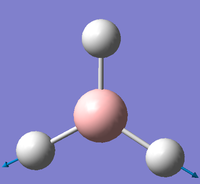
The vibrational frequencies of BH3 are detailed below. The frequency calculation was carried out by imposing a D3h symmetry and the vibrations were analysed. All the vibrations have a positive minimum energy, illustrating that the calculation was successfully completed.
               Item               Value     Threshold  Converged?
 Maximum Force            0.000005     0.000450     YES
 RMS     Force            0.000002     0.000300     YES
 Maximum Displacement     0.000019     0.001800     YES
 RMS     Displacement     0.000009     0.001200     YES
Low frequencies ---   -0.9033   -0.7343   -0.0054    6.7375   12.2491   12.2824

Low frequencies --- 1163.0003 1213.1853 1213.1880
These "Low frequencies" values relate to the "-6" part of the 3N-6 vibration in a molecule with N atoms.
Generally, for N number of atoms in a molecule there are usually 3N-6 vibrational modes. For a vibration to result in a peak, there must be a change in the dipole moment of the molecule (hence, must be IR active). Therefore, generally symmetric stretches will not appear on the spectrum.
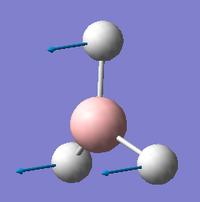
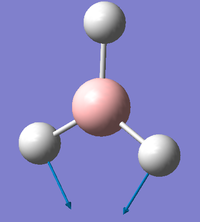
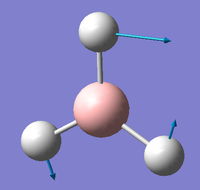
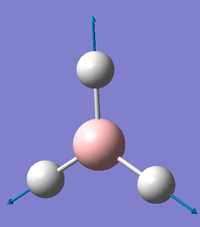
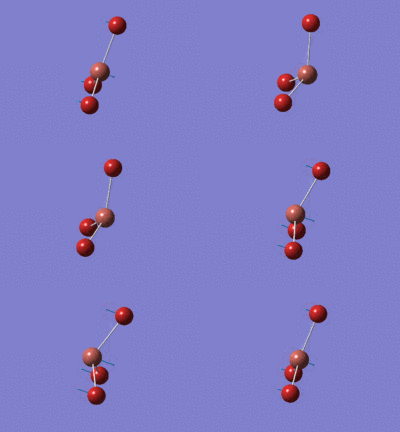
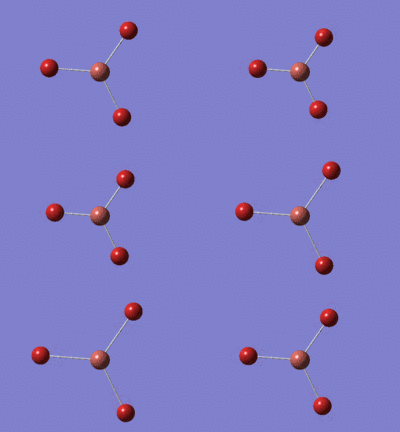
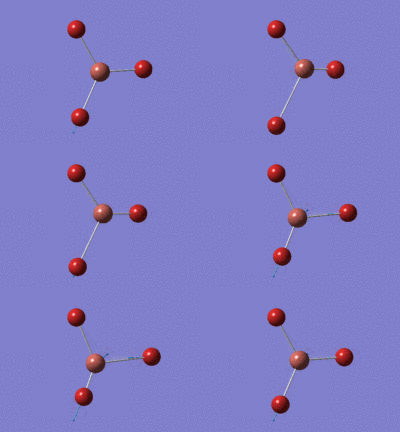
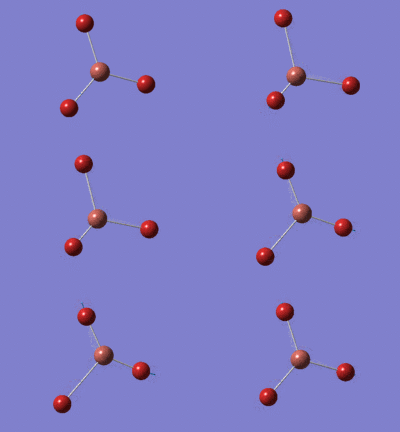
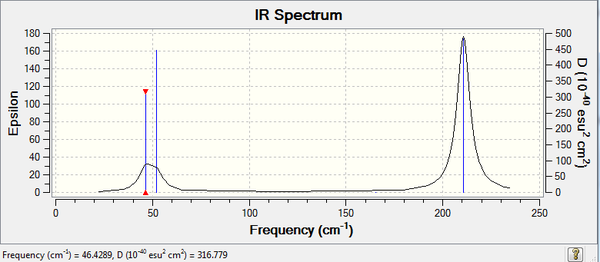
The IR spectrum below indicates there are 3 peaks, however the molecule has 6 vibrational modes. The vibrations at 1213 cm-1 and 2715 cm-1 are degenerate (have the same wave number) and therefore will not re-appear on the spectrum. However, this can be explained by considering each of the vibrations. Vibration 4 is a symmetric stretch and therefore has 0 infared intensity.
TlBr3 Vibrational Analysis
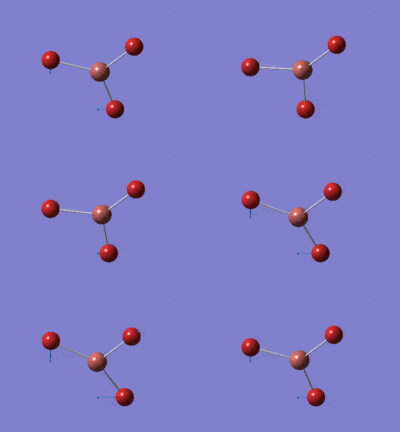
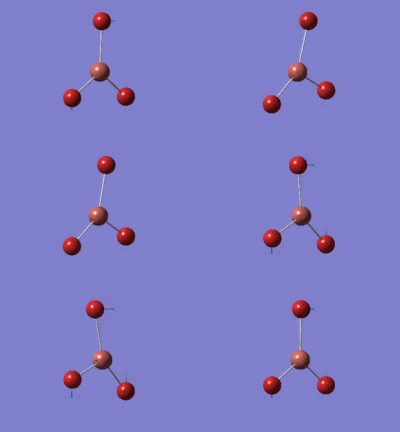
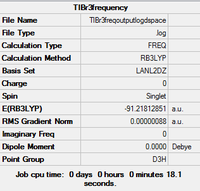
Frequency analysis of the TlBr3 was carried out. The method was the optimised structure (DFT, LanL2DZ, 6-31G (d,p)). https://spectradspace.lib.imperial.ac.uk:8443/dspace/handle/10042/23375
         Item               Value     Threshold  Converged?
 Maximum Force            0.000002     0.000450     YES
 RMS     Force            0.000001     0.000300     YES
 Maximum Displacement     0.000022     0.001800     YES
 RMS     Displacement     0.000011     0.001200     YES
Low frequencies ---   -3.4213   -0.0026   -0.0004    0.0015    3.9367    3.9367

Low frequencies ---   46.4289   46.4292   52.1449
Vibrational Frequencies (TlBr3 vs BH3)
| Vibrational Mode | BH3 Frequency (cm-1) | TlBr3 Frequency (cm-1) |
|---|---|---|
| 1 | 1163 | 46 |
| 2 | 1213 | 46 |
| 3 | 1213 | 52 |
| 4 | 2582 | 165 |
| 5 | 2715 | 210 |
| 6 | 2715 | 210 |
To enable comparasion of the different structures, the following equation can be used:
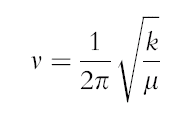
An indication of the bond strength is the frequency at which a bond vibrates. As shown by the table above, the frequency for the BH3 are greater than the TlBr3, therefore indicating that the B-H bond is stronger than the Tl-Br bond. Both molecules have 6 vibrational modes, which can be expected since both molecules are trigonal planar (isostructural) and both have 3 peaks on the IR spectra. However, the ordering of the vibrational modes is different in both molecules. For instance in Borane the sequence is A2’, E', E', A1', E', E', in the case of the TlBr3 the sequence is E',E', A2’, A1' E', E'. Another observation to make is that the vibrational modes A2’ and E are very similar, this is also the case for A1’ and E’ but at a greater energy. This can be explained by the fact that vibronic coupling may exist between the different modes of vibration. Vibronic coupling occurs where molecules possess the same atom and/or bond. The frequency analysis has confirmed the structure of the minimum and has given information on the IR spectrum.
Population analysis
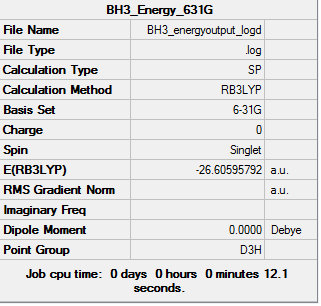
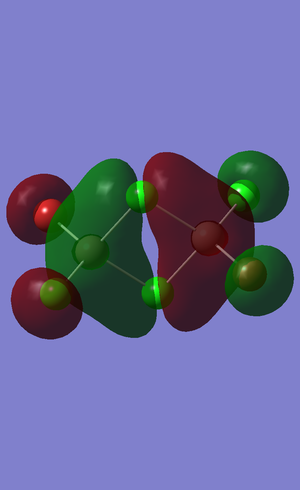
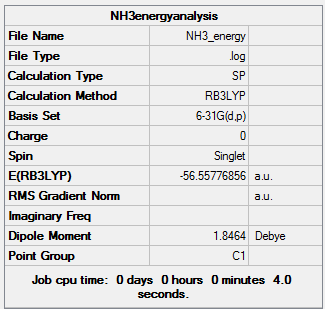
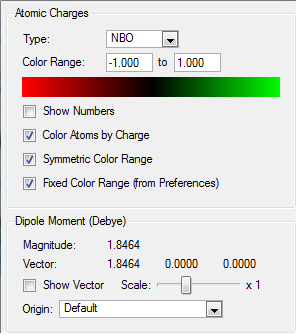
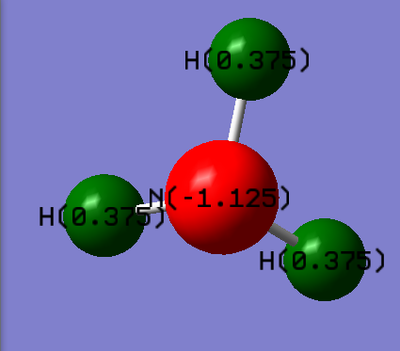
Computational chemistry enables us to calculate the electronic structure and study the molecular orbitals. The results obtained from the log file are illustrated below. The method used was "Energy", the settings were changed to "Full NBO" and the additional keyword "pop=full" was added to carry out these calculations. https://spectradspace.lib.imperial.ac.uk:8443/dspace/handle/10042/23377
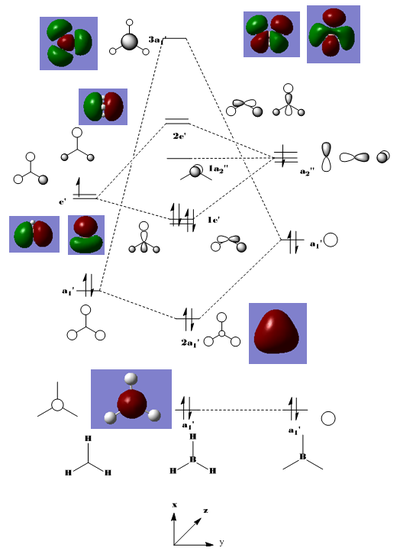
The MO diagram above indicates that the "real" molecular orbitals are not different from the molecular orbitals formed from the linear combination of atomic orbitals, as a result validating the qualitative MO theory. It proves it can be an accurate tool to model the molecular frame work of simple molecules. MO theory tends to break down when the molecules get more complex and therefore it eventually requires a quantum mechanical description.
Natural Bond Order (NBO) analysis
The natural bond order is described as being the bonding orbital with maximum electron density.
NH3
Optimisation analysis of ammonia
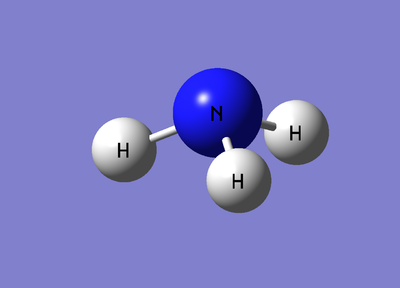
NBO analysis on NH3: basis set (DFT, B3LYP, 6-31G (d,p)) (straight to 6-31G because it is a small molecule). The additional keyword "nosymm" was also implemented.
D-space published link The basis set chosen was 6-31G (d,p) and the results obtained from the log file are illustrated below:
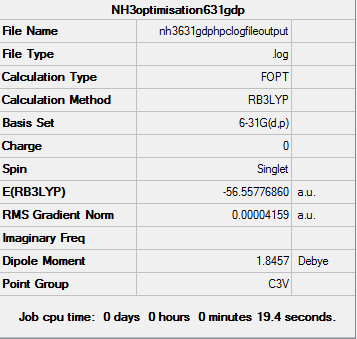
        Item               Value     Threshold  Converged?
 Maximum Force            0.000059     0.000450     YES
 RMS     Force            0.000040     0.000300     YES
 Maximum Displacement     0.000370     0.001800     YES
 RMS     Displacement     0.000163     0.001200     YES
| Optimised N-H bond length | check |
| Optimised H-N-H bond angle | check |
Frequency analysis of ammonia
The results obtained from the frequency log file are illustrated below:
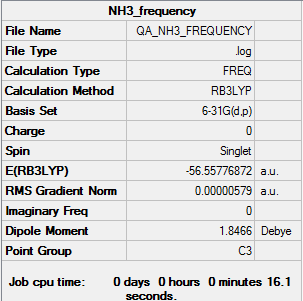
        Item               Value     Threshold  Converged?
 Maximum Force            0.000021     0.000450     YES
 RMS     Force            0.000009     0.000300     YES
 Maximum Displacement     0.000077     0.001800     YES
 RMS     Displacement     0.000039     0.001200     YES
Low frequencies ---  -30.8045   -0.0012   -0.0012   -0.0011   20.2188   28.2150

Low frequencies --- 1089.5530 1694.1235 1694.1861
Population on ammonia
The results obtained from the frequency log file are illustrated below:
NH3BH3
Optimisation of NH3BH3
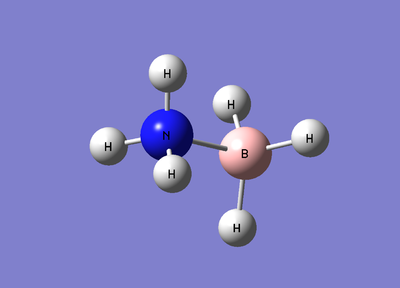
File:Nh3bh3afrazoptimisation.log
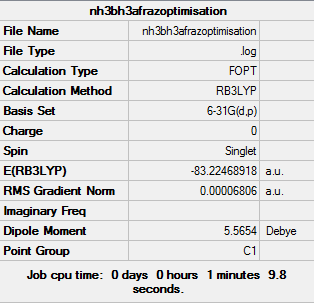
         Item               Value     Threshold  Converged?
 Maximum Force            0.000137     0.000450     YES
 RMS     Force            0.000063     0.000300     YES
 Maximum Displacement     0.000606     0.001800     YES
 RMS     Displacement     0.000336     0.001200     YES
Frequency analysis of NH3BH3

Item               Value     Threshold  Converged?
 Maximum Force            0.000125     0.000450     YES
 RMS     Force            0.000068     0.000300     YES
 Maximum Displacement     0.000961     0.001800     YES
 RMS     Displacement     0.000582     0.001200     YES
Low frequencies ---   -0.0010   -0.0006    0.0004   17.2159   22.6043   39.1278

Low frequencies ---  265.9153  632.3795  639.0771
Dissociation energy of the B-N bond
The energies are as follows (based on the 6-31G basis set):
E(NH3)= -56.55776860 a.u.
E(BH3)= -26.61532363 a.u.
E(NH3BH3)= -83.22468918 a.u.
ΔE = E(NH3BH3) - (E(NH3) + E(BH3))
ΔE = (-83.22468918)-[(-56.55776860)+(-26.61532363)]
ΔE = (-83.22468918)-(-83.1730922)
ΔE = -0.05159698 a.u.
Edissoc = -135.5 kJ/mol-1 (to 4 s.f)
The literature value is greater at -172.1 kJ mol-1[7].
Lewis Acids and Bases
The general definition of a lewis acid and base is as follows:
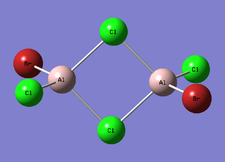
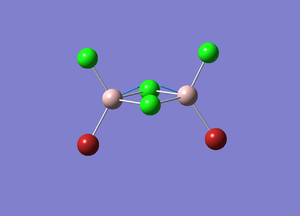
A Lewis acid is defined as an electron pair acceptor, whereas a Lewis base is defined as an electron pair donor. The focus in this project will be on isomers of the molecule Al2Br2Cl4, which is a dimer of the monomer AlBrCl2, a molecule that has Lewis acid character. The structure of the isomers will be investigated, as well as the vibrations and the molecular orbital analysis.
As stated earlier for more complex molecules, it is necessary to use a full basis set and pseudo-potential settings. Therefore, in carrying out the optimisation and frequency calculations the following settings were applied: the basis set was GEN and the text file was edited with the following text:
Title Card Required

0 1
 B                  0.00000000    0.00000000    0.00000000
 Br                 0.00000000    2.02000000    0.00000000
 Br                 1.74937123   -1.01000016    0.00000000
 Br                -1.74937123   -1.01000016    0.00000000

 1 2 1.0 3 1.0 4 1.0
 2
 3
 4

Al 0
6-31G(d,p)
****
Cl 0
6-31G(d,p)
****
Br 0
LanL2DZ
****

Br 0
LanL2DZ
All the isomers were converged successfully and the minimum energy was obtained.
Optimisation and Frequency analysis of the isomers
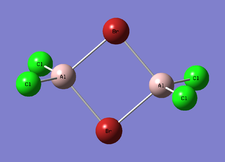
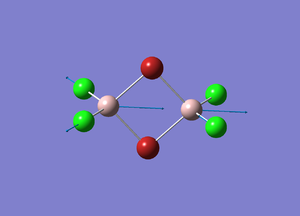
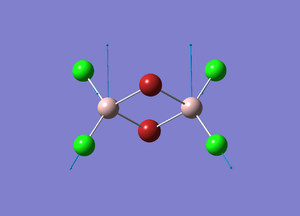
Cl2Al(μ-Br2)AlCl2
The completed optimisation analysis can be found on this link
        Item               Value     Threshold  Converged?
 Maximum Force            0.000007     0.000450     YES
 RMS     Force            0.000003     0.000300     YES
 Maximum Displacement     0.000154     0.001800     YES
 RMS     Displacement     0.000058     0.001200     YES
 Predicted change in Energy=-1.207260D-09
 Optimization completed.
The data above shows that the optimisation converged successfully.
| Optimised Al-Br bond length | 2.48928 Å |
| Optimised Al-Cl bond length | 2.09345 Å |
The completed frequency analysis can be found on this link
Low frequencies ---   -5.1810   -5.0302   -3.2289    0.0035    0.0041    0.0046

Low frequencies ---   14.8284   63.2817   86.0839
        Item               Value     Threshold  Converged?
 Maximum Force            0.000013     0.000450     YES
 RMS     Force            0.000004     0.000300     YES
 Maximum Displacement     0.000209     0.001800     YES
 RMS     Displacement     0.000099     0.001200     YES
 Predicted change in Energy=-2.119810D-09
 Optimization completed.
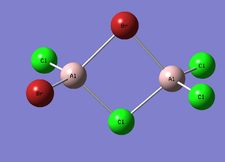
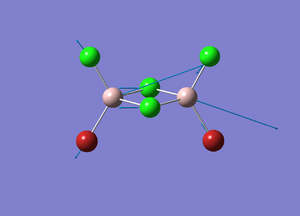
BrClAl(μ-Br,Cl)AlCl2
The completed optimisation analysis can be found on this link
        Item               Value     Threshold  Converged?
 Maximum Force            0.000035     0.000450     YES
 RMS     Force            0.000014     0.000300     YES
 Maximum Displacement     0.000511     0.001800     YES
 RMS     Displacement     0.000182     0.001200     YES
 Predicted change in Energy=-2.018233D-08
 Optimization completed.
The data above shows that the optimisation converged successfully.
| Optimised Al-Br bond length | 2.48634 Å |
| Optimised Al-Br bond length | 2.27569 Å |
| Optimised Al-Cl bond length | 2.30332 Å |
| Optimised Al-Cl bond length | 2.09433 Å |
The completed frequency analysis can be found on this link
Low frequencies ---   -2.2899    0.0028    0.0034    0.0037    1.2461    3.3246

Low frequencies ---   17.1615   55.9533   80.0563
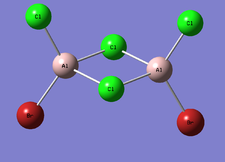
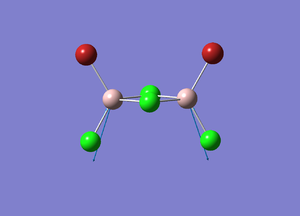
Cis-BrClAl(μ-Cl2)AlClBr
The completed optimisation analysis can be found on this link
        Item               Value     Threshold  Converged?
 Maximum Force            0.000040     0.000450     YES
 RMS     Force            0.000016     0.000300     YES
 Maximum Displacement     0.001359     0.001800     YES
 RMS     Displacement     0.000424     0.001200     YES
 Predicted change in Energy=-2.577034D-08
 Optimization completed.
The data above shows that the optimisation converged successfully.
| Optimised Al-Br bond length | 2.27465 Å |
| Optimised Al-Cl bond length | 2.29817 Å |
| Optimised Al-Cl bond length | 2.09389 Å |
The completed frequency analysis can be found on this link
 Low frequencies ---   -3.8190   -2.2355   -0.0028   -0.0006    0.0023    1.3869

 Low frequencies ---   17.2012   50.9457   78.5393
Trans-BrClAl(μ-Cl2)AlClBr
The completed optimisation analysis can be found on this link
       Item               Value     Threshold  Converged?
 Maximum Force            0.000039     0.000450     YES
 RMS     Force            0.000015     0.000300     YES
 Maximum Displacement     0.000467     0.001800     YES
 RMS     Displacement     0.000168     0.001200     YES
 Predicted change in Energy=-2.435209D-08
 Optimization completed.
The data above shows that the optimisation converged successfully.
| Optimised Al-Br bond length | 2.27465 Å |
| Optimised Al-Cl bond length | 2.29814 Å |
| Optimised Al-Cl bond length | 2.09380 Å |
The completed frequency analysis can be found on this link
 Low frequencies ---   -3.8190   -2.2355   -0.0028   -0.0006    0.0023    1.3869

 Low frequencies ---   17.2012   50.9457   78.5393
Relative Energies
| Isomer | Energy (a.u.) | Energy (kJ mol-1) | Relative EnergykJ mol-1 |
|---|---|---|---|
| Cl2Al(μ-Br2)AlCl2 | -2352.40630798 | -6176242.762 | 26.23 |
| BrClAl(μ-Br,Cl)AlCl2 | -2352.41109944 | -6176255.342 | 13.65 |
| Cis-BrClAl(μ-Cl2)AlClBr | -2352.41626677 | -6176268.908 | 0.084 |
| Trans-BrClAl(μ-Cl2)AlClBr | -2352.41629858 | -6176268.992 | 0.00 |
The energies of the minima were calculated using the optimisation analysis. Furthermore, the stability of the isomers were compared, and it was confirmed that the isomer Trans-BrClAl(μ-Cl2)AlClBr had the lowest energy (most negative value).
The factors that determine the energy are: the atoms that constitute the μ-bridge, the electronegativity of these atoms, the position of the atoms (for instance the 3 isomers with Cl atoms in a bridging position have a closer energy). The Br atom is more diffuse than the Cl atoms, so have less extent of orbital overlap and thus weaker bonding.
Dissociation energy
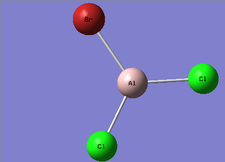
The monomer below has the chemical formulae AlBrCl2. The trans isomer is made up of two of the monomer fragments and it is the most stable isomer as it has the lowest energy. When the two monomer molecules combine, the chlorine atom can be regarded as the lewis base and the aluminium atom the lewis acid. The lewis acid and base interactions stabilise the reaction and are the driving force of the reaction.
The dissociation energy of Trans-BrClAl(μ-Cl2)AlClBr can be determined by using the trans-isomer energy and subtracting the equivalent of two monomer energies:
Edis = 2(-1176.19013697) + (-2352.41629858)
Edis = 0.0360246 a.u
Edis = 94.582 KJmol-1
The value indicates that the isomer is more stable than the monomer.
Monomer Analysis
The completed optimisation analysis can be found on this link
Item               Value     Threshold  Converged?
 Maximum Force            0.000002     0.000450     YES
 RMS     Force            0.000001     0.000300     YES
 Maximum Displacement     0.000005     0.001800     YES
 RMS     Displacement     0.000003     0.001200     YES
 Predicted change in Energy=-1.655276D-11
 Optimization completed.
The completed frequency analysis can be found on this link
Low frequencies ---   -2.3927   -0.0014   -0.0008    0.0027    2.8703    2.9344

Low frequencies ---  120.5202  133.8368  185.7824
IR analysis
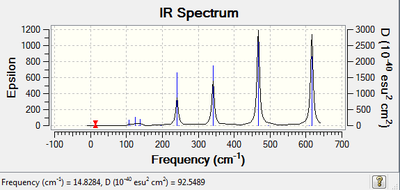
| IR Spectroscopy: Cl2Al(μ-Cl2)AlBr2.
| |
|---|---|
| Spectrum | Active Peaks (cm-1) |
|
324, 417, 503, 613 |
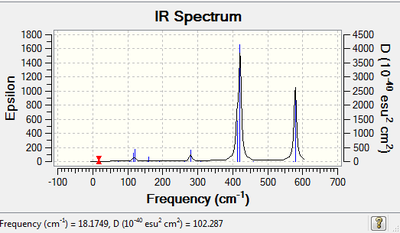
| IR Spectroscopy: BrClAl(μ-Br,Cl)AlCl2.
| |
|---|---|
| Spectrum | Active Peaks (cm-1) |
|
248, 358, 469, 607 |
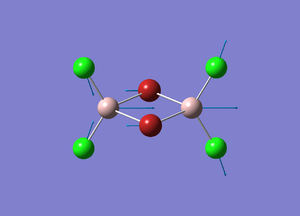
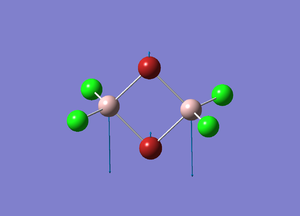
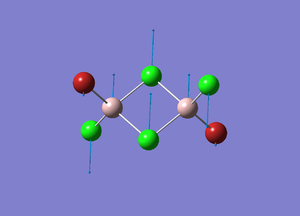
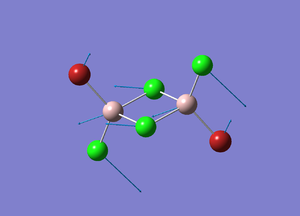
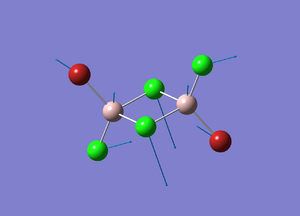
| Number | Vibrational Mode | Frequency/cm-1 | Description |
|---|---|---|---|
| 1 | 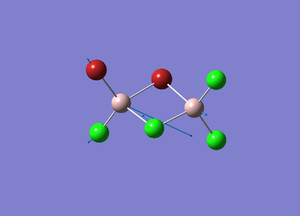 |
423 | The Br-Al-Cl bonds stretch symmetrically. |
| 2 | 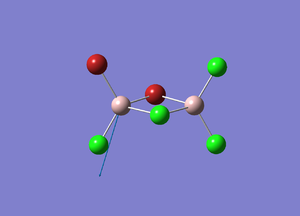 |
574 | The Al atom moves up and down out of the plane, whilst all other atoms do not move. |
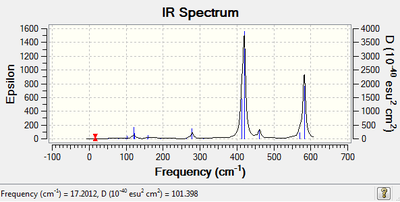
| IR Spectroscopy: Cis-BrClAl(μ-Cl2)AlClBr.
| |
|---|---|
| Spectrum | Active Peaks (cm-1) |
|
420, 463, 581 |
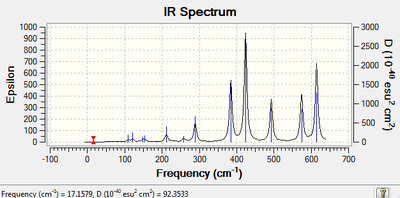
| IR Spectroscopy: Trans-BrClAl(μ-Cl2)AlClBr.
| |
|---|---|
| Spectrum | Active Peaks (cm-1) |
|
421, 578 |
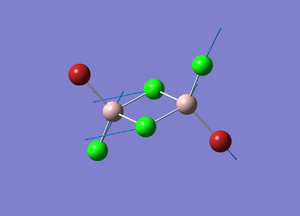
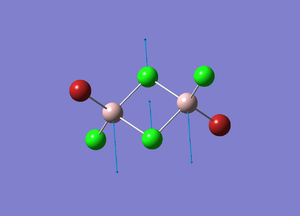
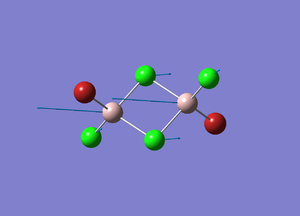
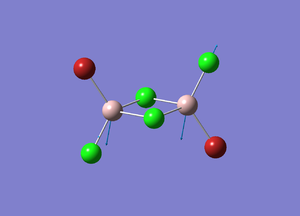
A vibrational mode in a molecule can be considered to be IR active if it is associated with a change in the dipole moment. The isomers described above all have the same atoms, however the position of each atom in the molecule is different, as a result there will be different dipole moments in each isomer and these will give rise to different peaks on the IR spectrum.
Furthermore, there is also a relationship between symmetry and the IR spectrum. An increase in symmetry leads to a reduced number of vibrational modes. For example the spectra above indicate that the cis and trans isomers are more symmetric therefore have less number of peaks. Furthermore, the difference in the cis and trans structure is also evident on the IR spectrum, there is a change in the position of the Cl and Br atom. The difference is in the strecthing vibrational mode (463cm-1), which is present in the cis isomer (non-symmetric) but not in the trans isomer (symmetric) and does not have a change in the dipole moment.
The equation below indicates that the frequency is proportional to the force constant.

There are two types of Al-Br bond, firstly where the Br atom is in the terminal position and the other where the Br bond is in the bridging position. By considering the equations above, the reduced mass is the same therefore, this indicates there is a change in the strength of the Al-Br bond (force constant). Equation also indicates that the stronger the bond the vibration will be faster, by considering the data it indicates the Al-Br bond in the terminal position is stronger than the bridging position.
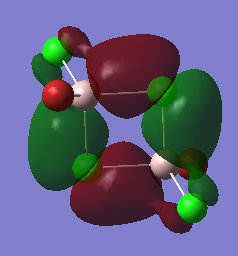
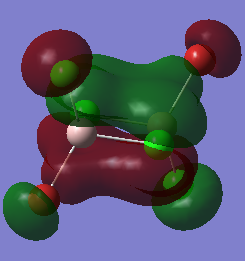
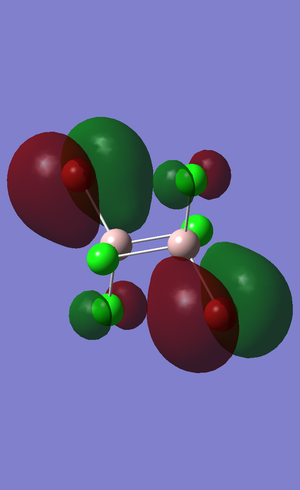
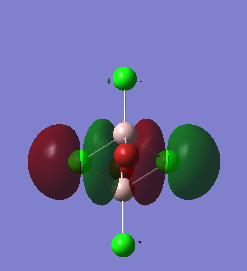
Molecular Orbital
The completed energy analysis can be found on this link
References
1.↑ M. Schuurman, W. Allen, H. Schaefer, Journal of Computational Chemistry, 2005, 26, 1106
2.↑ J. Blixt et al., J. Am. Chem. Soc. , 117, 1995, pp 5089 - 5104
3.↑ M. Anatosov et al., J. Phys. Chem. , 105, 2001, pp 5450 - 5467
4.↑ James L. Reed., Electronegativity and atomic charge. , Journal of Chemical Education 1992 69 (10), 785
5.
- ↑ M. Schuurman, W. Allen, H. Schaefer, Journal of Computational Chemistry, 2005, 26, 1106
- ↑ J. Blixt et al., J. Am. Chem. Soc. , 117, 1995, pp 5089 - 5104
- ↑ M. Anatosov et al., J. Phys. Chem. , 105, 2001, pp 5450 - 5467
- ↑ 4
- ↑ 4
- ↑ 4
- ↑ Cite error: Invalid
<ref>tag; no text was provided for refs namedShaulov

