MRD:lhl17
Molecular Reaction Dynamics: Applications to Triatomic Systems
Louise Li
Group C, deadline: 22/05/2020
Introduction
The program used for this computational lab calculates potential energy and individual trajectories using the London-Eyring-Polanyi-Sato (LEPS) potential. By analysis of these reaction paths and comparing with the prediction of Transition State Theory, we can learn more about reactions and their molecular dynamics.
Exercise 1: H + H2 system
Question 1
On a potential energy surface diagram, how is the transition state mathematically defined? How can the transition state be identified, and how can it be distinguished from a local minimum of the potential energy surface?
On a potential energy surface (PES) diagram, the transition state is mathematically defined as the point at which the following is true:
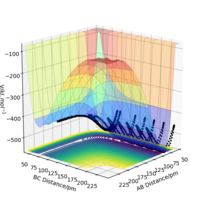
While a one-dimensional potential energy curve (PEC) could simply be approximated by quadratic curves, the PES is multi-dimensional function (with the energy on the z axis and bond distances on the x/y axes). This means the TS, the maximum point on the minimum reactive trajectory, can be visually identified as the "saddle point" - a maximum point in one direction and minimum in the other.
To distinguish the TS from other local minima, both the second derivative and the determinant of the Hessian Matrix at the TS should be smaller than 0. In addition, the eigenvalues of the Hessian Matrix should have opposite positive/negative signs.[1]
Good description but remember the derivatives are partial. What is the Hessian Matrix? More information needed Sf3014 (talk) 19:07, 31 May 2020 (BST)
Question 2
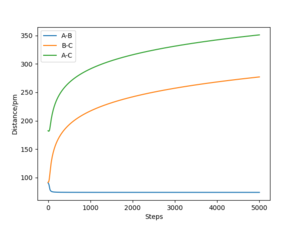
Report your best estimate of the transition state position ('''rts''') and explain your reasoning illustrating it with a “Internuclear Distances vs Time” plot for a relevant trajectory.
The TS position for the H + H2 system was found at rAB = rBC = 90.77 pm with pAB = pBC = 0 g.mol-1.pm.fm-1.
Good it’s best not to leave all your description in your figure caption it confuses the structure of your report and loses your point. Also, where did you get this information on Hammonds postulate? Reference Sf3014 (talk) 19:07, 31 May 2020 (BST)
Question 3
Comment on how the mep and the trajectory you just calculated differ.
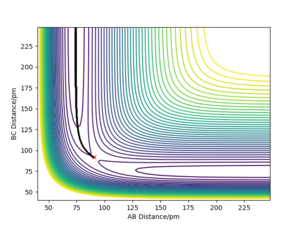
The minimum energy path (mep) is a special trajectory that corresponds to infinitely slow motion (i.e. the momenta/velocities are always reset to zero in each time step)[2]. The MEP is useful for finding an equilibrium geometry which can then be used to calculate energies, although the dynamics plot is more realistic and is a good model for gas phase collision.
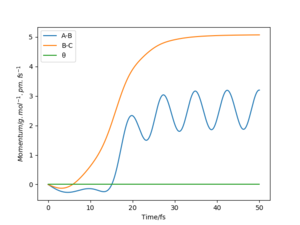
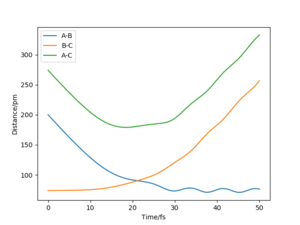
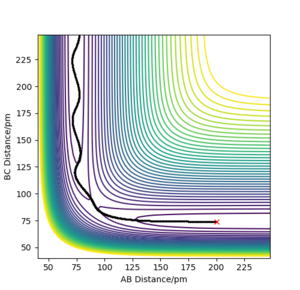
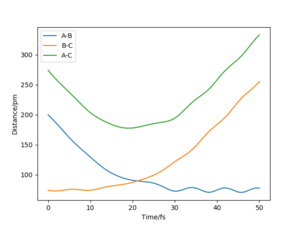
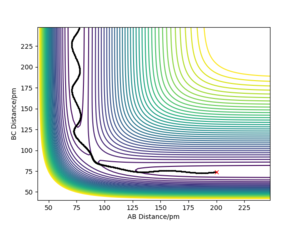
When comparing reaction pathways with initial conditions rAB = 90.77 pm, rBC = 91.77 pm and pAB = pBC = 0 g.mol-1.pm.fm-1, we obtain the following:
Reversing the initial/final positions and momenta reverses the direction of the reaction pathway observed. By slightly displacing the initial conditions from the TS in either direction, we can encourage product or reactant formation and observe how the trajectory evolves just away from the saddle. Like a ball placed onto a sloped surface, the system will gain momentum as soon as the simulation starts as it is not at a stable point on the PES and will thus fall to an energy minimum (Ep to Ek).
Very good. Be careful with this kind of set up, in your comments for the contour plots you described more then what the evidence shows, so you got ahead of yourself which showed in your lack of comments on the momenta and distance vs time graphs Sf3014 (talk) 19:07, 31 May 2020 (BST)
Question 4
Complete the table below by adding the total energy, whether the trajectory is reactive or unreactive, and provide a plot of the trajectory and a small description for what happens along the trajectory. What can you conclude from the table?
The higher kinetic energy, hence momenta does not necessarily guarantee the reaction would proceed. Higher kinetic energy can mean that the reactants can go over the activation energy barrier, but with energy being too high, newly formed products may overcome the TS barrier again in the reversed direction and reform reactants, in which case it is unreactive overall. This paragraph seems to be copied from another report. This is disappointing and casts a shadow of doubt about the originality of the rest of the report. A shame really. João (talk) 16:10, 4 June 2020 (BST)
Very good conclusion and table layout Sf3014 (talk) 19:07, 31 May 2020 (BST)
Question 5
Given the results you have obtained, how will Transition State Theory predictions for reaction rate values compare with experimental values?
The Transition State Theory assumes that only the reactants are in constant equilibrium with the transition state structure (quasi-equilibrium), and that the energy of the particles follow a Boltzmann distribution in a thermally equibrilated reactant pool.
In addition, it is assumed that once the reactants have trajectories with a kinetic energy along the reaction coordinate greater than the activation energy, that the products will definitely form, ignoring the possibility of barrier recrossing caused by excess vibrational energy. As seen in row 4, the starting materials may be reformed instead leading to an overall unreactive path.
Furthermore, the theory fails for some reactions at low temperatures due to quantum tunneling, where the product can still be formed even if the TS is not reached (although the effect of this is negligible compared to barrier recrossing). The nuclei are also treated as classical point masses and do not have wavefunctions, which is another flaw of TST.
In the table above, only 5 possible individual trajectories of the H + H2 reaction were investigated. The true reaction rate can be thought of as a "weighted average" of all such individual paths and so, with TST predicting unreactive trajectories to in fact be reactive, it can be concluded that the theory overestimates the rate of reaction when compared with experimental values.
Good but if you labelled your table properly (with a table number and numbers for the trajectories) you can refer to it more clearly. Why are the effects of quantum tunnelling negligible? Explain in terms of the scale of the reaction. Sf3014 (talk) 19:07, 31 May 2020 (BST)
Exercise 2: F - H - H system
Question 6
By inspecting the potential energy surfaces, classify the F + H2 and H + HF reactions according to their energetics (endothermic or exothermic). How does this relate to the bond strength of the chemical species involved?
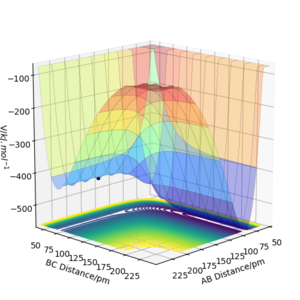
The enthalpy change of a reaction can be calculated using the following equation:
ΔHrxn=ΣΔHbond breaking-ΣΔHbond forming
Using literature values for bond dissociation energies of H-H (436 kJ mol-1) and H-F (569 kJ mol-1)[3] shows that the enthalpy released from breaking the H-F bond is greater than the energy required to break H-H bonds. Therefore, the reaction F + H2 → HF + H is energetically favorable and exothermic overall. This is consistent with the very small atomic radius of the F atom, and therefore stronger attraction and a stronger bond overall. The PES shows that the reactants are higher in energy than the products (where AB distance, representing the H-F bond), indicating an exothermic reaction.
The reverse reaction, H + HF is therefore endothermic, as extra external energy is required in order to break the H-F bond.
Very good description and comparison to bond energies. More clarity gained from labeling your figure. Sf3014 (talk) 19:07, 31 May 2020 (BST)
Question 7
Locate the approximate position of the transition state.
According to Hammond's postulate the structure of the transition state will resemble the structure of the nearest stable species (either products or reactants). Taking the first reaction F + H2 → HF + H, the transition state will resemble the reactants since it is an exothermic reaction. For HF + H → F + H2, the opposite is true: the transition state will resemble the products for the endothermic reaction.
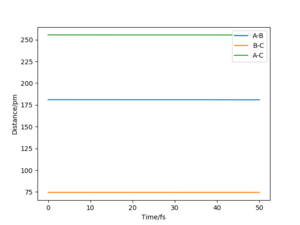
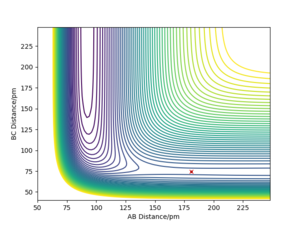
After testing several initial distances by trial and error, and setting the initial momentum of both reactants to be 0, it was found that the transition state has the following internuclear distances: rFH = 180.5 pm and rHH = 74.5 pm (Etotal = -433.981 kJ mol-1).
Note that for these triatomics there are two bond lengths we can vary and thus at a saddle point there is one direction that decreases most in energy, and another that increases the most. For the transition structure of a polyatomic molecule with 3N-6 vibrational modes, there would exist one direction down and the remaining 3N-7 vibrational modes acting as sinks for the excess energy.[4]
Well done. Good description on locating the transition state (TS) but always define the abbreviation of TS before using it Sf3014 (talk) 19:07, 31 May 2020 (BST)
Question 8
Report the activation energy for both reactions.
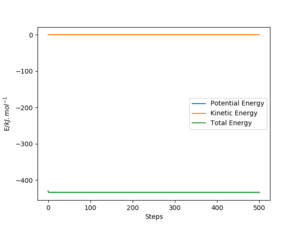
The Ea was found by very slightly altering the TS distance for each of AB, then BC, and taking the energy difference between the TS and the system with maximum displacement between the reactants.
| F + H2 | HF + H |
|---|---|
 |
 |
Knowing that the F + H2 reaction was exothermic and had an early TS provided useful guidance when locating the exact point, since the activation energy was so small.
Very good but your graphs would be clearer if you zoomed in on the total energy Sf3014 (talk) 19:07, 31 May 2020 (BST)
Question 9
Identify a set of initial conditions that results in a reactive trajectory for the F + H2, and look at the “Animation” and “Momenta vs Time”.In light of the fact that energy is conserved, discuss the mechanism of release of the reaction energy. Explain how this could be confirmed experimentally..
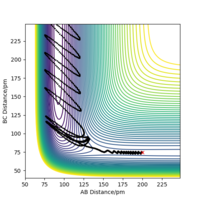
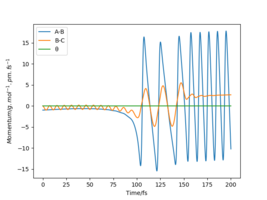
To investigate a reactive trajectory for the reaction F + H2 → HF + H, the following initial conditions were chosen:
| rFH / pm | rHH / pm | pFH/gmol-1pmfs-1 | pHH/gmol-1pmfs-1 |
|---|---|---|---|
| 200 | 74 | -1.0 | 0 |
This yielded the follow plots:
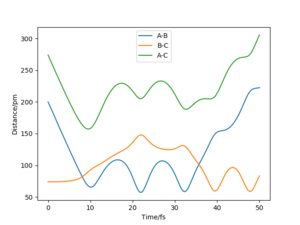
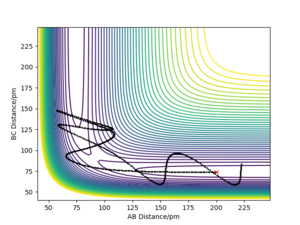
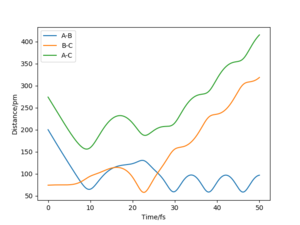
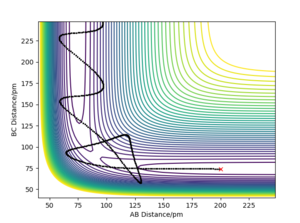
The conservation of energy suggests that total energy is constant through the course of reaction. From the exothermic energy vs time graph below, the loss in potential energy from the breaking of H2 bonds is mirrored by the increase in Ek, which can be either translational, rotational or vibrational.
Calorimetry can be used to measure the transfer of both Etrans and Evib (Erot is ignored here) from the products to the walls of the calorimeter in the form of heat and the heat transferred can then be measured via a temperature change. We would expect an increase in temperature for exothermic reactions and a decrease for endothermic ones, and the total energy change can be calculated using ΔQ=cΔΤ.
Meanwhile, FTIR spectroscopy can also be used to quantify Evib. Before the collision, the atoms lie in the ground state - however, during the collision, they are excited to occupy higher vibrational modes as Ep is converted to Ek. Overtone and peak wavenumbers in the IR spectrum can be used to identify the changes in Evib of the IR active product and over time, the vibrational states eventually relax back to the ground state.
Good but the reference to your graphs are unclear. Good description on a general calorimetry experiment but you need to be more specific in your description. Also, how will the vibrational frequency be measure as the reaction proceeds, using IR spectroscopy? Sf3014 (talk) 19:07, 31 May 2020 (BST)
Question 10
Discuss how the distribution of energy between different modes (translation and vibration) affect the efficiency of the reaction, and how this is influenced by the position of the transition state.
Polanyi's Empirical rules state that vibrational energy is more efficient at activating a late transition state (present in endothermic reactions, according to Hammond's postulate), than translational energy.
On the other hand, translational energy is more efficient in activating an early transition state in an exothermic reaction than vibrational energy as the trajectory can simply "fall" into the lower energy region. Therefore for a successful exothermic reaction, the molecules need an excess of translational (kinetic) energy compared to vibrational (oscillatory) energy.
To investigate this, a calculation starting on the side of the reactants of F + H2, at the bottom of the well with rHF = 200 pm, rHH = 74 pm, with a momentum pFH = -1.0 g.mol-1.pm.fs-1 was set up. Several values of pHH in the range -6.1 to 6.1 g.mol-1.pm.fs-1 were explored:
| pHH/gmol-1pmfs-1 | Etot/ kJ.mol-1 | Reactive trajectory | Contour plot |
|---|---|---|---|
| -6.1 | -402.5 | No |  |
| -5 | -413.6 | Yes |  |
| -3 | -427.6 | No | 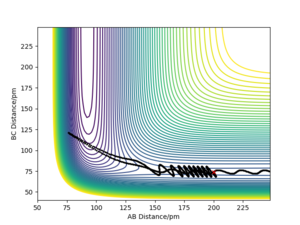 |
| 0 | -433.6 | Yes | 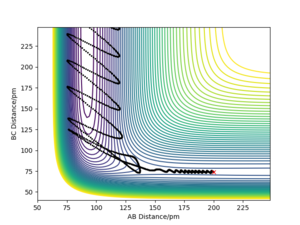 |
| 3 | -421.6 | Yes |  |
| 5 | -403.6 | No |  |
| 6.1 | -390.3 | No | 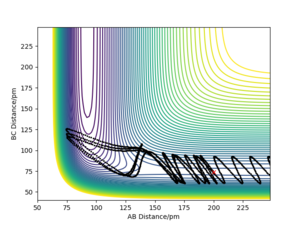 |
For the same initial position, the momentum pFH (represents the translational energy) was increased slightly to -1.6 g.mol-1.pm.fs-1,and pHH (representing vibrational energy) was decreased to 0.2 g.mol-1.pm.fs-1. Although the overall energy of this simulation (-432.4 kJ mol-1) was similar to a successful trajectory, such as row 4 in the table above, the reaction did not go to completion. This confirms that the form of energy in the system is important to determine whether the reaction goes to completion.
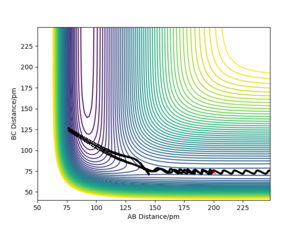
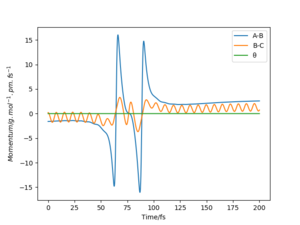
Barrier recrossing means products are able to cross back and become reactants again, as shown by the contour plots, and results in unsuccessful reactions:
| Contour | Momentum | Energy |
|---|---|---|
 |
 |
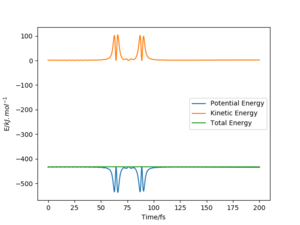 |
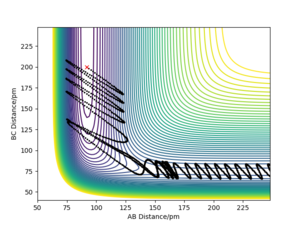
The above trajectory was found by increasing the vibrational energy of the HF bond while maintaining a low pHH.
Very good but what about the endothermic reaction? Your description below the table is confusing how does the new conditions relate to “row 4”, when both momenta are different? Your comparison is unclear and number your trajectories so referring to them are clear. Also, where did you get the information on Polanyi’s rules? Reference. Sf3014 (talk) 19:07, 31 May 2020 (BST)
References
- ↑ T. Fueno, Transition State: A Theoretical Approach, CRC Press, Japan, 1999, p.31.
- ↑ https://wiki.ch.ic.ac.uk/wiki/index.php?title=CP3MD (accessed May 2020).
- ↑ https://labs.chem.ucsb.edu/zakarian/armen/11---bonddissociationenergy.pdf (accessed May 2020)
- ↑ R. D. Levine, Molecular Reaction Dynamics, Cambridge University Press, Cambridge, 2005, p. 216.


