
MRD:01496292
- On a potential energy surface diagram, how is the transition state mathematically defined? How can the transition state be identified, and how can it be distinguished from a local minimum of the potential energy surface?
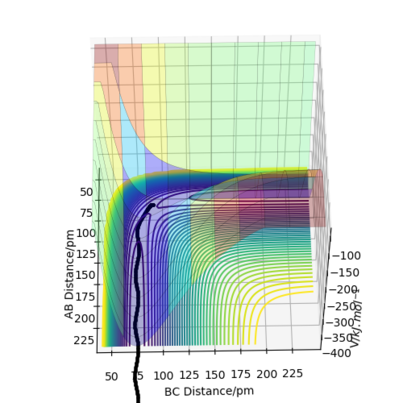
The transition state is defined by the point at which F=∂V(ri)/∂ri=0. Therefore, in a potential energy surface plot, we are looking for the point where ∂V(r1)/∂r1=0 and ∂V(r2)/∂r2=0. (transition state pic) Because the energy goes down along the minimum energy path for a reaction, then if the reactants starts a trajectory at the transition state with no initial momentum, it will never leave that point in space because no force is acting on the system. However, ∂V(ri)/∂ri=0 can also indicate the existence of a local minimum point. To identify whether the stable point is at the transition state or at a local minimum, we can follow the calculations below:
Ok, in the future, please split up the Wiki into sections so that it is easy to see your answers for each question. You can use mathematical notation to describe equations too i.e. : (Please click on edit source to see how this was done). Rs6817 (talk) 14:50, 19 May 2020 (BST)


![]()
 saddle point
1. If (fr1r1 - f2r2r2) > 0 and fr1r1 < 0 then the point is a local maximum
2. If (fr1r1 - f2r2r2) > 0 and fr1r1 > 0 then the point is a local minimum.
3. If (fr1r1 - f2r2r2) < 0, then the function is at the transition state (saddle point).
Please be careful with this notation, am not entirely sure what this is in reference too. If you are after second derivative see above equation in my first comment or f is typically used Rs6817 (talk) 14:50, 19 May 2020 (BST)
Trajectories from r1 = r2: locating the transition state
Report your best estimate of the transition state position (rts) and explain your reasoning illustrating it with a “Internuclear Distances vs Time” plot for a relevant trajectory.
The best estimate of the transition state position is: rAB = rBC = rts = 90.775 pm.
Good estimate well done. Rs6817 (talk) 14:50, 19 May 2020 (BST)
For this reaction, we have a totally symmetric transition state i.e. rAB = rBC = rts . This means that our reaction has a symmetric transition state and it is neither endothermic or exothermic: According to Hammond's postulate, the ts is neither early or late.
Well done, describing Hammonds postulate early - is there a reference for this? (Please click on edit source to see how this was done). Rs6817 (talk) 14:50, 19 May 2020 (BST)
Therefore, in the condition specified, the trajectory will only oscillate on the ridge and never fall off.
Hence, to find the position at the transition state we need to get rid of the oscillation and concentrate on the minimum potential energy point in this oscillation i.e. the minimum point along the diagonal line corresponds to the ts. To achieve this we could look at the ''internuclear Distance vs Time'' plot - if there is no oscillation at all, this plot would have the distance between AB and BC unchanged (two flat lines). Therefore, by altering the AB BC distances and looking for the best flat line, an estimate of rts can be found. Furthermore, we can also identify the existence of saddle point by looking at the hessian matrix: if one of the eigenvalues is positive with the other being negative, then it is a saddle point; all positive - minimum point; all positive - maximum point.
Yes this is correct, what does this plot tell us about the forces along the bonds? Also, double refernece to 'all positive'. Rs6817 (talk) 14:50, 19 May 2020 (BST)
- Calculating the reaction path
Comment on how the mep and the trajectory you just calculated differ.


For the energy contour plot, it can be observed that unlike the dynamics plot there is no vibrational energy for the MEP plot. This is an indication of how different MEP is algorithmically set - for MEP velocity is reset to 0 at each time step, so that kinetic energy always remains at 0. Thus, there is no vibrational energy in the system so no oscillation.


For MEP, since KE=0 and PE decreases going downhill as the reaction proceeds away from the transition state, so total energy decreases. For dynamics, total energy remains constant - the loss in potential energy overtime has completely transferred into kinetic energy.
If we look at the Internuclear Distance v Time plot for MEP and dynamics, we can see that in both cases atoms are moving away from each other and in the dynamics velocities at which they are moving remain constant.
This explanation is fine, although you could improve the way you have described each graph, are they all neccesary? What are oscillations proportional to? Rs6817 (talk) 14:50, 19 May 2020 (BST)
Take note of the final values of the positions r1(t) r2(t) and p1(t) p2(t) for your trajectory for large enough t.
The values of r1(t) r2(t) tends to infinity for large enough t whilst p1(t) p2(t) tends to remain the same average values (same amplitude but with momentum oscillates at higher frequencies for A-B.
Setup a calculation where the initial positions correspond to the final positions of the trajectory you calculated above, the same final momenta values but with their signs reversed.
What do you observe?
We could get the other plot by taking reflection along x axis and y axis from either one of the plots.


Reactive and unreactive trajectories
For the initial positions r1 = 74 pm and r2 = 200 pm, run trajectories with the following momenta combination and complete the table.
| p1/ g.mol-1.pm.fs-1 | p2/ g.mol-1.pm.fs-1 | Etot | Reactive? | Description of the dynamics | Illustration of the trajectory |
|---|---|---|---|---|---|
| -2.56 | -5.1 | -414.280 | Yes | Reactants goes to ts then goes to products | 
|
| -3.1 | -4.1 | -420.077 | No | Reactants goes to ts then goes back to reactants | 
|
| -3.1 | -5.1 | -413.977 | Yes | Reactants goes to ts then goes to products | 
|
| -5.1 | -10.1 | -357.277 | No | Reactants goes to ts then to products then to ts then to reactants | 
|
| -5.1 | -10.6 | -349.477 | Yes | Reactants goes to ts1 then to ts2 then to products | 
|
Descriptions are quite simple here, barrier recrossing (around the TS) is a key idea to this question. Rs6817 (talk) 14:50, 19 May 2020 (BST)
The higher kinetic energy, hence momenta does not necessarily guarantee the reaction would proceed. Higher kinetic energy can mean that the reactants can go over the activation energy barrier, but with energy being too high, products newly formed might overcome the transition state barrier again in the reversed direction and reform reactants, in which case it is not reactive overall.
Barrier recrossing is dictated by excess vibrational energy, otherwise correct. Rs6817 (talk) 14:50, 19 May 2020 (BST)
- Given the results you have obtained, how will Transition State Theory predictions for reaction rate values compare with experimental values?
The Transition State Theory assumes that:
- molecular system that have crossed the transition state in the direction of products cannot reform reactants.
- tunnelling effect neglected
- energy follows boltzmann distribution
- we treat transition state motion classically
- there's equilibrium between reactants and transition state
It is a good estimate for reaction 1, 3 and 5 (only underestimate a bit by ignoring the tunnelling effect) but rather a significant overestimate for reaction 2 and 4. The transition State Theory overestimates the rate compare to the experimental rate because it ignores the fact of recrossing barrier - this way those reaction effectively does not happen because no products would be formed in the end of the reaction, albeit the tunnelling effect which may also happen in the real world scenario where reactants does not have to overcome the activation energy to to form products, would make TST an underestimate (It is the recrossing barrier effect that's more pronounced so overall it is still an overestimate).
Great well done for listing the assumptions of TST, well done comparing this to your results from the table. Good description of over / under estimation contributions, you are correct in that quantum tunnelling will be negligible as compared to barrier recrossing. Rs6817 (talk) 14:50, 19 May 2020 (BST)
PES inspection
- By inspecting the potential energy surfaces, classify the F + H2 and H + HF reactions according to their energetics (endothermic or exothermic). How does this relate to the bond strength of the chemical species involved?
Formation of HF: From the potential energy surface diagram, we can see that as rab increases, the potential energy drops, so the reaction is exothermic. As we know, the bond enthalpy of H-F is significantly larger than the bond enthalpy of H-H (567 kJ/mol vs 436 kJ/mol) Where did you obtain these values?. Rs6817 (talk) 14:50, 19 May 2020 (BST)
. Due to the newly formed stronger H-F bond, the reaction releases energy into the surroundings hence exothermic. Conversely, the formation of H2 leads to an endothermic reaction.
Perhaps some literature comparison would have helped here Rs6817 (talk) 14:50, 19 May 2020 (BST)
(mep PES used to make the reaction path clearer)

Formation of H2: 
- Locate the approximate position of the transition state.
1.Formation of HF: Because the reaction resembles a early transition state according to Hammond's postulate, hence the distance between ab at ts must be smaller than that of bc at ts.
rab = 74.485 pm, rbc = 181.197 pm when the initial momenta are both 0.
Good estimates Rs6817 (talk) 14:50, 19 May 2020 (BST)
2.Formation of H2: Because the reaction resembles a late transition stat4e according to Hammond's postulate, hence the distance between ab at ts must be bigger than that of bc at ts.
rab = 181.197 pm, rbc = 74.485 pm when the initial momenta are both 0.
- Report the activation energy for both reactions.
Ea of reaction 1: 127 kJ/mol
Ea of reaction 2: 1.28 kJ/mol
Ea was found by setting the calculation type in MEP and alter the ts distance for one out of two distances by 1 pm. Last geometry energy Ereactants was acquired and Ea = the difference between Ets and Ereactants. Steps was set at 2600 with size 0.1 fs.
Reaction dynamics
- Identify a set of initial conditions that results in a reactive trajectory for the F + H2, and look at the “Animation” and “Momenta vs Time”. In light of the fact that energy is conserved, discuss the mechanism of release of the reaction energy. Explain how this could be confirmed experimentally.
Some graphs would be ideal here Rs6817 (talk) 14:50, 19 May 2020 (BST)
The reactants has initial total energy above the activation energy and the recrossing of barrier is forbidden.
The bond enthalpy for the formation of HF is higher than that for the formation of HH so this reaction is an exothermic reaction. Hence, the products are at a lower energy state than the reactants. This means that the potential energy of the products becomes lower and due to the conservation of energy, the kinetic energy (both translational and vibrational) of the products should get higher. Since, average kinetic energy is correlated to temperature, the temperature of the system will be higher than the surroundings after the reaction, resulting a heat transfer from system to surroundings.
This effect can be measured by calorimetry. If we have the reaction in a flask embedded in an insulator filled with oil which has a certain heat capacity, then the temperature change over the period of reaction proceeding can be measured in a fixed time interval. We could find the maximum temperature change by plotting temperature vs time and calculate the heat transferred by using ΔQ=cΔΤ.
Good description - what type of calorimatry though? Rs6817 (talk) 14:50, 19 May 2020 (BST)
Furthermore, we can also find the heat transfer for the internal vibrational relaxation. After the exothermic reaction, H-F got promoted from ground state to exited states and it will emit photons in the ir spectrum. By using the IR Chemiluminescence, we can find the energy spacing between the vibrational levels 1 to 0 and 2 to 1.
- The cases studied are an illustration of Polanyi's empirical rules. Discuss how the distribution of energy between different modes (translation and vibration) affect the efficiency of the reaction, and how this is influenced by the position of the transition state.
For a reaction with a late-barrier (late-transition state), the vibrational energy is more efficient in promoting it to overcome the barrier than translational barrier. Conversely for a reaction with with an early-barrier (early transition state), translational energy is most effective for overcoming the barrier.
You could have used a trajectory to illustrate your points here, how does this apply to the HF system directly? References would have helped develop your arguments here. Rs6817 (talk) 14:50, 19 May 2020 (BST)