MRD:everything01095534
Chunks of this report are plagiarised.João (talk) 16:44, 16 May 2017 (BST)
Molecular Reaction Dynamics of Triatomic systems
this wiki page is to explain triatomic interaction dynamic and illustrate it on specific example
background Theory
The nucleus, is extremely heavy and large compare to electron in the atom. So when an atom moving toward or backward to another atom, the relationship can be shown by the equation below:
The force (variation of momentum p) acting on a given intervatomic coordinate ri will depend on the derivative of the potential energy surface with respect to that coordinate.
In this concept only three atoms on a straight line will be considered.
H+H2 System
In this context, three hydrogen atoms are aligned on a straight line to use Matlab programming the potential energy change of the atoms under different condition
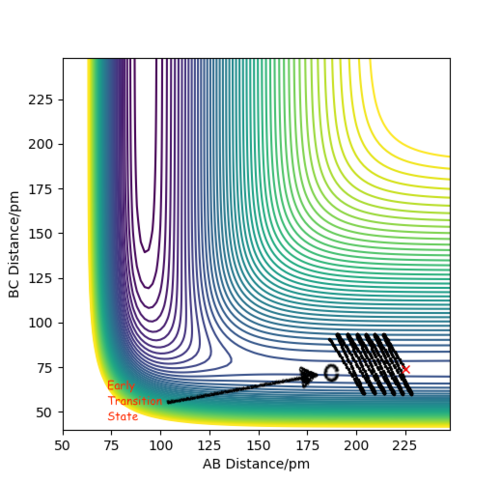
contour graph when the distance between A and B is equal to 0.74 which is just like the normal bond length of a normal H2 molecule. In the H + H2 model, the initial conditions are set as r1 = 0.74 ,r2 = 2.30 and the momenta p1=0 p2 = -2.7.

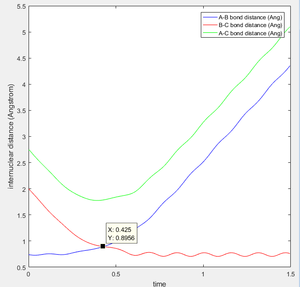
This is the figure which shows when the time goes to 0.38 time units, a repetitive oscillation behavior is happened, showing that the transition state was also suppose to be found at 0.38 time units. So the rts is 0.9148A then. But based on the result of animation, the true rts is 0.90775A but not 0.9148A.

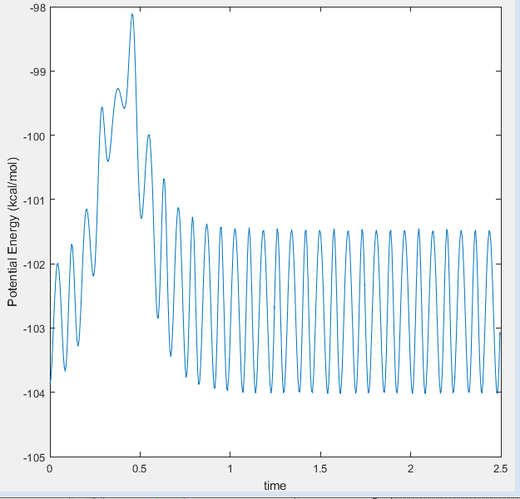
The "Potential Energy vs Time" and "Kinetic Energy vs Time" proved that at transition state the potential energy gives rise to the highest value while kinetic energy give rise to the lowest value. As well, an oscillatory behavior rising after the transition state.
The total gradient of the minimum (at the start and the end point in reactant) on the potential energy surface is equal to 0 as well as at the transition state point. But the difference between the minimum and the transition state point is that transition state point has a negative second derivative towards product and a positive second derivative towards reactant; while at the minimum point in the whole system (at the beginning point in the reactant) have a zero second derivative value.Hence the potential energy difference between minimum energy and transition state is the activation eneregy
Trajectories from r1 = r2 locating the transition state
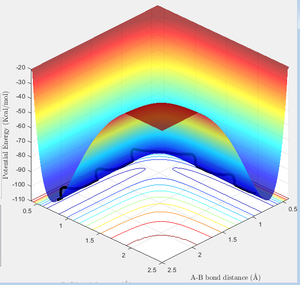
Due to H + H2 potential surface is symmetric(left and right of the transition state), assuming the transition state must have r1 = r2 = 0.90775A (rts at the transition state position), the relative stationary state of motion is observed. If the approaching proton atom is placed at the ridge of potential surface, there is no gradient in the direction at right angle to the ridge; therefore the proton sphere would oscillate about that region without falling down. As shown in the figures below, one figure shows that the reactant proton is oscillating at the transition state position; while another shows that there is not any relative change in terms of the distance for the three protons against time.
Calculating the reaction path by using Trajectories from r1 = rts r2 = rts+ δ
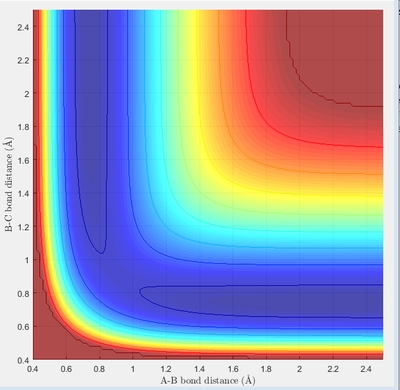
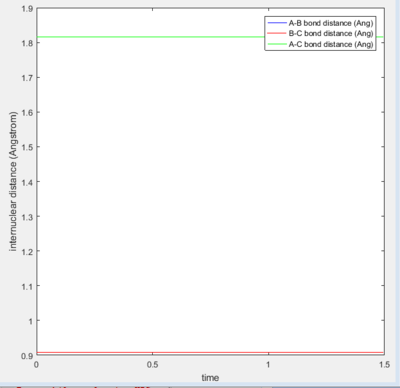
This model will favour HA-HB + HC as reactant proton C is very close to the central proton. In this section, a initial system of r1 = 0.91775, r2 = 0.90775. p1 = 0 p2 = 0 is considered.
MEP calculation type
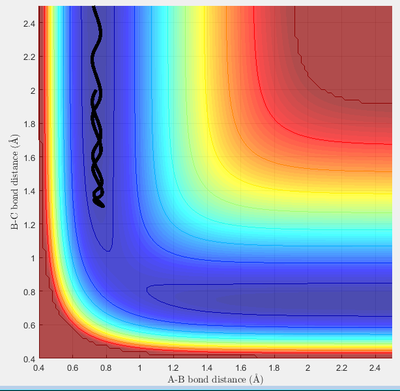
In this case, there is a little derivation from the transition state position, say 0.01A derivation for a first try, for one of the protons. The MEP calculation type is set so as to simulate the motion for this circumstance. The MEP contour plot is given .
unreactive trajectories
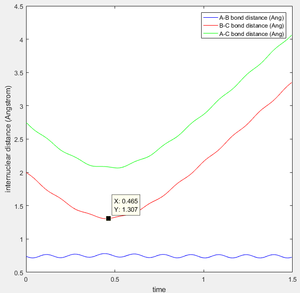
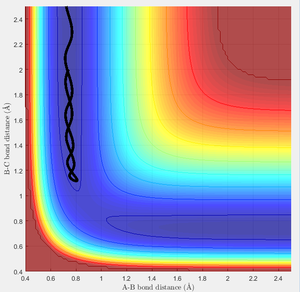
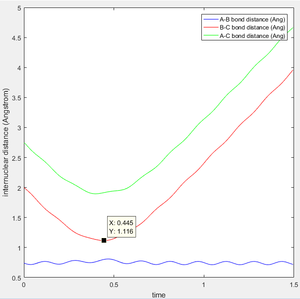
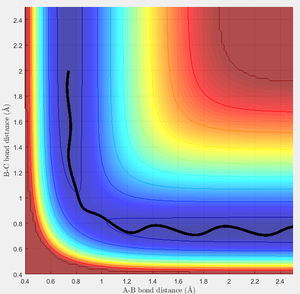
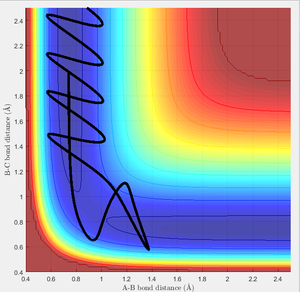
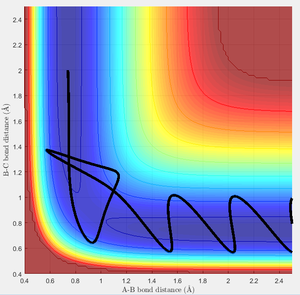
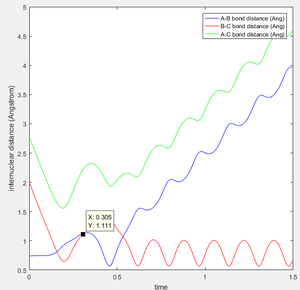
From the previous calculations we can conclude that trajectories with initial conditions in the range r1 = 0.74, r2 = 2.0, with -1.5 < p1 < -0.8 and p2 = -2.5 are reactive
For the initial positions r1 = 0.74 and r2 = 2.0, run trajectories with the following momenta combination:
H-H-F System
the reaction is exothermic by broken a H-H bond and form a H-F bond. It can be proof by the potential energy surface, when hydrogen bonded to fluorine the minimum energy is significantly lower than the minimum energy when hydrogens are bonded

Transition State
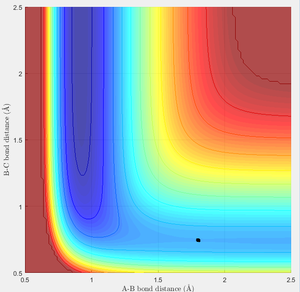
As we talk above the transition state is the maximum value of the minimum band, after many postulating the transition state is test as when fluorine-hydrogen distance is 1.810Å from the middle hydrogen(H-H bond existing)
Activation Energy
According to Hammond's postulate, the transition state is close to the reactant so, by slightly change the distance between fluorine molecule and hydrogen atom in the middle the atom will back to the position.


