01061310
Molecular Reaction Dynamics
By modelling atoms as spheres, classical Newtonian mechanics is used to simulate collisions, which gives a successful insight into chemical reactivity for triatomic systems system.

H + H2 system:
Determination of transtion state geometry
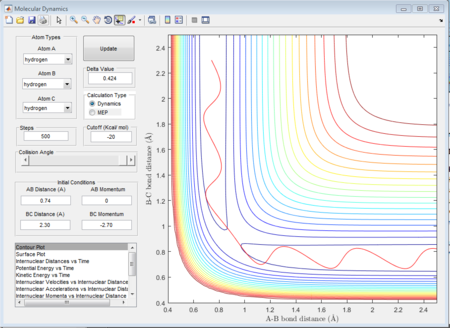
There is a contour graph when the distance between A and B is equal to 0.74 which is just like the normal bond length of a normal H2 molecule. In the H + H2 model, the initial conditions are set as r1 = 0.74 ,r2 = 2.30 and the momenta p1=0 p2 = -2.7.
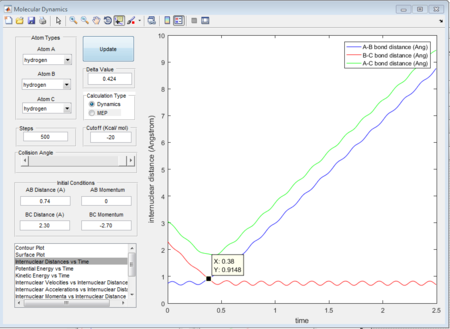
This is the figure which shows when the time goes to 0.38 time units, a repetitive oscillation behavior is happened, showing that the transition state was also suppose to be found at 0.38 time units. So the rts is 0.9148A then. But based on the result of animation, the true rts is 0.90775A but not 0.9148A.
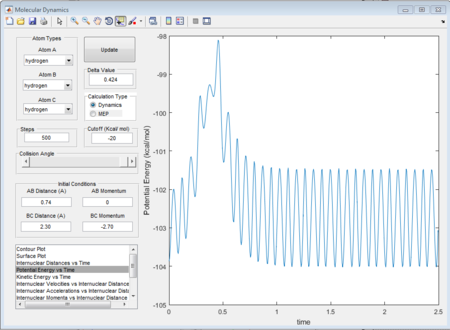
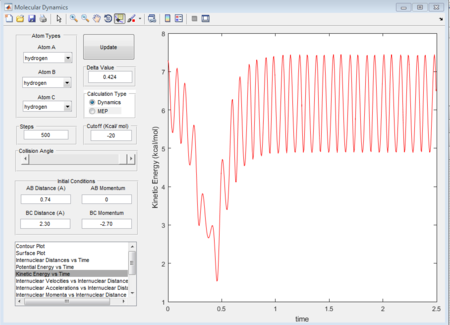
The "Potential Energy vs Time" and "Kinetic Energy vs Time" prove that at transition state the potential gives rise to the highest value while kinetic energy give rise to the lowest value. As well, an oscillatory behavior rising after the transition state.
The total gradient of the minimum (at the starting point in reactant) on the potential energy surface is equal to 0 as well as at the transition state point. But the difference between the minimum and the transition state point is that transition state point is a saddle point with second derivative equal to zero; while at the minimum point in the whole system (at the beginning point in the reactant) the second derivative value is not equal to zero.
(Fv611 (talk) 17:45, 16 May 2017 (BST) A lot of confusion in this answer. Not clear on what "Based on the results of the animation" means. The mathematical definition of the transition state is wrong.)
Trajectories from r1 = r2 locating the transition state
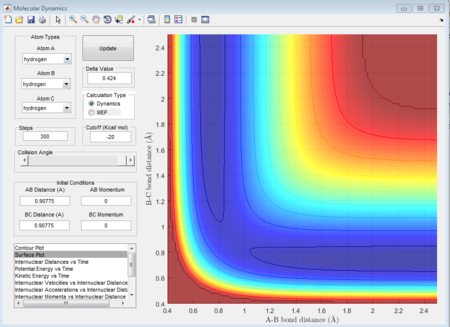
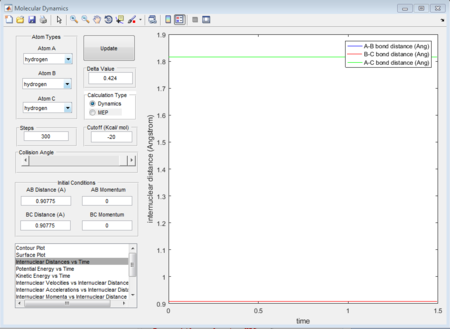
Due to H + H2 potential surface is symmetric, assuming the transition state must have r1 = r2 = 0.90775A (rts at the transition state position), the relative stationary state of motion is observed. If the approaching proton atom is placed at the ridge of potential surface, there is no gradient in the direction at right angle to the ridge; therefore the proton sphere would oscillate about that region without falling down. As shown in the figures below, one figure shows that the reactant proton is oscillating at the transition state position; while another shows that there is not any relative change in terms of the distance for the three protons against time.
(Fv611 (talk) 17:45, 16 May 2017 (BST) Unclear how you got the TS. Where is the figure of the reactant proton oscillating?)
Calculating the reaction path by using Trajectories from r1 = rts r2 = rts+ δ
This model will favour HA-HB + HC as reactant proton C is very close to the central proton. In this section, a initial system of r1 = 0.91775, r2 = 0.90775. p1 = 0 p2 = 0 is considered.
- MEP calculation type
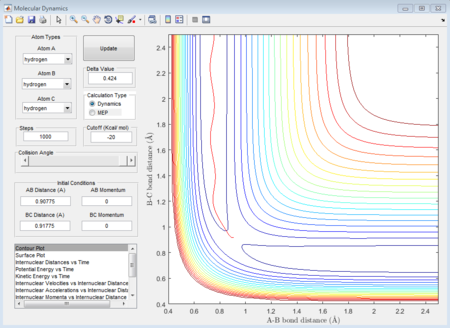
In this case, there is a little derivation from the transition state position, say 0.01A derivation for a first try, for one of the protons. The MEP calculation type is set so as to simulate the motion for this circumstance. The MEP contour plot is given below.
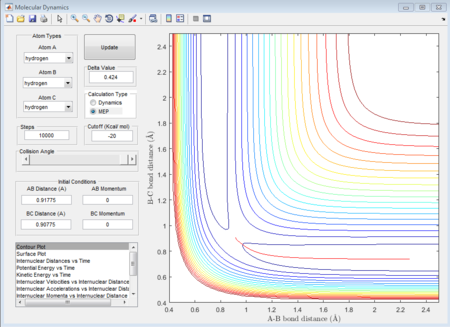
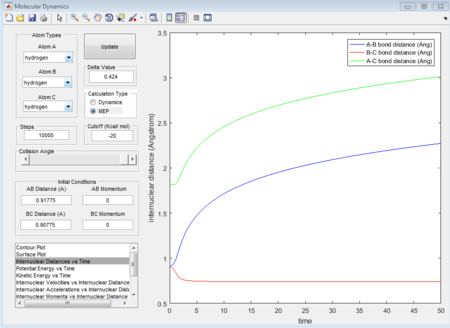
The averged momenta p1(t) and p2(t) are 0 and 0 respectively. And the final values of the positions r1 and r2 are 0.91775A and 0.90775A.
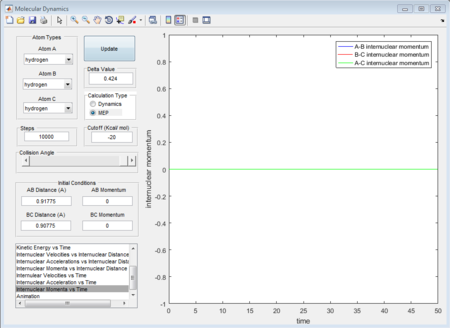
- Dynamics calculation type
When dynamics calculation type is applied again, the trajectories gained is quite different from MEP calculation type. See the figures below, which show the averaged moment and the final positions.
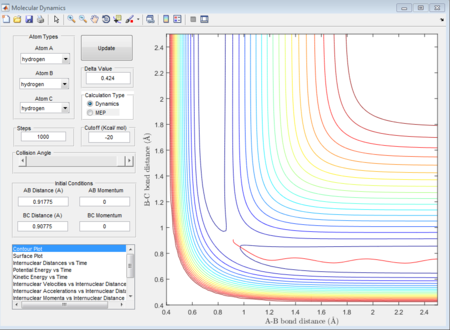
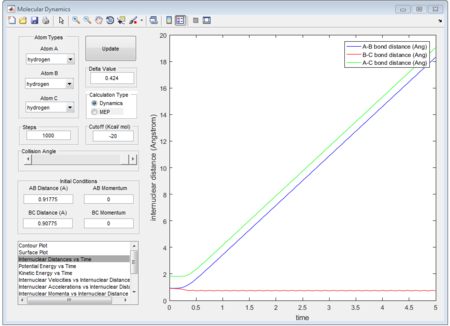
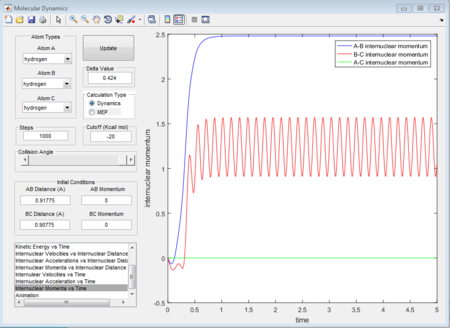
r1 = 5.281A
r2 = 0.7455A
p1 = 2.481 (Calculated as an average of the maxima 1.564 and minima 0.9109 at a large t)
p2 = 1.237
Because MEP is considered that there is a step-energy down where the main difference is, comparing to the dynamics calculation type. The MEP just calculate all the minimum energy following the trajectories while dynamics calculation type includes all the vibrating situation with the trajectories. We can see this from figure 11 and figure 14, for MEP, the momenta is equal to zero which means that MEP does not consider the vibration so that even it is given a little delta distance away from transition state point, the proton with that distance away from transition state will not go downhill and the reaction will not happen. While for dynamics calculation, since vibration is included, if a proton is placed near to the transition state, the motion will happen automatically so that reaction will happen automatically as well.
(Fv611 (talk) 17:45, 16 May 2017 (BST) Your discussion is very difficult to follow. Main difference between mep and dynamics resides in the treatment of velocity.)
Calculating the reaction path by using Trajectories from r1 = rts + δ r2 = rts
Here, we are going to swap the parameters from what we just did in last section,
r1 = 0.7455A
r2 = 5.281A
p1 =1.237 (Calculated as an average of the maxima 1.564 and minima 0.9109 at a large t)
p2 = 2.481
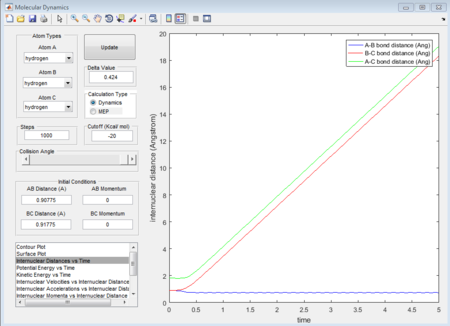
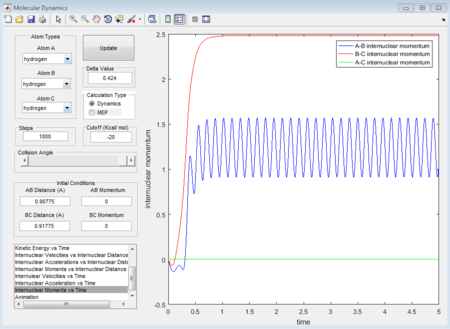
As shown above, the only difference is the sign; this part the sign for every distances and momenta are opposite.
Reactive and unreactive trajectories with initial conditions r1 = 0.74A r2 = 2.0A -1.5 < p1 < -0.8 p2 = -2.5
Several parameters of distances and momentum are shown in the table:
| Group | p1 | p2 |
|---|---|---|
| 1st group | -1.25 | -2.5 |
| 2nd group | -1.5 | -2.0 |
| 3rd group | -1.5 | -2.5 |
| 4th group | -2.5 | -5.0 |
| 5th group | -2.5 | -5.2 |
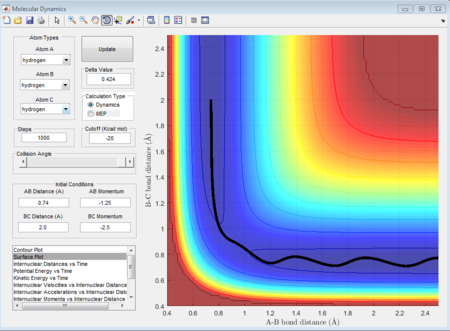
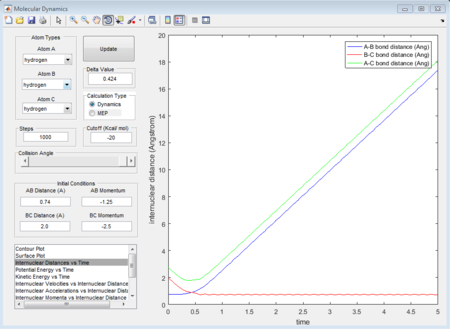
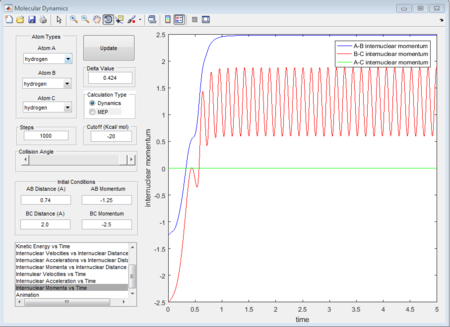
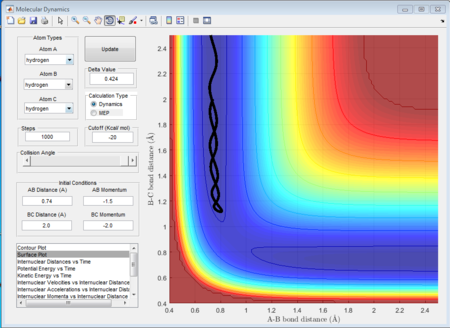
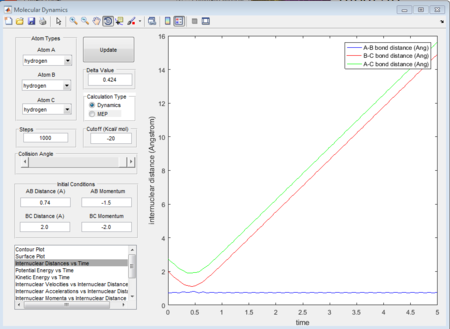
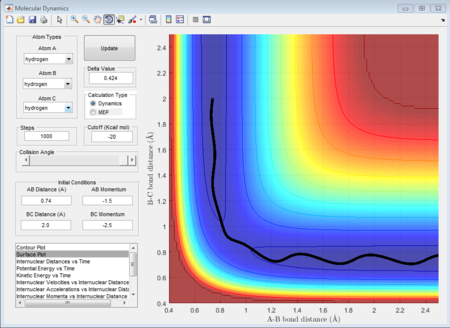
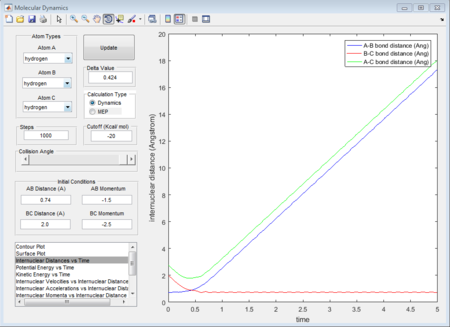
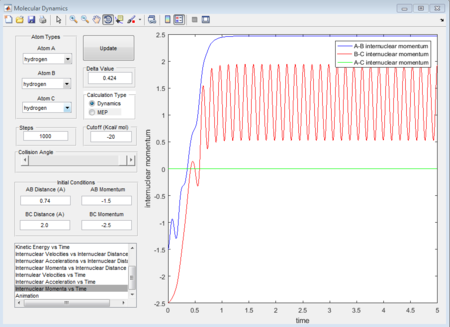
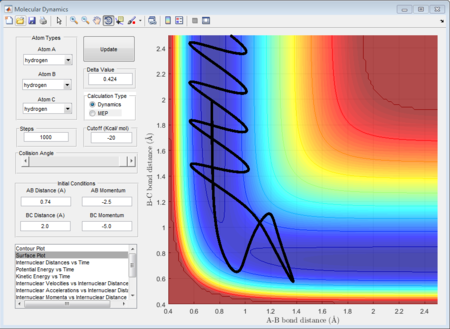
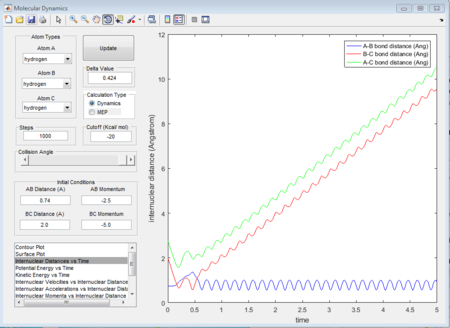
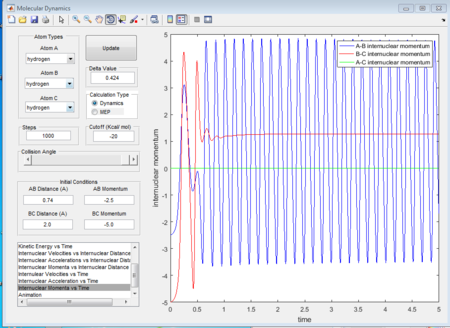
The initial condition is set as range with -1.5 < p1 < -0.8 and p2 = -2.5, and whether the reaction would happen is tested. As shown in below figures, the reactiveness is analysed and it shows that being able to react is dependent on both initial kinetic energy of approaching molecule and the direction of vibrating condition of existing bimolecular structure.
- 1st group: r1 = 0.74A r2 = 2.0A p1 = -1.25 p2 = -2.5
- 2nd group: r1 = 0.74A r2 = 2.0A p1 = -1.5 p2 = -2.0
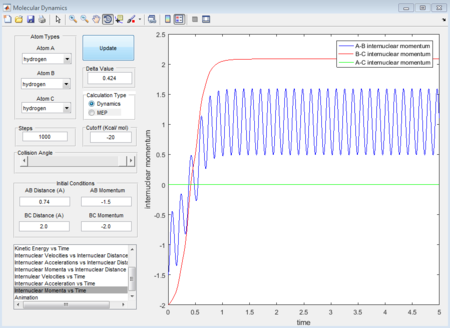
- 3rd group: r1 = 0.74A r2 = 2.0A p1 = -1.5 p2 = -2.5
- 4th group: r1 = 0.74A r2 = 2.0A p1 = -2.5 p2 = -5.0
- 5th group: r1 = 0.74A r2 = 2.0A p1 = -2.5 p2 = -5.2
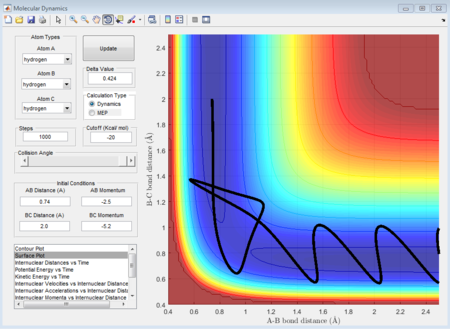
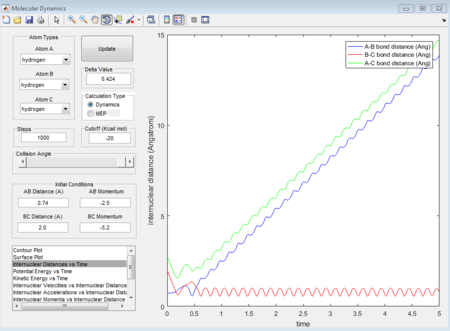
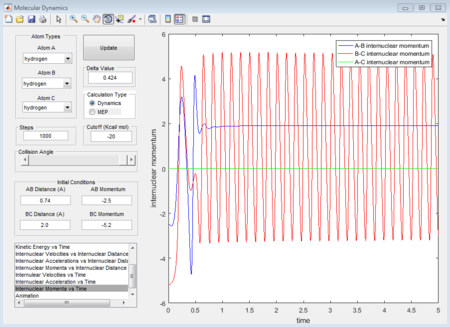
The 1st, 3rd and 5th group show Hc-HB + HA as the reactant, and they all have reactive trajectories. From examining the entrance channels of figure 17, 23 and 29 we can conclude that they are all have sufficient energies to cross the potential energy barrier and form the product.
While for the 2nd and 4th group, 2nd group doesn’t have much translational energy which means that the approaching proton cannot cross the energy barrier. However for group 4, the approaching proton can form product in a high vibrational energy state, but then it reverts back to the reactants, which is at a lower vibrational energy state. Ultimately neither of the reaction is reactive. Transition state theory mensions that once the reactant overcomes the barrier, the product must be formed. While in our experimental results, as like in group 5, it shows that even the reactant atom has enough translational energy, it still has the probability of coming back to reactant rather than forming a product. Because for this case, the vibrational direction for both reactant atoms is still important.
(17:45, 16 May 2017 (BST) Why didn't you add a column to the table as you were asked? The discussion of the trajectories is correct, but could have a bit more detail. You didn't answer to the question on Transition State assumptionS, only mentioned the recrossing with relationship to your unreactive trajectories.)
Exercise 2. F H-H and F-H H models
This triatomic systems used the following models H + H - F and F + H - H. In the first part, the circumstance where there is a proton approaching to a existing H - F molecule will be discussed; while in the second part, the circumstance of F approach to H2 is discussed. One big difference of these two models is that since H - F bond strength is much larger than H - H bond; therefore, when F approaches to H2 molecule, the following process should be exothermic due to a much preferred bond forming. For a proton approaching H - F case, the bond formation here is endothermic.
As well, the surface plots can show which model is exothermic or endothermic.
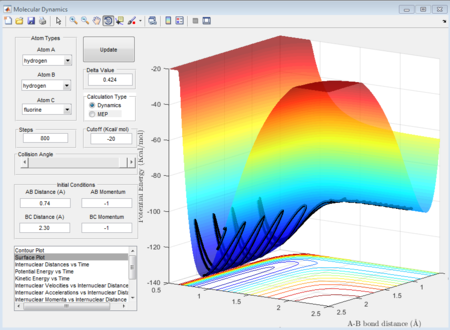
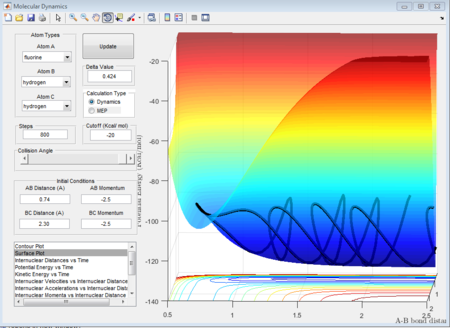
From these surfaces plot we can see that we just change the aprroaching atom (in the first plot we fix H2 and make F approach, in the second plot we fix F - H and make H approach). In the figure 32, this figure shows the circumstance where Fluorine approaches to H - H and it is seen that the final potential energy surface is lower than the reactant potential energy surface, which means this process is exothermic. While as shown in figure 33, a proton approaches to the H- F case gives rise to a higher potential energy state in product orientation, which means the process is endothermic.
(Fv611 (talk) 17:56, 16 May 2017 (BST) Discussion of the energetics is correct, however you don't justify your statement about bond strengths, and the two surface plots can't be compared as the labelling of the axes of Fig. 33 is unclear.)
Determination of transition state geometry for F + H2 system
Firstly, we fix the bond length of H2 --- 0.74A as mentioned in the exercise 1. We can determine the transition state position rts.
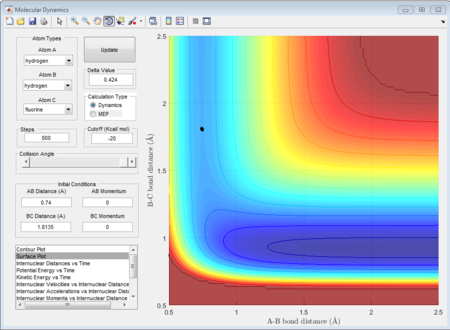
As shown in figure 33, when the total momenta in the whole system is zero, there is just a singlet point occurred in the trajectories meaning that these three atoms are in the transition state. Therefore, the internuclear distance for H and F (rts) is determined as 1.8135A.
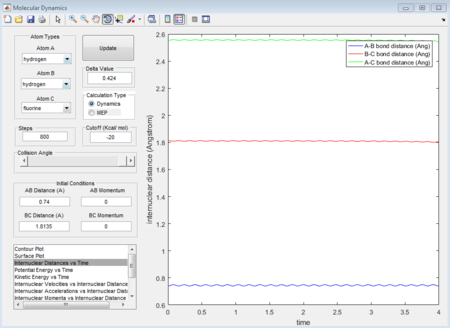
The figure 34 evidently shows that the at distance 1.8135A, the internuclear distance does not change with time. Because at transition state, the transition-state structure is the same, the same transition state distance is also for when a proton approach to H - F case.
Determination of Activation energy for both reaction
- F + H2 model
Based on Hammond postulate, this circumstance is an exothermic process which means that the transition state point must be located at the reactant path. Therefore, if we offset little further from the H - H bond with no momenta in the whole system, giving enough time, the activation energy can be estimated as a form of the potential energy difference.
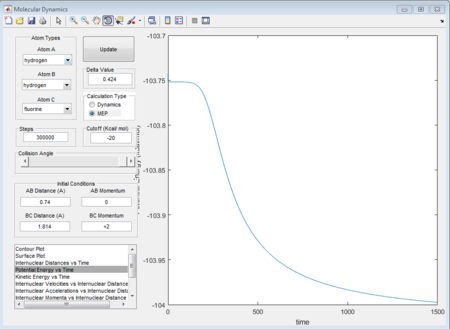
Shown in the figure 35, the activation energy is +0.24 kcal/mol
- H + HF model
In this case, the transition structure is resembled to the product whose potential energy difference is higher than reactant energy level. In other words, because the transition state is at the product trajectory orientation, we need to set a offset little close to the H - F bond condition without any momenta in the whole system.
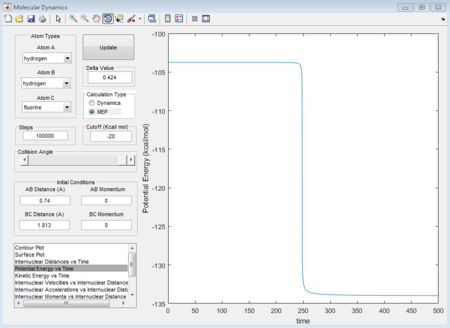
Shown in the figure 36, the activation energy is +30.1 kcal/mol
(Fv611 (talk) 17:56, 16 May 2017 (BST) Has the MEP converged?)
Reaction Dynamics Questions
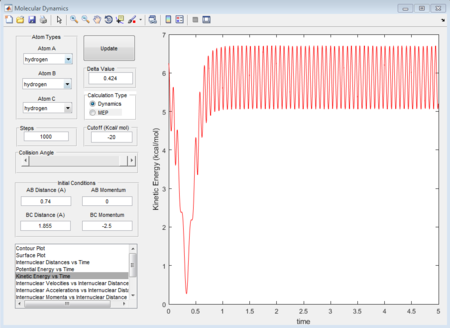
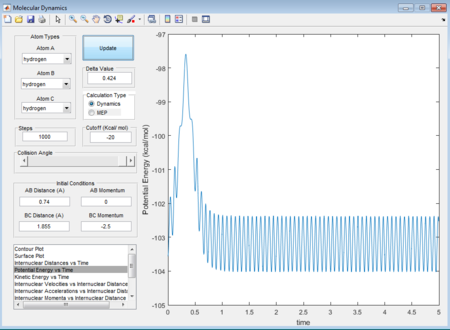
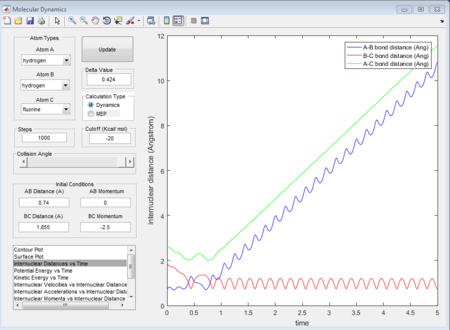
- A random initial conditions that results in a reactive trajectory for F + H2 can be set as r(HH) = 0.74A r(HF) = 1.855 p1 = 0 p2 = -2.5. The mechanism of release of the reaction energy is that when the approaching atom goes to the transition state there is a dramatical decrease tiwce in terms of kinetic energy (figure 37), followed by a comeback of vibrating conditions after that. See the potential energy (figure 38) of the whole system, it also shows a reverse process of kinetic energy with twice dramatic change increase and then comeback to a constantly vibrating circumstance. Therefore, based on the figure 39 as well, it can be concluded that the vibrational F atom with enough kinetic energy approaches the H2 molecule overcomes the transition state twice.
(Fv611 (talk) 17:56, 16 May 2017 (BST) Unclear, and doesn't answer the question about experimental procedures)
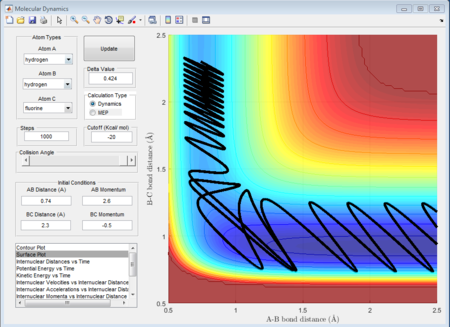
- A acceptable value of a reactive path is r (HH) = 0.74A r (HF) = 2.30A p1 = 2.6 p2 = -0.5. In this condition, the fluorine atom approaches with a fairly small momentum. So there is a relatively long time for fluorine to get approach the transition state. Once the fluorine atom gets to the transition state, the hydrogen is being pushed away with another fairly long time again and then kicked away. We can see this from the internuclear distance vs time figure and this shows the whole process very clear.
- The blue part question answer at last: whether H + HF reaction happen depends on both translational energy of the proton but also the vibrational energy of HF itself. As the figures shown below, there is a such a minimum translational energy for the approaching proton to get overcom of the reaction barrier. but if there is not enough vibrational energy of HF, the reaction will not happen. So, in other words, the most effective factor to influence the reactiveness is the vibrational energy for HF. And because in endothermic case, the transition state in the trajectory is in the product path. If the transition state position changes to on the entrance of the reactant, the different energy modes have different effect on the reactiveness.
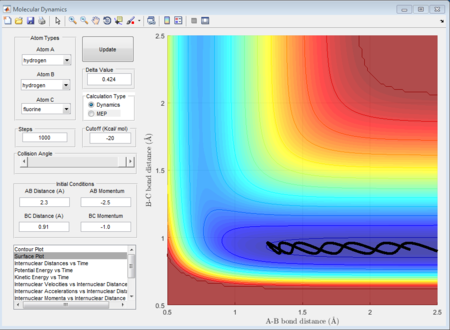
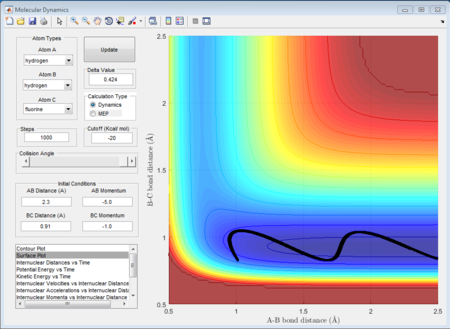
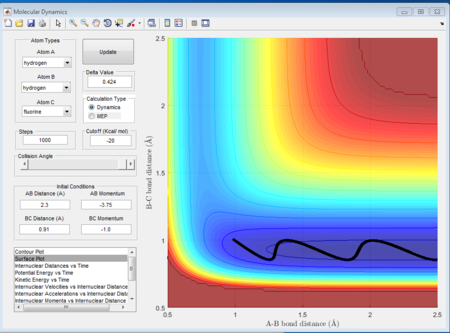
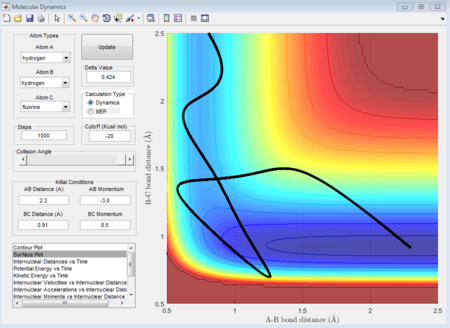
As shown above, different conditions of r1 r2 and p1 p2 are applied to investigate the reactiveness in the H + HF reaction. Figure 41, 42, and 43 are unreactive while figure 44 is reactive.
(Fv611 (talk) 17:56, 16 May 2017 (BST) Unclear. Dumping screenshots and saying "as shown below" is not enough to make your point. You mention the content of Polany's rules, but don't mention them nor reference them.)
