MRD:aem416
This report has been plagiarised.
Excercise 1: H + H2
On a potential energy surface diagram, how is the transition state mathematically defined? How can the transition state be identified, and how can it be distinguished from a local minimum of the potential energy surface?
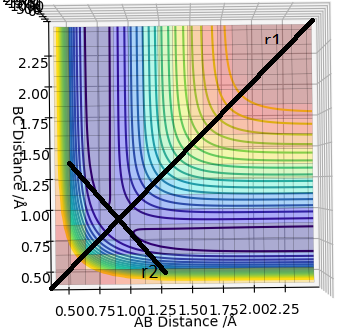
The transition state is the maximum on the line of minimum energy linking reactants to products, a saddle point in a 3D graph. At a saddle point the first partial derivative is zero (∂V(ri)/∂ri=0). Aditionally, the second partial derivatives of the saddle point with respect to the orthogonal vectors r1 and r2 have opposite signs. The vectors r1 and r2 are orthogonal to eachother, and r1 is defined as being tangent to the saddle back of the minimum energy line (see diagram).
Report your best estimate of the transition state position (rts) and explain your reasoning illustrating it with a “Internuclear Distances vs Time” plot for a relevant trajectory.
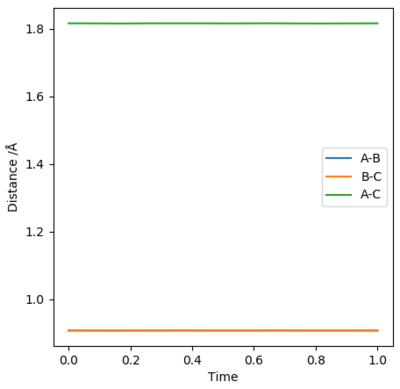
Using AB = BC and setting both momenta to 0, the transition state can be determined using a plot of internuclear distances vs time. The distance was optimised to reduce oscillations and produce a straight line with no trajectory towards reactants or products, which is the definition of a transition state (see graph). The optimised distance was found to be 0.9079 Å.
Comment on how the mep and the trajectory you just calculated differ.
The MEP graph shows infinitely slow motion, with momentum being reset to 0 after each iteration. In contrast, the dynamics plot shows the vibrational energy associated with the molecule (not a straight line).
 |
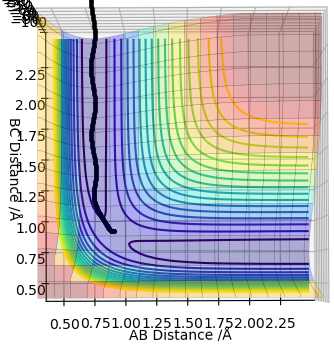 |
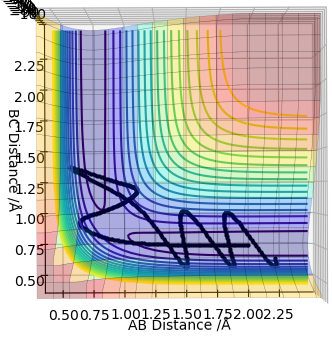
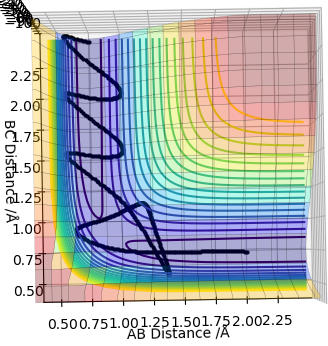
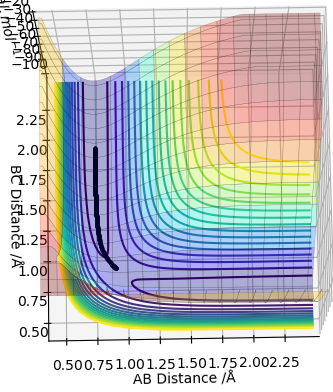
Complete the table above by adding the total energy, whether the trajectory is reactive or unreactive, and provide a plot of the trajectory and a small description for what happens along the trajectory. What can you conclude from the table?
In conclusion, if the reactants have less energy than the required one to overcome the transition state, the reaction will not occur. If the reactants have a large excess of energy required for the reaction, there is a chance that they will recross the barrier and turn back to reactants.
State what are the main assumptions of Transition State Theory. Given the results you have obtained, how will Transition State Theory predictions for reaction rate values compare with experimental values?
The assumptions in Transition State Theory are:
- The electronic and nuclear motions are separate.
- The equilibrium Boltzmann distribution is used to describe the energy distribution of the reactants throughout the reaction.
- There is no barrier recrossing possible.
- In the transition state, motion along the reaction coordinate may be separated from all other motions.
- Even if there is no equilibrium between the reactants and the products, the activated complex is still distributed according to the Boltzmann distribution.
This theory assumes that there is no barrier recrossing, but that disagrees with the experimental values calculated above, where recrossing was observed. Since the theory assumes that all collisions with energy higher than the activation energy are successful, it predicts a higher reaction rate than the one observed experimentally.
EXERCISE 2: F - H - H system
PES inspection
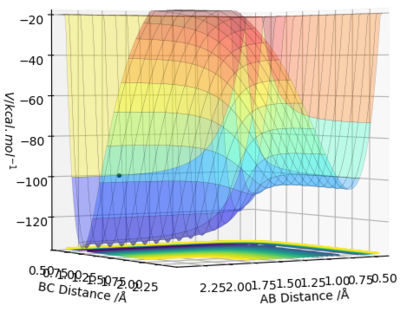
By inspecting the potential energy surfaces, classify the F + H2 and H + HF reactions according to their energetics (endothermic or exothermic). How does this relate to the bond strength of the chemical species involved?
 |
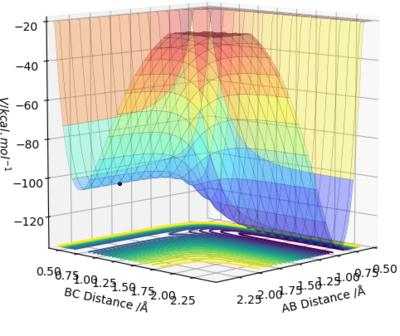 |
The surface plot for HF + H starts with low energy and needs a large amount of energy to cross the transition state, after which its energy drops a tiny bit. This reaction is therefore endothermic.
The surface plot for HH + F starts with a relatively high energy and drops down to a low energy after the transition state. This reaction is therefore exothermic.
This demonstrates that the HF bond is stronger than the HH bond since HF is lower in energy than HH.
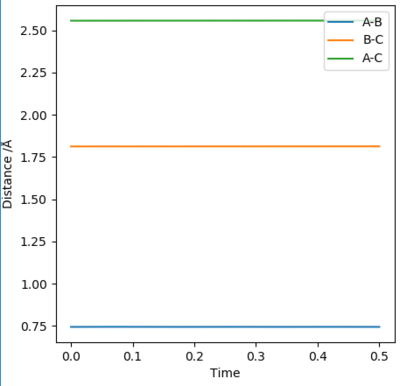
According to Hammond's postulate, the transition state will resemble the reactants or products, whichever is closest in energy. To find the TS, both momenta were set to zero and the distances were optimised until minimal oscillation was reached in the internuclear distances vs time graph (see diagram below). These were 1.813 Å for H-F and 0.7445 Å for H-H. Therefore, rts(H-F)=1.813 Å and rts(H-H)=0.7445 Å.
 |
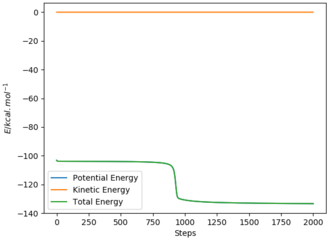
Report the activation energy for both reactions.
 |
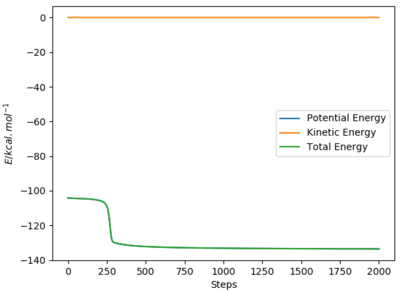 |
Activation Energy(H + HF)= +29.621 kcal mol-1
Reaction dynamics
In light of the fact that energy is conserved, discuss the mechanism of release of the reaction energy. Explain how this could be confirmed experimentally.
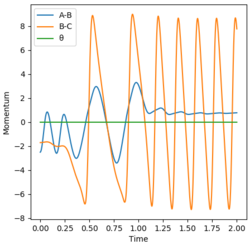
Initial conditions were found that gave a reactive trajectory. These were an AB distance of 0.74 angstroms, a BC distance of 1.80 angstroms, an AB momentum of -2.5 and a BC momentum of -1.70. This produces the Momenta vs Time graph shown below.
 |
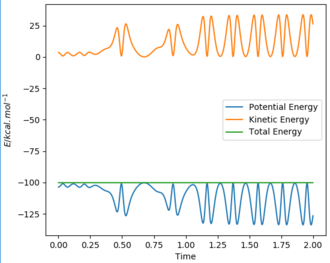 |
The energy is converted into kinetic energy of BC (see graph above). Since the reaction is exothermic the kinetic energy is converted into heat, which experimentally is observed as an increase in temperature.
Discuss how the distribution of energy between different modes (translation and vibration) affect the efficiency of the reaction, and how this is influenced by the position of the transition state.
Polanyi's rules state that vibrational energy is much less efficient in promoting an early-transition state reaction than translational energy, and vice versa for a late-transition state reaction.
Since the reaction of H2 and F is exothermic, according to Hammond's postulate this reaction has an early transition state. Conversely, the reaction of HF and H is endothermic and so according to Hammond's postulate has a late transition state. Taking into account Polanyi's rules, the reaction of H2 and F should be most effectively activated by translational energy and the reaction of HF and H should be most effectively activated by vibrational energy.
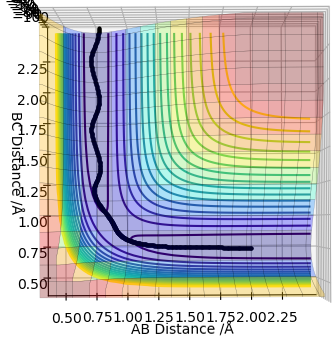
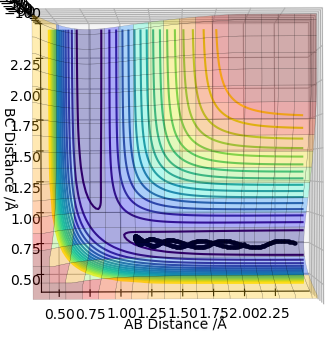
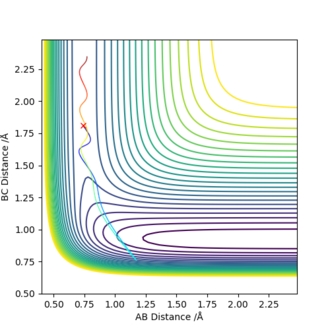
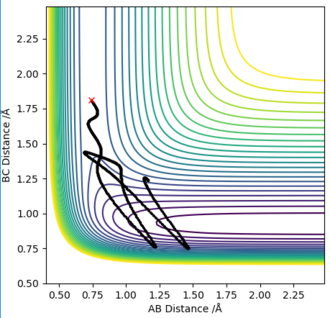
For the reaction of H2 + F, the values of rHH=0.74 angstroms and rHF=1.81 angstroms were used. The left hand figure below shows the contour plot when pAB=-2.5 and pBC=-0.5, having a greater vibrational energy. The right hand figure shows the contour plot when pAB=-0.5 and pBC=-2.5, having a greater translational energy. The figure with the greater translational energy has a successful trajectory, whereas the one with greater vibrational energy has an unsuccessful trajectory.
According to Polyani's empirical rules, we would expect the reaction to be most effectively activated by vibrational energy. The graphs agree with this theory.
 |
 |

