MRD:Stella
EXERCISE 1: H + H2 system
Dynamics from the transition state region
- What value does the total gradient of the potential energy surface have at a minimum and at a transition structure? Briefly explain how minima and transition structures can be distinguished using the curvature of the potential energy surface.
Molecular reaction dynamics is a critical technique in the investigation of the collisions between molecules. It enhances the understanding at the molecular level mechanism of elementary chemical and physical processes by considering and controlling the parameters specifying the initial state of the reactants, followed by observation on how it affects the trajectory of the reaction.
While modern computational methods typically involves quantum calculations and analyses, this study aims to achieve a fundamental understanding of molecular dynamics through a classical approach.
A calculation of a linear triatomic H + H2 system was performed, where r1 = 0.74, r2 = 2.30, p1 = 0.0 and p2 = -2.7.
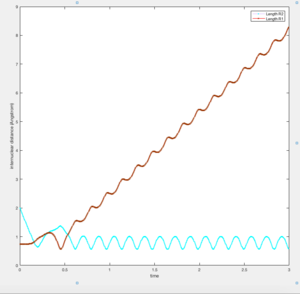
An illustration of the reaction trajectory is illustrated in Figure 1a, and the potential energy of the system against time is displayed in Figure 1b.
 |
 |
| Figure 1a. The surface plot of H1–H2. | Figure 1b. Graph of the potential energy of the system against t. |
Each point along the potential energy surface (Figure 1a) is a representation of the energy for a specific geometrical configuration of the atoms/molecules involved, which are expressed by the distances r1 and r2. The motion of the atom could be scrutinised by determining the forces acting on the atoms.
This is determined by taking the first derivative, as expressed in Eq. 1:
| (1) |
If F ≠ 0, the atom would move in the direction of the force, until the force acting on the atom is zero, and the potential energy of the system minimised.
A preliminary observation of the reaction trajectory of H3 and H1–H2 establishes that the reaction proceeds along a path of minimum potential energy (near the base of the potential well), which is clearly featured in Figure 2a.
A salient feature is the slight sinusoidal-like pattern of the reaction trajectory. This could be attributed to the molecular vibrations at the equilibrium state of molecules, as displayed in Figure 1a and Figure 2a. A graph of the internuclear momentum against time is presented in Figure 3 for reference.
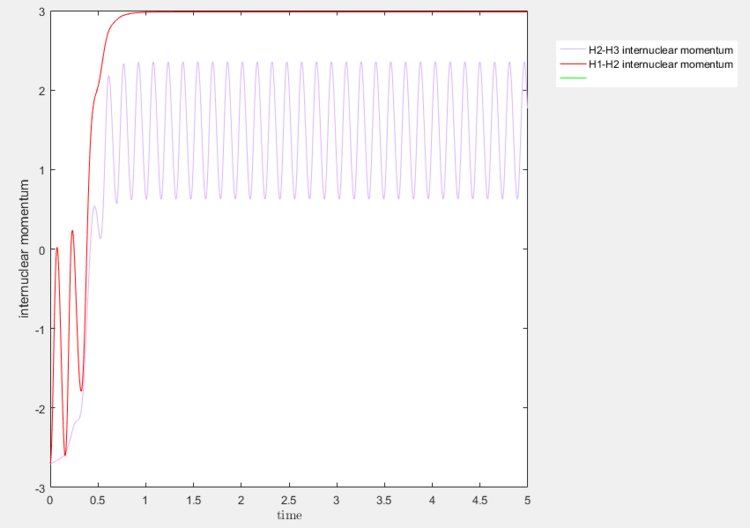
The sinusoidal pattern of the internuclear momentum for H1–H2 from t = 0 and t = 0.325, for instance, is indicative of molecular vibrations. This is corroborated by the sinusoidal pattern of the H1–H3 internuclear momentum curve after t = 0.695, after the formation of the H1–H3 bond. The highly symmetrical oscillatory nature of the graph is characteristic of symmetric molecular vibrations, and this is further corroborated by the plateau of the H1–H2 internuclear momentum at the same time, corresponding to an absence of vibrations between the now free H1 and H2 atoms.
An inspection of the reaction coordinate reveals a distinct maxima as exhibited in Figure 2b, corresponding to the transition state. The transition state is characterised as the region which separates the reactants from the products, and is associated with the highest potential energy along the reaction coordinate. In this case, this is the region where the system most resembles a triatomic molecule, where r1 = r2.
In the three-dimensional visualisation, stable species appear as minima on the potential energy surface, where the deepest well corresponds to the most stable species. On the other hand, transition states correlate with the saddle-point in the potential energy surface. It is a maximum in one dimension, which is along the reaction coordinate, and minimum in all other dimensions, as illustrated in Figure 2b and Figure 2a respectively.
Up to this point, all the above was not really related to the question. Perhaps you could've moved this to an introductory section. The question was merely asking between the mathematical distinction between a minima and a transition state in a generic PES. Je714 (talk) 15:20, 31 May 2017 (BST)
Therefore, the total gradient, F at the minima, and the transition state, is equal to 0, and therefore, it cannot be used as a distinguishing factor between the two.
However, a second order partial derivative can be performed to determine the nature of the local extremum, as illustrated in Eq. (2):
| (2) |
If the point is a global or local minimum, then the value and . The saddle point is confirmed if , which correlates to the transition state. By observing Figure 2a, a distinctive saddle point is revealed.
Where did you get this from? I think you're trying to use the [second partial derivative test](https://www.wikiwand.com/en/Second_partial_derivative_test), but I'm not sure since you're not defining what your notation means. When using maths, it's important to let the reader know what each symbol means. I assume that D is the determinant of the Hessian matrix. In such case, I'm afraid you got the definition of it, and the sign of the test, wrong. D is actually equal to and D<0 for a saddle point. Je714 (talk) 15:20, 31 May 2017 (BST)
Trajectories from r1 = r2: locating the transition state
- Report your best estimate of the transition state position (rts) and explain your reasoning illustrating it with a “Internuclear Distances vs Time” screenshot for a relevant trajectory.
In the reaction of H1–H2 with H3 atom, this involves the bond breaking of the H1–H2, as well as the bond formation of –H3. At the transition state, the potential energy of the system is maximum along the reaction trajectory, which occurs at the point where the separation of H1, H2 and H3 atoms are equidistant since the H + H2 surface is symmetric. At the transition state, it is also important to consider how the velocity associated with any atom affects the reaction coordinate. If p1 or p2 is not zero, a slight displacement from the saddle point would result in the H atoms sliding towards either the reactants’ or products’ valley.
As such, by modifying the values such that r1 = r2, as well as p1 = p2 = 0, it is possible to locate the transition state geometry, since there is no resultant force that drives the reaction either towards the reactants or the products.
Figure 4 illustrates the internuclear distance of the atoms against time.

The straight line graphs are representative of the motion of the atoms, indicating that there is no vibration between the atoms. Another prominent feature is that both r1 and r2 gradients are 0, which means that the internuclear forces of attraction between H1 and H2, as well as those between H1 and H3 balance, such that the resultant force on the atoms (given in Eq. 1) = 0.
Since r1 = r2, the graphs are identical and directly overlay each other, as evident in Figure 4. The transition state position rts is determined to be 0.908.
Trajectories from r1 = rts+δ, r2 = rts
- Comment on how the mep and the trajectory you just calculated differ.
The minimum energy path (mep) searches for transition states and intermediates between the reactants and products, by following along the reaction trajectory, until the saddle point is reached. This is attributed to the fact that the reaction trajectory passes through the local minima of the potential energy surface, and thus the height of the barrier is the lowest maximum of the potential between the reactants’ and products’ valleys.
One of the established methods of the mep is the utilisation of many geometric configurations of the system to describe the reaction pathway. At each time step, the velocity of the atoms are reset to zero. It can, therefore, present information about the total gradient of the minimum energy pathway, and a description of the reaction trajectory in a qualitative manner (the direction of the reaction progress). This is because all subsequent geometric configurations in each time step are dependent on the gradient of the potential surface at that point, F, without any contribution from the translational or vibrational modes of the atoms. In contrast, a molecular dynamics calculation does not constraint the velocity of the atoms, and the trajectory traced includes contributions of F at that instant and the instantaneous motion of the atoms.
| Molecular Dynamics | mep |
|---|---|
| The contour plot exhibits an oscillatory behaviour due to molecular vibrations. | The contour plot is a smooth curve since any vibrational motion of the molecules are ignored. |
| The potential energy graph exhibits a noticeable oscillatory behaviour when t is approximately 0.5 from the H1–H2 vibration, and a regular oscillatory pattern at approximately t = 0.95, upon the complete bond formation between H2–H3, and the separation of H1 from the diatomic molecule. | The potential energy curve smoothly decreases over time and does not plateau within t = 3. |
Good. Be careful: the mep isn't really searching for TS geometries -- it simply follows the path along where the energy is minimal. Je714 (talk) 15:24, 31 May 2017 (BST)
- What would change if we used the initial conditions r1 = rts and r2 = rts+0.01 instead?
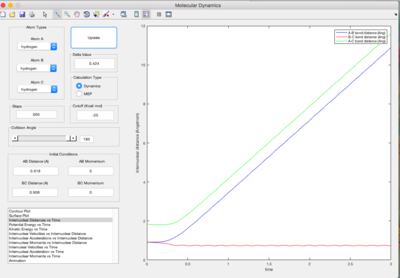
If the above conditions were used, H1–H2 + H3 are formed instead of H2–H3 and H1. Figure 5a. illustrates the subsequent motion of the atoms.
 |
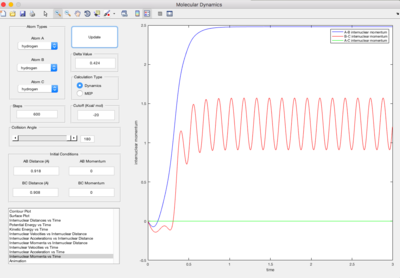 |
| Figure 5a. Graph of internuclear distance against time t when r1 = 0.908 and r2 = 0.918. | Figure 5b. Graph of internuclear momenta against time t when r1 = 0.908 and r2 = 0.918. |
A slight oscillatory behaviour of the in Figure 5a. implies the presence of the H1–H2 vibrations. This also affects the behaviour of the plot, which is expected to be linear. This is ascribed to the periodic increase and decrease in separation between the H1 and H2 atoms, which corresponds to the value of r1, and between the H3 and H2 atoms (r2). Figure 5b elucidates the relationships between the atoms, where the displays sinusoidal behaviour and the graph is linear, verifying the presence of H1–H2 + H3.
Reactive and unreactive trajectories
- Complete the table by adding a column reporting if the trajectory is reactive or unreactive. For each set of initial conditions, provide a screenshot of the trajectory and a small description for what happens along the trajectory.
Limitations of Transition State Theory
- State what are the main assumptions of Transition State Theory. Given the results you have obtained, how will Transition State Theory predictions for reaction rate values compare with experimental values?
Transition state theory is established on the principles of classical mechanics, where the reactants must collide with sufficient energy to form the transition state in order for the reaction to occur. However, this does not sufficiently describe the dynamics of a reaction.
A fundamental assumption of transition state theory is that classical trajectories do not recross the transition dividing surface, such that, starting from the reactants, if the system reaches the transition state configuration, it will necessarily proceed to form products.[1][2] If such a configuration can be identified then it must be crossed by any reactive trajectory and transition state theory assumes that it is only crossed once.
This is incorrect, however, and the breakdown of this fundamental approximation is illustrated in Figures 9a, 9b, 10a and 10b. This effect is significant under high temperature conditions due to the large kinetic energy associated with the system, and is corroborated by literature review.[1]
Good. This is the main limitation that you do observe in your simulations. Je714 (talk) 15:28, 31 May 2017 (BST)
Another essential assumption of transition state theory is the concept of quasi-equilibrium. It states for a system at complete equilibrium, the activated complexes are at equilibrium. The concentration of the activated complexes is independent of changes in concentration of the reactants and products, and therefore, the concentration can be quantitatively determined based on principles of equilibrium theory. This could be a plausible approach, except an accurate position of the transition state cannot be ascertained. The accuracy of the calculated transition state is limited by the sophistication and complexity of the computational method, and to obtain a highly accurate picture is computationally inefficient and costly.
Not really applicable here, as this is a statistical treatment of TST. In this lab, you're just looking at a simple triatomic collision in issolation -- not an an ensemble of particles. Je714 (talk) 15:28, 31 May 2017 (BST)
In such a case, a quantum mechanical descriptor might be more appropriate. There is a non-zero probability for H to tunnel through the potential barrier and form the products. Past research has suggested that for small atoms like hydrogen, such effects are significant.[3]
Literature review has indicated that recrossing would result in the overestimation of thermal rate constants, whereas the neglect of quantum effects on the reaction coordinate motion would lead to underestimations of reaction rates.[4] From this investigation, it seems more probable that reaction rate values are overestimated due to the large effects of recrossing observed, but this cannot be definitively concluded.
Good thinking. But bear in mind that the QM limitation isn't applicable here since the simulations are treating the atoms classically. Je714 (talk) 15:28, 31 May 2017 (BST)
EXERCISE 2: F–H–H system
PES inspection
- Classify the F + H2 and H + HF reactions according to their energetics (endothermic or exothermic). How does this relate to the bond strength of the chemical species involved?
The reaction between F and H2 is exothermic, since the minimum point energy of H2 is less exothermic than the minimum energy of the HF bond.
The reaction between F and H2 is illustrated in the following equation: F + H2 HF + H. The reaction between H + HF is simply the reverse of the reaction as displayed above.
To determine which reaction is exothermic, the potential energy of the reactants and the products for both scenarios have to be considered. you just did, though Je714 (talk) 15:33, 31 May 2017 (BST)
Figure 11 presents the potential energy surface of the reaction between H2 and F.

Figure 11 has been adjusted to juxtapose the stability of H2 and HF molecules. The potential energy of the H2 molecule at equilibrium is as indicated in the figure. It is evident that this potential energy is a local minima, whereas the formation of the HF molecule is the global minima since the potential energy value is comparably more exothermic.
The reaction between F and H2 is therefore exothermic, while the inverse reaction (HF + H) is endothermic, and this is verified by the reaction trajectory of the H2 + F reaction in Figure 11.
To evaluate the validity of this conclusion, literature values of the H2 and HF bond dissociation energies were compared, to determine the standard enthalpy change of both reactions. The values found were 436.002 kJ/mol and 568.6 kJ/mol respectively. The enthalpy change of the reaction between H2 and F was calculated to be -132.6 kJ/mol, and conversely, +132.6 kJ/mol for the reaction between H and HF. [1] This is in agreement with the interpretation of the molecular dynamics calculation.
The exothermic reaction between H2 and F implies that the HF bond is stronger than that of H2.
Locating transition state
- Locate the approximate position of the transition state.
As elucidated above in Exercise 1, the transition state for the system can be determined by finding the distances r(HH) and r(HF) by fixing the values of pHH and pHF = 0. At the saddle point, the atoms would roll neither towards the reactants nor the products.
Hammond’s postulate predicts that in an exothermic reaction, the transition state is closer in energy to the reactants than the products. The highly exothermic reaction between F and H2 indicates that the energy level of the transition state is extremely close in energy to H2 than F.
As such, an initial molecular dynamics test was performed with a test value of r(HH) = 0.74, which is close to the equilibrium bond length of H2, and r(HF) = 2.00. Figure 12 shows the trajectory obtained.

An inspection of the trajectory reveals that this initial guess is slightly before the approach of the transition state, since H2 is formed, and F drifts away from H2. This implies that the rHF is larger than that of the actual rHF (transition) value.
After further modifications of the rHF values, an approximation of rHF (transition) and rHH (transition) was evaluated, which are 1.81 Å and 0.745 Å respectively. Figure 13 illustrates the reaction trajectory calculated, where it is observed that the reaction trajectory is merely a point.

Activation Energy Calculation
- Report the activation energy for both reactions.
To determine the potential energy of the transition state, the potential energy against time graph was obtained at rHF (transition) = 1.79 Angstroms and rHH (transition) = 0.745. This was achieved by running a molecular dynamics calculation at 10 000 steps. The potential energy was determined to be -103.752 kcal/mol.
H2 + F HF
An initial mep calculation was performed at rHF (transition) = 1.79 Å and rHH (transition) = 0.745 Å with 25 000 steps, and the contour plot was obtained to observe the reaction trajectory.
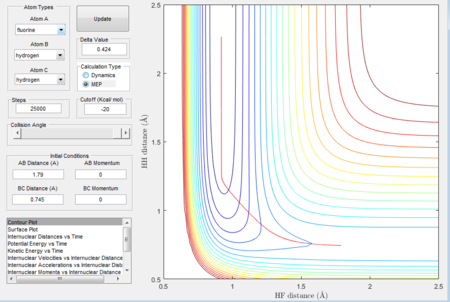
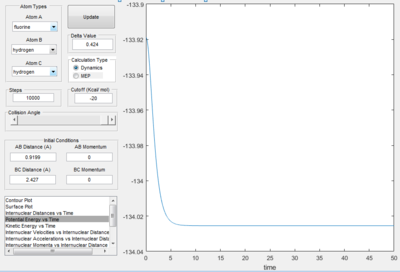
Figure 14 confirms the formation of the HF bond, and the vertical line at rHF (transition) = 0.9199 Å and rHH (transition) = 2.427 Å indicates that it is probable the energy minimised structure of HF has been obtained. To test this, a dynamics calculation with 10 000 steps at rHF (transition) = 0.9199 Å and rHH (transition) = 2.427 Å was performed. The results are displayed in Figure 15a and Figure 15b.
 |
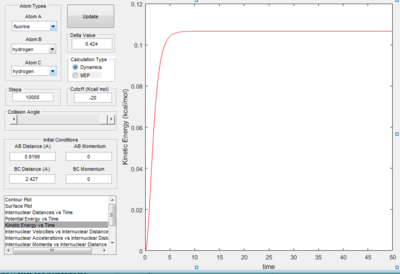 |
| Figure 15a. Potential energy plot. | Figure 15b. Kinetic energy plot. |
From Figure 15a, it is observed that the potential energy of the system initially decreases, but approaches a horizontal limit of -134.025 kcal/mol. This convergence implies that the potential energy of HF at equilibrium is -134.025 kcal/mol. The Figure 15b also validates this inference, as the value increases and approaches a horizontal limit as well.
The activation energy of the reaction is therefore given in Eq. 3.
| (3) |
This value is calculated to be +30.273 kcal/mol.
HF + H H2 + F
Following a similar procedure as given above, an initial mep calculation was performed at rHF (transition) = 1.82 Å and rHH (transition) = 0.740 with 35 000 steps, and the contour plot was obtained to observe the reaction trajectory. At the end terminal, the values of rHF (transition) and rHH (transition) are 2.029 Å and 0.7416 Å respectively.

To determine whether the equilibrium structure of H2 was attained, a further dynamics calculation with 10 000 steps was performed at rHF (transition) = 2.029 Å and rHH (transition) = 0.7416 Å. The results are displayed in Figure 17a and Figure 17b.
 |
 |
| Figure 17a. Graph of the potential energy of the system against t. | Figure 17b. Graph of the kinetic energy of the system against t. |
From the potential energy against time graph, it is observed that the potential energy of the system initially decreases, but approaches a horizontal limit of -104.020 kcal/mol. This convergence implies that the potential energy of HF at equilibrium is -104.020 kcal/mol. The kinetic energy against time graph also validates this inference, as the value increases and approaches a horizontal limit as well.
| (4) |
The activation energy calculated is therefore +0.268 kcal/mol.
Very accurate results. GJ. Je714 (talk) 15:33, 31 May 2017 (BST)
Reaction Dynamics
To understand the dynamics of the reaction between F + H2, it may be useful to temporarily neglect any effects associated with the motion of the atoms, and scrutinise how the potential energy surface affects the reaction path taken.
As such, a preliminary dynamics calculation was performed with F + H2 with the initial conditions of rHF (transition) = 1.80 Angstroms, rHH (transition) = 0.745 Angstroms, pHF (transition) = pHH (transition) = 0. The trajectory computed is illustrated in Figure. The corresponding internuclear distance against time graph is provided in Figure.
FIGURES + TABLE <-- woops Je714 (talk) 15:33, 31 May 2017 (BST)
In this reaction, the release of energy following the initial bond formation of HF at t ≈ 2.6 is converted to translational and hot vibrational energy. The reaction does not proceed via the minimum energy path. This subsequent trajectory of the atoms is thus difficult to explicate based on qualitative analyses of molecular interactions.
Mechanism of release of reaction energy
- In light of the fact that energy is conserved, discuss the mechanism of release of the reaction energy. How could this be confirmed experimentally?
As the atoms roll down to the products’ valley from the transition state, potential energy is converted to translational and vibrational energies.
The reaction energy can be evaluated experimentally through IR spectroscopy. H2 has a high degree of symmetry and as such, is IR inactive, whereas HF has a bond dipole associated with it, and is thus IR active. The intensity of the IR spectrum correlates to the vibrational energy that is released from the reaction.
Since H2 is IR inactive, Raman spectroscopy is a possible method for comparison as well.
Polanyi's empirical rules
- Discuss how the distribution of energy between different modes (translation and vibration) affect the efficiency of the reaction, and how this is influenced by the position of the transition state.
Polanyi’s rules state that the vibrational energy is more efficient in promoting a late-barrier reaction than translational energy, and the reverse is true for an early barrier reaction. These empirically determined principles serve as a guide in understanding the mode/bond selectivity and the energy disposal in chemical processes.
The applicability of Polanyi’s rules are evaluated in the reaction between H and HF.
The reaction between H and HF is highly endothermic, and as such, the reaction is an early barrier reaction. Polanyi’s rules therefore predict a highly efficient reaction between HF and H if a larger the vibrational energy is supplied to the system.
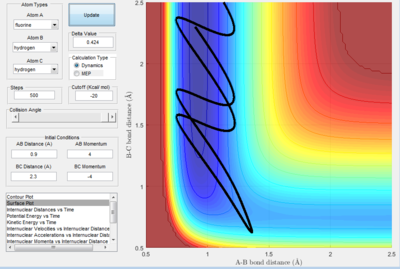
A test trajectory, A was calculated using rHF = 0.9 Å, rHH = 2.3 Å, pHF = 3 and pHH = -4. This is a representation of a HF + H system, where the HF bond is stretched and thus HF possesses vibrational energy. This is depicted in Figure 18a. The corresponding internuclear distance against time graph is provided as well in Figure 18a.
 |
 |
| Figure 18a. The trajectory of system A | Figure 18b. Internuclear Distance vs. t graph. |
An analysis based on the transition state theory would postulate that the formation of H2 molecule, since H and HF collide with sufficient kinetic energy to overcome the energetic barrier. Nonetheless, this is not observed.
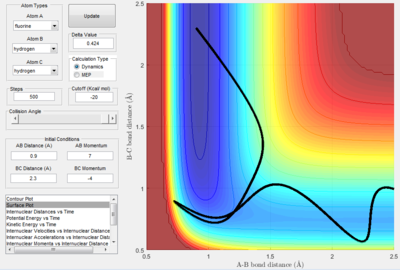
A second system, B was configured as a contrast to system A, whereby the values of rHF and rHH is the same as those in A, while configuring the values of pHF and pHH to 7 and -4 respectively as illustrated in Figure 19a.
 |
 |
| Figure 19a. The trajectory of system B | Figure 19. Internuclear Distance vs. t graph. |
Here, the graph of function rHH indicates that the formation of H2 + F was successful.
A salient feature of both systems A and B is the diagonal relationship between rHH and rHF. The vibrations of HF should result in horizontal oscillations of the trajectory along the minimum energy path. However, following the recrossing of HF + H right arrow H2 + F as shown in system A, the trajectory of HF and H exhibit a diagonal relationship. Figures elucidate the variations in rHF and rHH more clearly, where both functions exhibit sinusoidal behaviour. This is expected for the function rHF, but a linear plot is expected for the function rHH.
This is attributable to the vibrational mode of HF, which results in the contraction and elongation of rHF. Since the quantity rHH is defined as the separation between the two H atoms, this would result in a periodic increase and decrease in the rHH separation. Therefore, both functions demonstrate a similar oscillatory behaviour.
A juxtaposition of Figures underscore the mode selectivity of reaction paths. The calculation performed in this investigation is in good agreement with Polanyi’s rules, where vibrational energy proves to be more efficacious in promoting the endothermic reaction of H and HF.
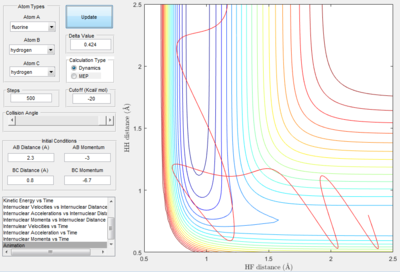
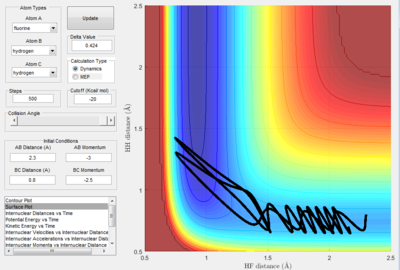
The converse is valid for the H2 + F exothermic reaction as well. Systems C and D were configured with the following values as shown in below, and dynamics was performed with a step of 500.
 |
 |
| Figure 20a. The trajectory of system C | Figure 20b. Internuclear Distance vs. t graph. |
 |
 |
| Figure 20a. The trajectory of system D | Figure 20b. Internuclear Distance vs. t graph. |
The reaction trajectories depicted in Figures substantiate Polanyi’s rules. Figure illustrates the outcome where a large initial vibrational energy is supplied to H2. The trajectory simply recrosses and H2 is regenerated. On the contrary, demonstrates a successful reaction in the formation of HF due to the large translational energy supplied to the system. This therefore establishes that exothermic reactions with an early barrier selectively favour large translational modes between the reactants.
Good discussion Je714 (talk) 15:33, 31 May 2017 (BST)
References
- ↑ 1.0 1.1 1.2 Garrett, B.; Truhlar, D. The Journal of Physical Chemistry 1979, 83, 1079-1112." Cite error: Invalid
<ref>tag; name "(1)" defined multiple times with different content - ↑ Levine, R. Molecular reaction dynamics; 1st ed.; Cambridge University Press: Cambridge, 2009."
- ↑ Lauhon, L.; Ho, W. Physical Review Letters 2000, 85, 4566-4569.
- ↑ Laidler, K.; King, M. The Journal of Physical Chemistry 1983, 87, 2657-2664.


