MRD:MW4015
Introduction
Reactivity
Generally, we think reactions can take place when reactants collide together with enough energy to overcome the barrier. However, this is an approximation since atoms have large masses which allows us to neglects the fact that molecular vibrations are quantized or quantum tunneling effects, but it is nevertheless a good approximation for most chemical reactions.
potential energy
Each atom has kinetic energy which refers to translational and vibrational motion and potential energy which refers to interaction between atoms. The relative motion of atoms depends on interaction between them and can be expressed as potential energy surface which only depends on relative position of atoms. When combining momentum and potential energy together with some calculations, the motion of atoms can be determined by using programs. It can be shown that the trajectory of the system can act as a path across potential energy surface.
triatomic system
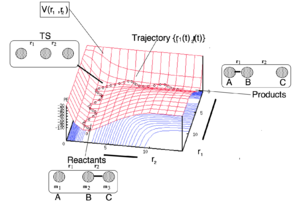
Triatomic system with an atom and diatomic molecule in a linear configuration is the simplest example for investigation of motions of reactants. An atom collide with a diatomic molecule, if the reaction proceeds it will form a new diatomic molecule and atom. As we mentioned above, vibrational motion should be concerned in trajectory, so in potential energy surface, trajectory is not a straight line. It can be considered as a sphere rolling of potential energy surface which gives a wave-like trajectory shown on figure 1.
Reactants pass through transition state which is the saddle point in potential surface. Diatomic molecules keeps vibrating as m1 approach, and the vibrational energy transfers to translational energy of m3 after TS.
figure 1 shows a reactive trajectory. An unreactive trajectory would bounce off the barrier or its surroundings and regenerate the reactants.
Matlab gives more detail about the momentum of two reactants and detailed positions which can help for further investigation. Here are 2 examples.
H + H2 system
Figure 2 is a brief image of collisions between H and H2, when a Hc atom collide with a Hab molecule form a set of diatomic molecule Hbc and an atom Ha.

Transition state region
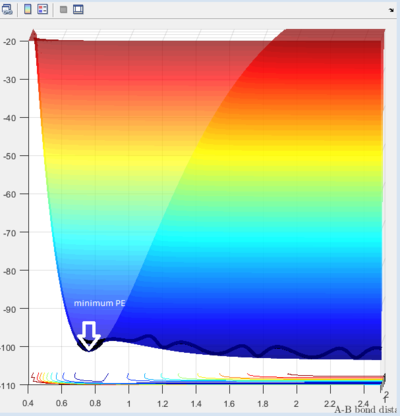
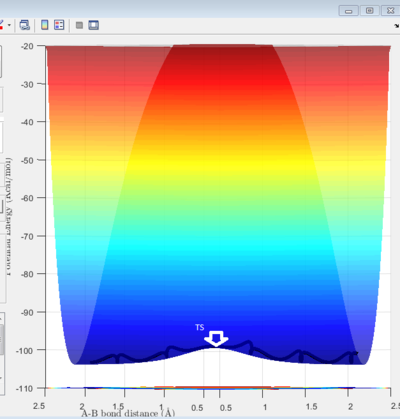
A set of initial conditions allow reaction to take place: r1(0) = 0.74 r2(0) = 2.30 and the momenta p1(0)=0 p2(0) = -2.7. From the potential energy vs time diagram we can observe the maximum point and minimum point on minimum energy path of reaction shown on figure 2 and 3. Both maximum and minimum has a gradient of 0(∂V(ri)/∂ri=0). The maximum refers to transition state is shown figure 3. Minimum and transition state can be distinguished using the second derivative. At the minima, the second derivative is not 0. At the TS, it is the maximum point of the bottom phase shown on figure3a but it is also a minimum point of potential energy which is a saddle point shown on figure3b with a 0 second order derivative.
 |
 |
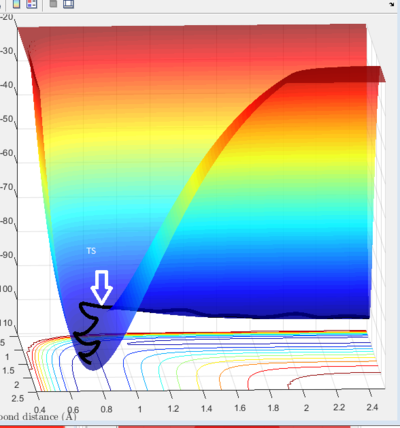 |
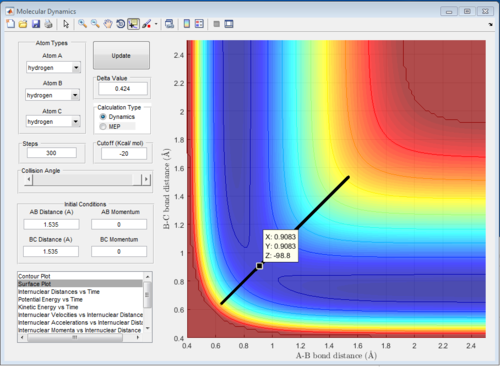
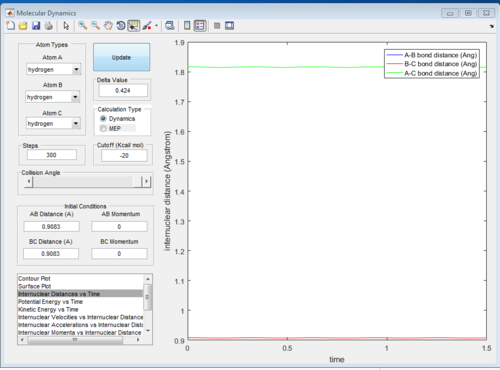
Since the H + H2 surface is symmetric, the transition state must have r1 = r2. If we start a trajectory on the ridge r1 = r2 there is no gradient in the direction at right angles to the ridge, thus the trajectory will oscillate on the ridge and never fall off which gives a straight line shown on figure 4. Since the TS point is the minimum of the potential energy surface, a data cursor can be used to find the coordination with the lowest Z value. As shown on figure 4a,when r1 and r2 are both 0.9084A (rts), the PE reaches minimum and at that point atoms are in equilibrium without they do not have vibrational motion the distance change with time gives one horizontal line since r1 and r2 are the same.
 |
 |
Vibration mode vs mep mode
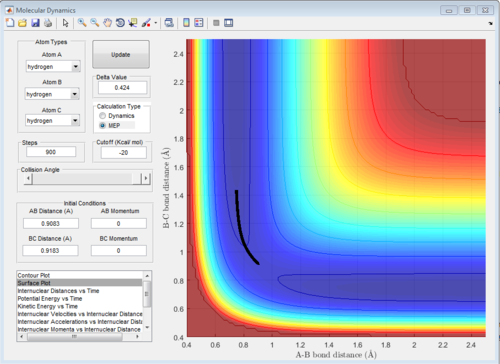
When set positions as r1 = rts+0.01, r2 = rts and the momenta p1 = p2 = 0, calculating trough Mep and dynamic gives tow different trajectory. In Mep mode the motion of atoms are very slow and only the minimum energy points are plotted so vibration motion is not considered which gives a smooth straight line from transition state. In Dynamic mode, the molecules are vibrating which shows a wave.
 |
 |
the internuclear position and internuclear momentum are calculated at 3.5s, when inverse the r1 and r2, the momentum and distance inverse between r1 and r2 as shown on the table below.
| internuclear distance | internuclear momentum | |
|---|---|---|
| r1 = rts+0.01, r2 = rts | r1=12.81, r2=0.750 | r2=1.371, r1=2.48 |
| r2 = rts+0.01, r1 = rts | r2=12.81, r1=0.750 | r1=1.371, r2=2.48 |
Reactive and unreactive trajectories
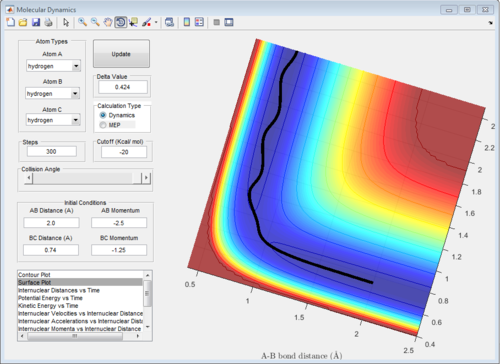
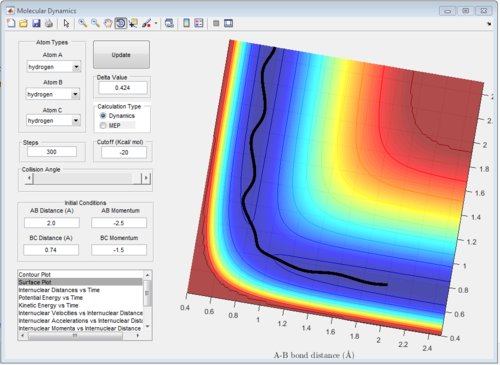
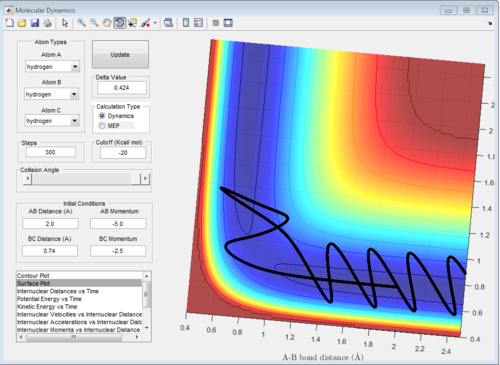
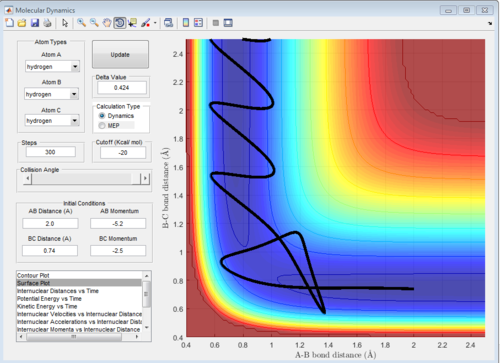
5 sets of momentum are applied to the initial positions r1 = 0.74 and r2 = 2.0 The trajectory can be shown on the figure 6 to see whether reaction happen or not. Reaction 2 and 4 all approach TS then reverse back.
| p1 | p2 | R or UR | Description |
|---|---|---|---|
| -1.25 | -2.5 | Reactive | A approaches B with a larger momentum and enough energy to over TS |
| -1.5 | -2.0 | unreactive | A approaches B slowly, the kinetic energy is not enough to overcome the activation barrier, therefore, no new molecule form. |
| -1.5 | -2.5 | Reactive | A approaches B with enough KE to overcome the barrier to form AB and push C away. |
| -2.5 | -5.0 | unreactive | It across the TS and reverse back to reactants |
| -2.5 | -5.2 | Reactive | KE difference is enough to overcome the activation gap to form a molecule AB with high amplitude vibration while pushing C away gradually. |
 |
 |
 |
 |
 |
Transition State Theory
Assumption: Reactants would react if they passes through the saddle point on the potential energy surface, there is no recrossing back to the product side once the bottleneck has been passed.
However, the experimental data shows the compounds can go back to reactants even cross the TS. The chemical environment and vibration do affect reactivity of reactants and the experimental value of rate would be lower than the one predicted by TS theory.
H-F-H system
H2+F system
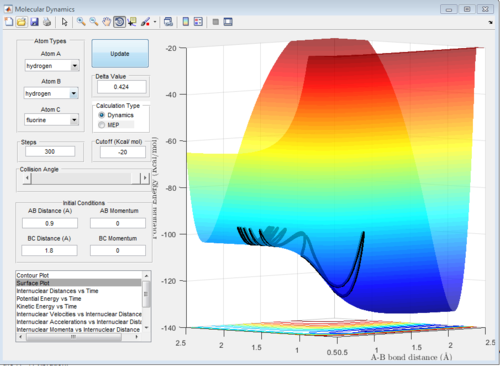
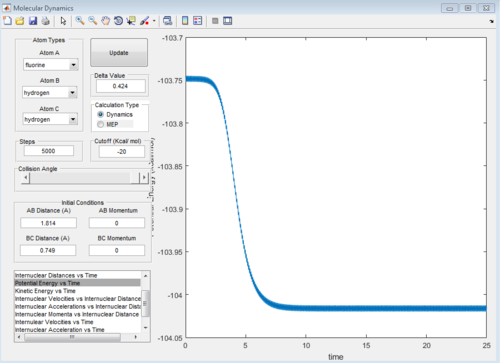
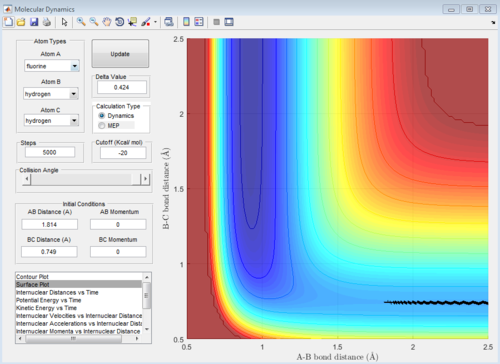
Figure 7a,7b is the F+H2 reaction, from figure7a, it can be seen that the reaction is exothermic as the reactants have higher PE than the products. According to the Hammond postulate, the exothermic reaction has early TS which means the TS is closer to the reactants than the products. By trying the positions located in the reactants area using data cursor, the transition state position is found with AB distance 1.814A and BC 0.749A. The activation energy is about 0.3Kcal/mol using the dynamic calculation shown on figure 7b. Since bond breaking is endothermic and bond forming is exothermic. The overall exothermic reaction shows the exothermic rules the reaction so H-F is the bond that is forming in reaction which has a larger bond strenth.
 |
 |
 |
H+HF system
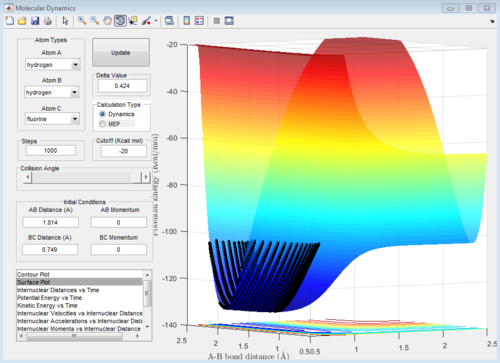
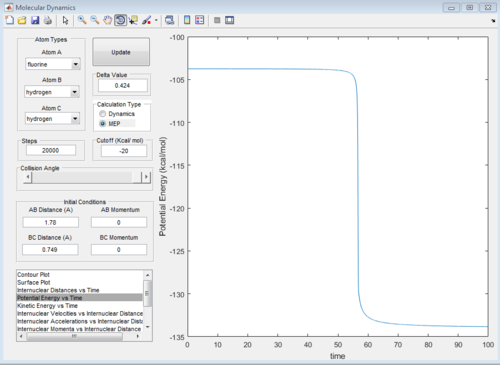
H + HF reaction is an endothermic reaction shown on figure8a, the reactant has higher energy than product so the TS position is closer to the products. TS position for H + HF reaction is similar as the F + H2, which is BC = 0.749 Ang and AB = 1.780. The activation energy is about 30 Kcal/mol using the MEP calculation, this can be seen from the PE vs time graph fugure 8b. HF bond has larger bond strength.
 |
 |
Reaction Dynamics
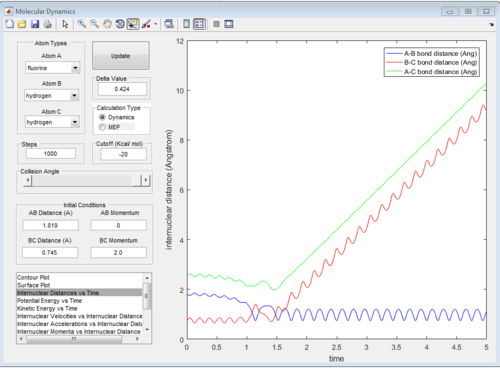
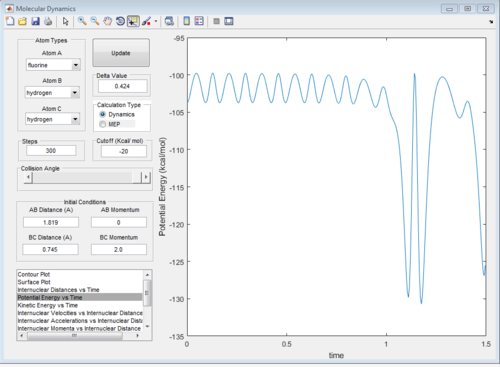
a set of initial condition that allows F + H2 to work is rAB=181.9A, rBC=0.754, pAB=0 pBC=2 The diatomic molecules are vibrating strongly before the reaction happen, then the vibrational energy decreases as F approach, then the kinetic energy suddenly increases when the H-H bond breaks and F_H bond forms.
 |
 |
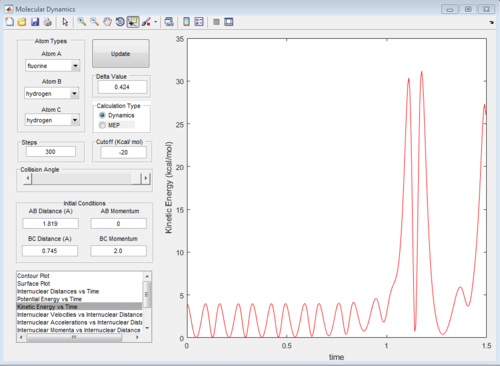 |
When one atom approaches the diatomic, the kinetic energy decreases as the distance between atom and diatomic energy With larger vibrational energy, The reactants are more unlikely to approach TS.
