MRD:01512675
This report has been plagiarised.
Exercise 1: H + H system
Question 1: On a potential energy surface diagram, how is the transition state mathematically defined? How can the transition state be identified, and how can it be distinguished from a local minimum of the potential energy surface?
The transition state is defined as the maximum point of the minimum energy path between the reactants and products. Therefore, on the potential energy surface diagram, it exists as a minimax; a saddle point. This can therefore be described as the point where the partial differential of the potential energy with respect to all variables is zero.
In this case, due to a 3 dimensional surface plot, we have , where and are the respective distances between AB and BC.
The local minimum point would see that a deviation in any direction would be an increase in potential energy. An example of this is the position of the reactants or products on the PES.
However, the transition state would see a decrease in potential energy along the reaction coordinate, and an increase in the coordinate orthogonal to this. This can be seen if we visualise the PES.
Due to the symmetry of this system, the transition state saddle point is observed at a point where = , but this is not necessarily always the case. In some asymmetric systems, the transition state will depend on the relative energy of the products and reactants; this can be further described by Hammond's postulate.
The saddle point of any-dimensional curve can be identified by computing a Hessian matrix.
Upon finding the determinant (H). If H <0, it must be a saddle point, so to find the transition state, we just need to find the coordinates where this is the case.
Question 2:Report your best estimate of the transition state position (rts) and explain your reasoning illustrating it with a “Internuclear Distances vs Time” plot for a relevant trajectory.
Due to the symmetry between the H and the \chem{H_2} molecule, and the fact that the interaction is happening at 180º, we know that must equal for any point on the potential for the transition state.
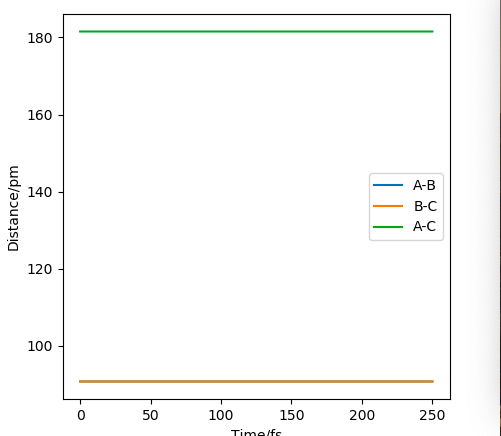
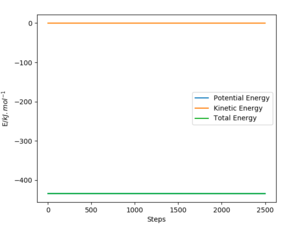
If we were to further set the momenta to zero for all 3 particles on the transition state, we know that the internuclear distances between the atoms will not change. This must hold true, as all the derivatives of the potential are zero; there are no forces acting on the particles. As an equilibrium point, a plot of internuclear distances vs time will be constant for the transition state.
This was found for = 90.775 pm. The internuclear distances vs time plot confirms this; it is shown below.
Question 3: Comment on how the MEP and the trajectory you just calculated differ.
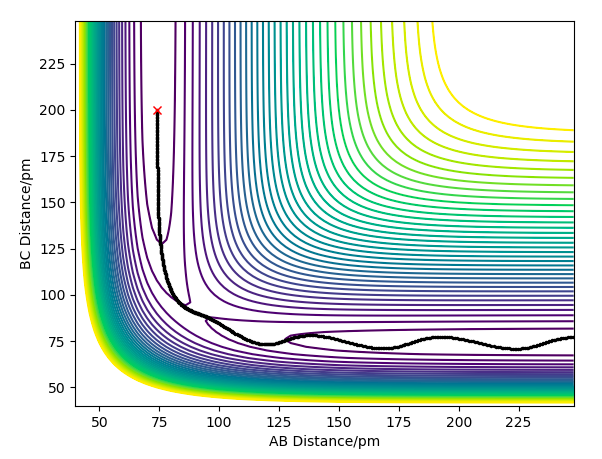
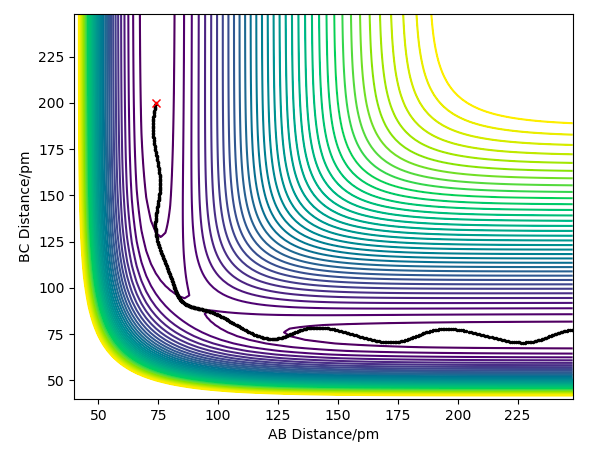
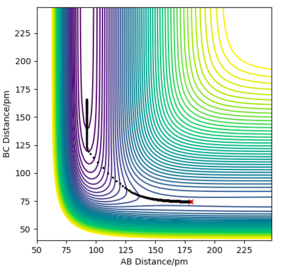
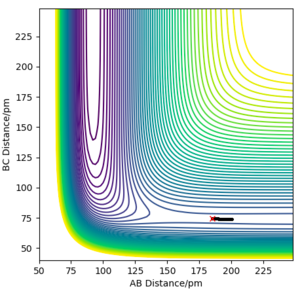
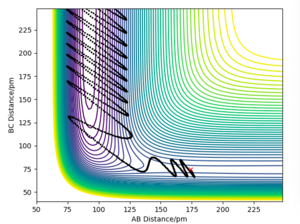
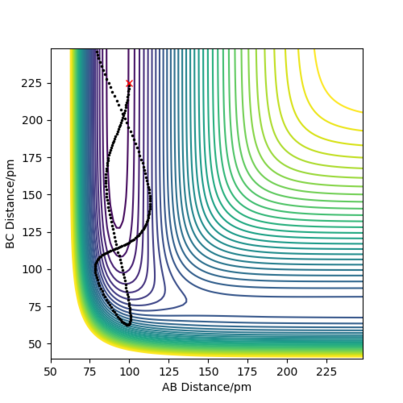
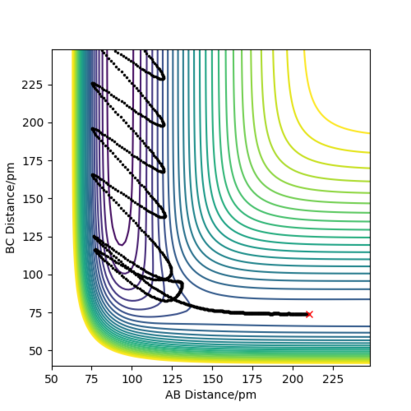
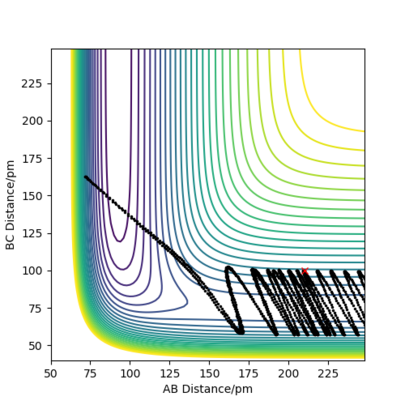
The Minimum Energy Path (MEP) plots the reaction path assuming that the particles have negligible intertial motion. It therefore ignores the vibration potential of the system, and hence only runs along the "valley" of the PES, rather than oscillating along the potential well as it does in the dynamical calculation. This makes sense; it would be the lowest energy path, but ignores the momenta of the particles at each point, and how it changes.
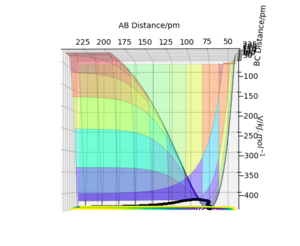
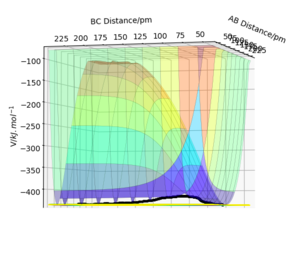
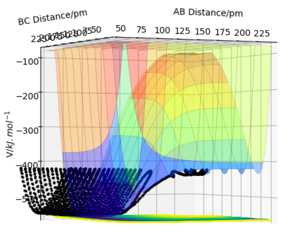
The differences are shown in the following two images; both of them tend towards a complete reaction from the transition state as predicted, but the dynamics plot shows oscillation along the reaction path in the y-axis as it moves along.
 |
 |
Furthermore, the MEP reaction path finishes at 193.1pm as the AB distance and 74 pm as the BC distance, whereas for the dynamical plot, the reaction path will continue after this. This makes intuitive physical sense; both have opposite velocities so will tend away from each other. However, for MEP, with no inertial motion, this is discounted, so the particles cease motion at this point, as there is negligible difference in energy at this point.
Question 4: Complete the table above by adding the total energy, whether the trajectory is reactive or unreactive, and provide a plot of the trajectory and a small description for what happens along the trajectory. What can you conclude from the table?
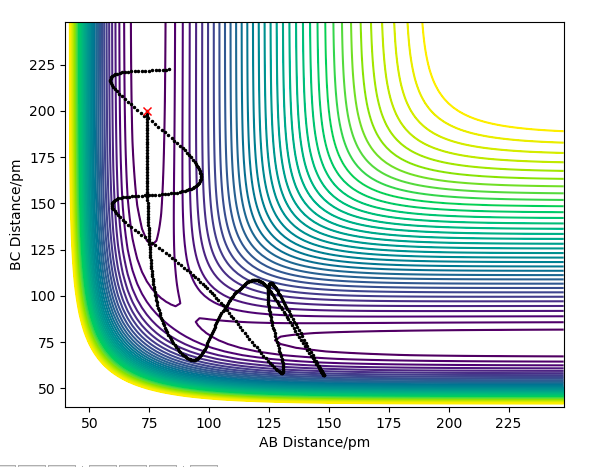
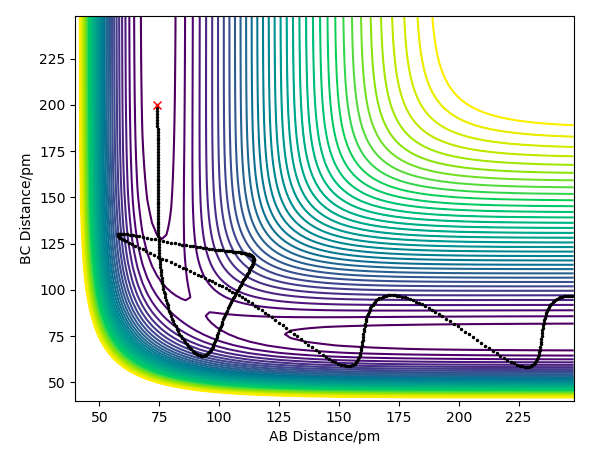
The following table assesses the plot for the initial positions r1 = 74 pm and r2 = 200 pm, with varying initial momenta.
Question 5: Given the results you have obtained, how will Transition State Theory predictions for reaction rate values compare with experimental values?
Transition state theory can be used to determine the rate of a reaction, but it relies on some substantial assumptions. These contribute to deviations from the results observed in the GUI, resulting in overestimations.
The primary reason for overestimation is due to a lack of accounting for recrossing the energy threshold. TST allows for a 'quasi-equilibrium' - it allows molecules to reach the transition state from the side of both the reactants and products, but once the transition state has been crossed, it will be a successful reaction, regardless if the momentum would actually cause recrossing of the transition state. This is evidently not a realistic assumption, as we have seen in the previous section 1.4 ; e.g. the reaction pathway for the momenta p1 = -5.1 and p2 = -10.1, where despite the initial crossing of the barrier and consequent overcoming of the energy barrier, the system is not reactive.
This especially holds true for molecules with high momentum; so TST will deviate from experimental results at high temperatures. It should only be used for low temperature scenarios.
As a result, TST will incorrectly predict the number of successful reactions; it will give a higher prediction than reality, thus also overestimating the reaction rate.
Furthermore, it also assumes atoms obey the laws of classical mechanics using the Born-Oppenheimer approximation, and that each reaction only has 1 saddle point and 1 transition state. These assumptions will likely not hold true for other systems, where reactions will have more than one transition states. Quantum effects such as tunnelling of the atoms would also lead to different numbers than predicted from TST; more successful reactions would occur than TST would account for, as not all the molecules have to overcome the activation barrier to cross it.
Exercise 2: F-H-H system
Question 1: By inspecting the potential energy surfaces, classify the F + H2 and H + HF reactions according to their energetics (endothermic or exothermic). How does this relate to the bond strength of the chemical species involved?
Let's set the initial position as = , where is F-H, and is H-H.
If we run a MEP plot from this position, the particle will end up at the lower energy state, regardless of the initial reactants or products.
We can see in the image below, the minimum energy path is such that is minimised, and is maximised. With as F-H, this implies that the lower energy state is H + H-F.
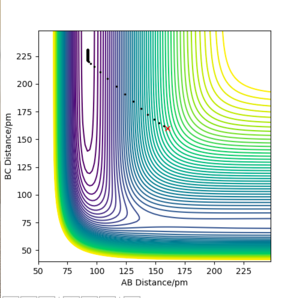
As a result, we can classify the F + H2 --> H + HF reaction as exothermic, as it is progressing from a higher energy state to a lower energy state.
H + HF ---> F + H2 would therefore be an endothermic process; it would require an input of energy to get this product.
This order of potential energies suggests that the bond strength between F-H is greater than for H2.
This is in agreement with experimental results. The strength of the H-F bond ( ) is greater than the H-H ( ) bond; more energy is required to break the H-F bond than is gained forming an H-H bond.
Question 2: Locate the approximate position of the transition state.
As before, the transition state will be the saddle point on the surface plot. However, as the system is no longer symmetric as before, the transition state is no longer at the point where = .
Hammond's postulate suggests that the transition state will be closer to the higher energy system in the reaction. We know that this is the case for F + H2, so the transition state must be such that the bond distance for F-H is greater than for H2.
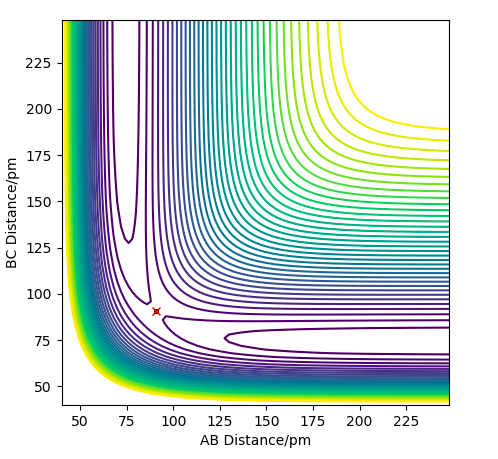
Knowing this, we can surmise that if AB is F-H and BC is H2, the distances at the transition state are: AB =184 pm and BC = 74.4 pm, with momenta = 0. This complies with the logic that the reaction where FH is the product is exothermic, as this is supported by Hammond's postulate. We once again know that the internuclear distance will not change at this position with respect to time, as the derivative of the potential V is zero. As force is the negative derivative of the potential, this implies that the transition state has no force components if initial momenta = 0, so no movement will occur at this point.
 |
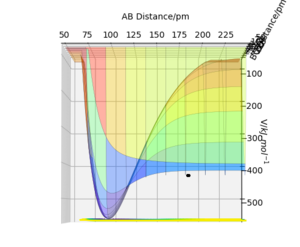 |
We can once again, further confirm that this is the saddle point by using the same point that the forces along AB and BC at this point are both zero.
Question 3: Report the activation energy for both reactions.
To find the activation energies of each product F-H and H2 (2 mutually exclusive scenarios), we simply need to find the difference between the transition state energy and the energy of the products. This can be calculated for the reaction only (excluding vibration) by using MEP to identify the shortest route.
Due to the asymmetry of the atoms, we have 2 activation energies.
Starting from the where AB =184 pm and BC = 74.4 pm, with a perturbation of ± 2 pm in the AB axis, and a step count of 2500, we get these MEP results.
The plots above show the activation energy for the enothermic formation of the product F + H2 . The plots below show the activation energy for the exothermic formation of the products F-H + H.
| Product | Energy of Transition State () | Energy of product () | ΔE ( |
|---|---|---|---|
| F-H + H | -433.991 | -435.271 | 1.28 |
| F + H2 | -433.979 | -556.895 | 122.92 |
This is because we know that the energy of the transition state is the maximum energy state on the reaction path, and doesn't consider oscillations along the potential well; so we can just use the MEP.
These results are consistent with our understanding of the system, and the contour plot; it is an extremely early TS for the exothermic formation of HF + H, so the activation energy for this reaction is extremely low compared to the reverse, endothermic process. This can be further shown by the contour plot; the difference in energy is shown to be almost negligible as it is along the same contour line.
Question 4: In light of the fact that energy is conserved, discuss the mechanism of release of the reaction energy. Explain how this could be confirmed experimentally.
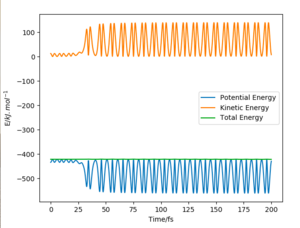
With the exothermic reaction , we will observe a significant release of energy. In this scenario, we can confirm that potential energy is converted to kinetic energy, as is seen in the plots below.
These plots use the initial conditions: FH = 174 pm with p = -1 g.mol-1.pm.fs-1, HH = 74 pm with p = -4 g.mol-1.pm.fs-1, and 2000 steps. This successfully reacts to give the exothermic reaction defined above.
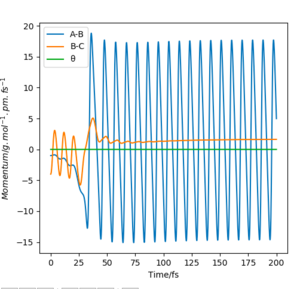
It is observed in the momenta vs time plot that a vibrating hydrogen molecule initially approaches the F atom. There are two bounces and recrossings, as observed in the animation, and then the molecule HF is formed. This has a lot of vibrational energy, as is seen in the PES surface plot, whereas the leaving H atom cannot vibrate as it is an individual atom. Therefore, we see that the released energy from the exothermic reaction is realised in vibrations of the newly formed molecule. The energy conversion from potential to kinetic is also shown in the energy vs time plot, where the dynamical relationship is shown.
This would correspond to an increase in temperature with heat being given off in the reaction, and can be observed by using IR spectroscopy, or with calorimetry methods (specically bomb calorimetry). In the IR, overtones would be observed, corresponding to vibrational excitation at higher energy levels, and translational motion would also be observed, as is shown in the contour plot.
Question 5: Discuss how the distribution of energy between different modes (translation and vibration) affect the efficiency of the reaction, and how this is influenced by the position of the transition state.
For the reaction of HF + H -> H2 + F, a higher vibrational energy of the HF molecule is required, as stated by polyani's rules. This is due to the relatively late transition state of the endothermic reaction. Similarly for the reverse reaction, very little vibrational energy is required and only a slight amount of translational energy is required due to the low activation energy of the exothermic reaction.
Polanyi's rules empirically state that in an early transition state, translational energy is more useful than vibrational energy with regards to the generation of a successful reaction. The converse argument applies with a late transition state. These only hold true when there is enough energy to overcome the activation energy, and favourable conditions are present.
This was largely observed for the endothermic reaction of HF + H -> H2 + F (late transition state); a higher vibrational energy resulted in more readily complete reaction. This also held true for the opposite case. These are shown in the plots below.

