MRD:01340064
This report has been plagiarised.
Exercise 1
On a potential energy surface diagram, how is the transition state mathematically defined? How can the transition state be identified, and how can it be distinguished from a local minimum of the potential energy surface?
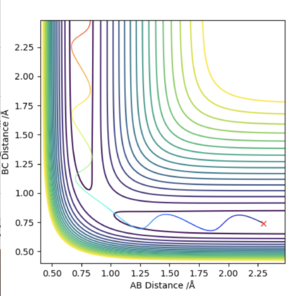


H1H2 = 0.74 Å, momentum = 0 and H2H3 = 2.30 Å, momentum = -2.7.
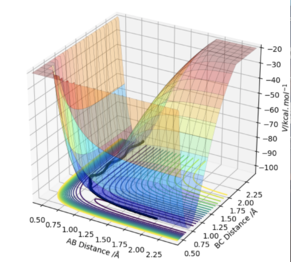
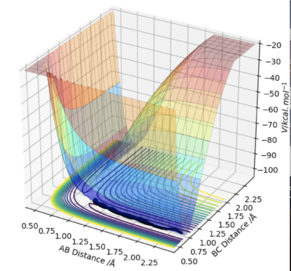
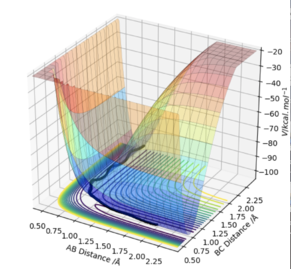
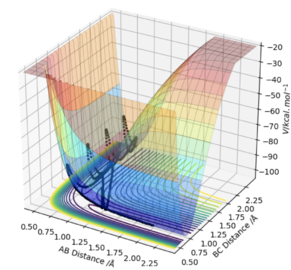
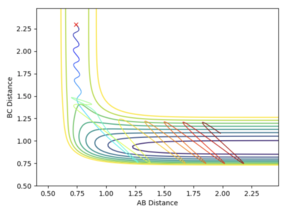
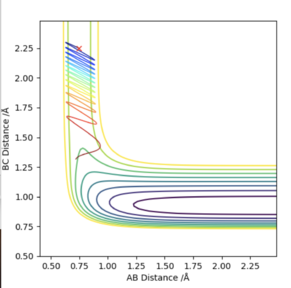
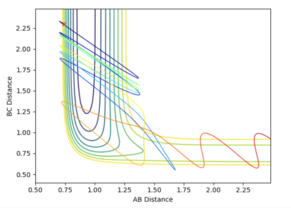
At a transition state or a minimum, the first derivative of the potential energy with respect to each distance will give a value of zero. To determine whether the point is a minimum or a transition state, the second partial derivative of the potential energy with respect to r1 and r2 must be taken (orthogonal axes). If the result of this gives two positive values, the point is a minimum, shown in Figure 3. If the result of this gives one negative value and one positive value, the point is a saddle point and is therefore the transition state (Figure 2).
At the transition state, if you change the geometry by a small amount in the direction of the products it will roll towards the products. The same thing would happen for for the reactants. Therefore another method of locating the transition state would be to start trajectories near it and see whether they roll to the reactants or products.
Report your best estimate of the transition state position (rts) and explain your reasoning illustrating it with a “Internuclear Distances vs Time” plot for a relevant trajectory.
A plot of Intermnuclear Distance vs Time can be used to fine the internuclear distance in the transition state, when both momenta are set to zero. Different values of internuclear distance can be tested until no oscillation is observed on the plot. The trajectory will never "roll" from this position to either the reactants or products as there is no gradient orthogonal to this point. The best estimate of the transition state position was determined to be 0.9076 Å.

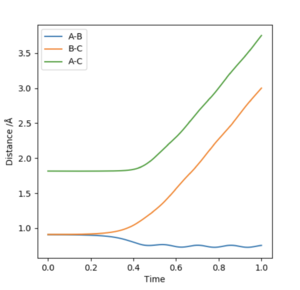
The first figure shows the internuclear distances vs time plot when r1=r2=0.908. The second figure shows the system rolling towards the reactants after a minor geometry change of 0.001 A towards the reactants.
Comment on how the mep and the trajectory you just calculated differ.
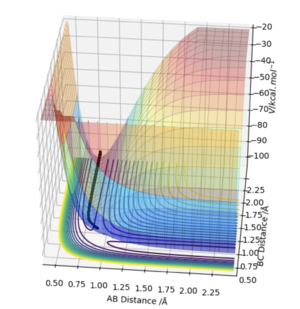
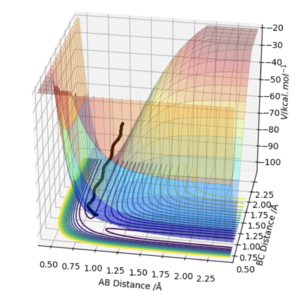
The MEP is the minimum energy pathway of the trajectory and relates to infinitely slow motion of the species. The MEP follows the valley floor to H1+ H2-H3 without any indication of vibration in the molecule, the dynamic trajectory shows a more realistic account of the motion of the atoms as it shows the vibration in the molecule. The MEP also does not give a realistic account of the motion because the atoms have a mass and so their motion will be inertial.
Complete the table by adding the total energy, whether the trajectory is reactive or unreactive, and provide a plot of the trajectory and a small description for what happens along the trajectory. What can you conclude from the table?
Not all trajectories starting with the same positions but with higher values of momenta are reactive.
State what are the main assumptions of Transition State Theory. Given the results you have obtained, how will Transition State Theory predictions for reaction rate values compare with experimental values?
In Transition State Theory, the Born-Oppenheimer approximation is used to separate the motion of the nuclei and electrons in a reaction, as nuclei are significantly heavier than electrons. The atoms can therefore be treated classically with Newton's Laws of Motion as a result. This approximation ignores quantisation of vibrations and tunnelling. The transition state is also assumed to obey a Boltzmann distribution, with the species colliding with enough energy for a successful reaction. The theory also states that the transition states are in constant equilibrium with the reactants and can convert into products. The transition state is seen as a saddle point of the Potential Energy Surface plot. The trajectory however will not always pass through the lowest energy saddle point as sometimes higher energy vibrational modes can be populated.
The first three systems studied are likely to give predicted rates of reaction similar to experimental values, as the reactants either overcome the barrier and form the products or do not possess enough energy. The final two systems however are likely to deviate from the predicted rates due to the systems showing barrier recrossing, which transition state theory does not allow.
EXERCISE 2
By inspecting the potential energy surfaces, classify the F + H2 and H + HF reactions according to their energetics (endothermic or exothermic). How does this relate to the bond strength of the chemical species involved?
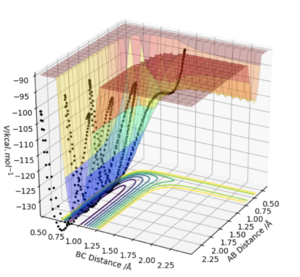
It can be seen that the reaction of H2 + F is exothermic as the products are lower in energy than the reactants in the surface plot. It can also therefore be seen that the reverse reaction of HF + H is endothermic. This is due to the fact that the HF bond is much stronger than the HH bond, because of the difference in electronegativity of H and F. The HF bond is has an ionic contribution which makes it stronger, causing more energy to be released when HF forms.
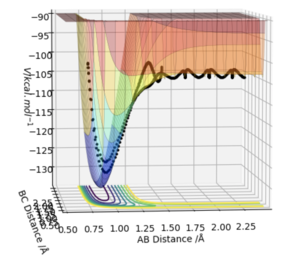
Locate the approximate position of the transition state.
Looking at the Internuclear Distance vs Time plot for the H2 + F trajectory, an approximate time frame for the transition state can be observed where the lines BC and AB overlap (around 0.7 seconds). To find an accurate position of the transition state, the momenta were set to zero and the distances BC and AB adjusted until no oscillation was observed in either line, which would correspond to the activated complex at the top of the transition state.
This was found to occur with a HH bond distance of 0.745 Å and a HF bond distance of 1.811 Å


Report the activation energy for both reactions.
An MEP calculation with one of the distances slightly adjusted from the transition state was determined. The trajectory therefore rolled to the valley floor of either the reactants or products. The activation energy was then found to be the difference in potential energy on an Energy vs Time graph. H2 + F --> HF + H Activation energy = 0.200 kcal/mol HF + H --> H2 + F Activation energy = 29.969 kcal/mol
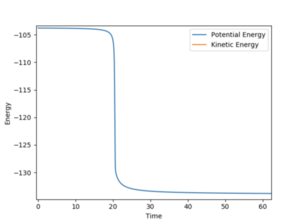

In light of the fact that energy is conserved, discuss the mechanism of release of the reaction energy. Explain how this could be confirmed experimentally.
A reactive trajectory for the F + H2 was identified with the initial conditions of 0.79 Å HH, momentum= 0.78 and 1.8 Å HF, momentum=-0.5.
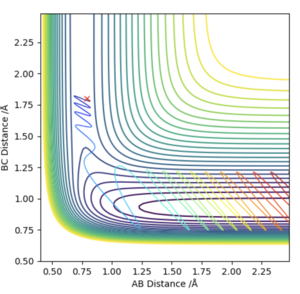

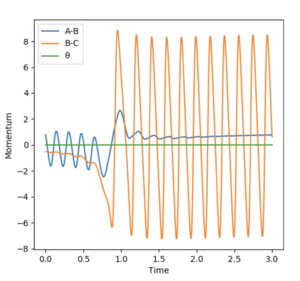
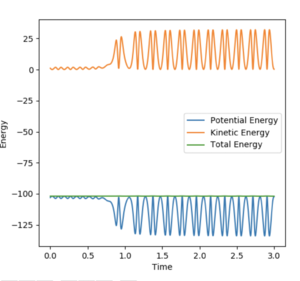
The contour plot shows that the product HF continues to oscillate once it forms as it possesses vibrational energy. The Energy vs Time graph shows that energy is conserved during the reaction as the kinetic energy is at maximum when the potential energy is minimum and the opposite is also true. The vibrationally excited product HF will release its energy as heat, colliding with other molecules of gas. This could be confirmed experimentally by use of a gas-phase FTIR spectrum of the product which would show the vibrational exciited state relax to the ground state, releasing a photon corresponding to the different in electronic states.
Discuss how the distribution of energy between different modes (translation and vibration) affect the efficiency of the reaction, and how this is influenced by the position of the transition state.
| p(HH) Vibrational Energy | p(HF) Translational Energy | Plot |
|---|---|---|
| -0.5 | -2.0 |
|
| -2.8 | -0.5 |
| p(HH) Vibrational Energy | p(HF) Translational Energy | Plot |
|---|---|---|
| -6.7 | -0.4 | |
| -0.4 | -6.7 | 
|
The first table shows that an increased amount translational energy with respect to the vibrational energy acts to drive the exothermic reaction to HF, with an early transition state. An increased amount of vibrational energy however does not lead to a reactive trajectory. The second table shows that the opposite is true for the reverse reaction, with excess vibrational energy driving the endothermic reaction to H2 , with a late transition state, but no reactive trajectory for an excess of translational energy. These results show Polyanyi's empirical rules.

