MRD:BPW16Y2
Exercise 1 - HHH System
Distinguishing Between a Minimum and Transition State on a Potential Energy Surface
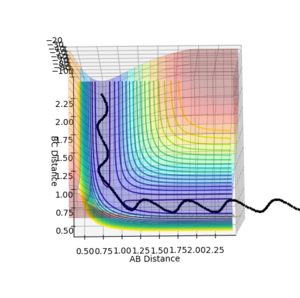
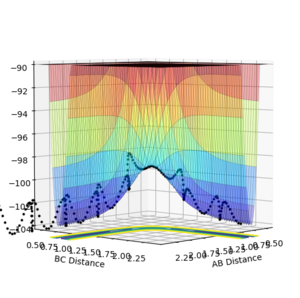
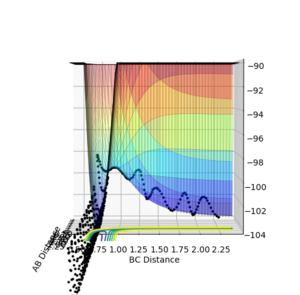
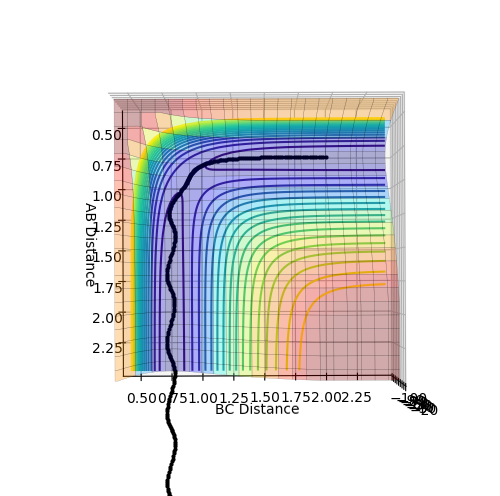
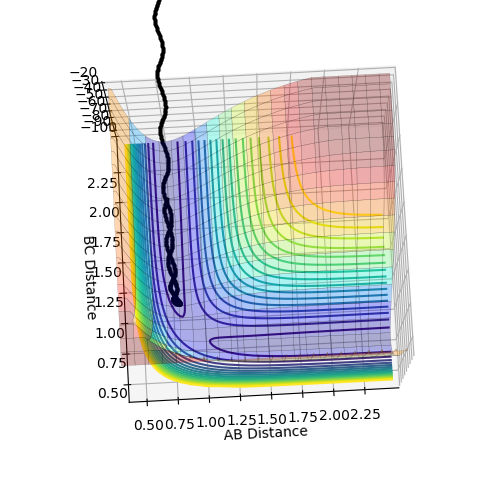
These plots were obtained with the parameters of H1H2 distance = 0.74 Å, momentum = 0, H2H3 distance = 2.30 Å, momentum = -2.7.
At a transition state or a mimimum, the first derivative of the potential energy with respect to each distance (r1 and r2) will be equal to zero. To determine whether the point is a minimum or a transition state, the second derivative of the potential energy with respect to r1 and r2 must be taken (these are orthogonal axes). If the result of this gives two positive values, the point is a minimum (figure 3), while if the result of this gives one negative value and one positive value, the point is a local maximum, hence the transition state (figure 2).
(You need to clarify, that here we are taking the second partial derivative. Also, the transition state is not a local maximum, but rather a saddle point! Fjs113 (talk) 17:41, 28 May 2018 (BST))
Determining the Transition State Trajectory Distance
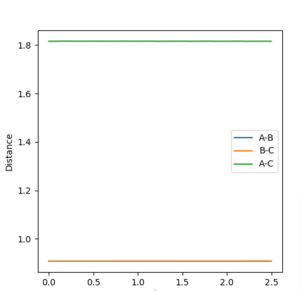
The internuclear distance in the transition state can be determined through a plot of internuclear distance vs time, where we set both momenta to zero. The transition state can then be found my testing different values of the internuclear distances until there is no oscillation observed on the plot. This corresponds to a sphere sitting on the top of the maximum, and having no momentum, so it just 'sits there'. There would be no gradient in the direction orthogonal to the maximum point, hence the trajectory will just oscillate on the maximum point and never 'roll off'. The value determined was 0.9076 Å, to 4 d.p, as can be seen from figure 4.
Comparing MEP and Dynamics Calculation Methods
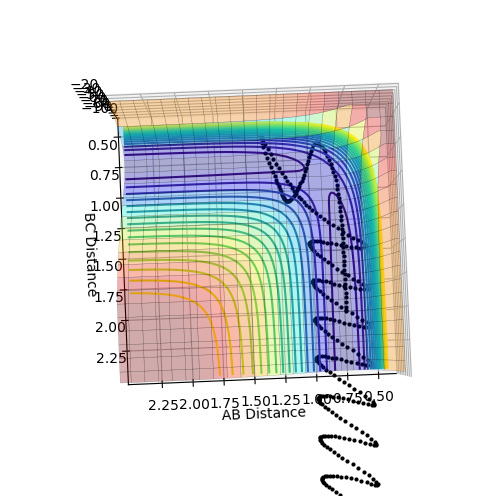
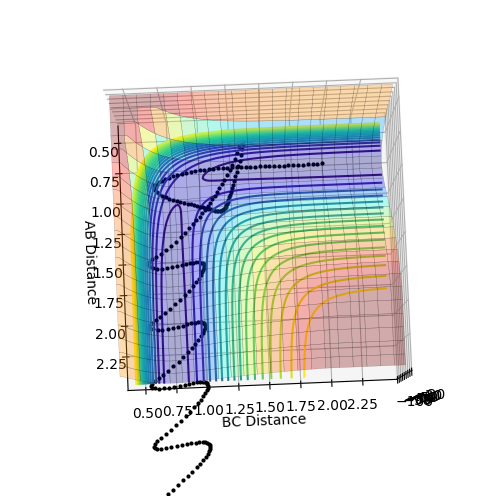
Figures 5 and 6 show the PES for when r1 = 0.9176 Å and r2 = 0.9076 Å (i.e. slightly displaced from each other).
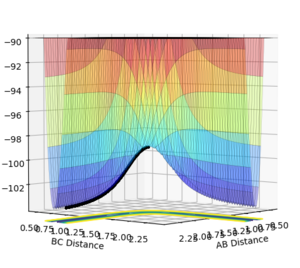
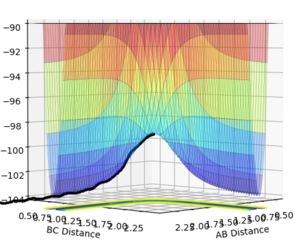
MEP is the minimum energy pathway for the trajectory. It corresponds to infinitely slow motion of the species. However, the MEP does not give a realistic account of the motion of the atoms during the reaction since the atoms have a mass, and hence their motion will be inertial.
The MEP plot shows the pathway for the species coming together if we treat them as two solid entities. The dynamic plot treats the system as a diatomic molecule and a single atom. Hence, as can be seen from the figures 5 and 6, the MEP plot does not show any oscillation, as there is no vibrational energy, but the dynamic plot shows oscillations and hence vibration energy of the diatomic.
Testing Different Reaction Trajectories to Determine Reactivity
Transition State Theory
In Transition State Theory, a reaction is described by considering the motion of atoms. The Born-Oppenheimer approximation is applied and the motion of the nuclei and electrons are separated, given that nuclei are much heavier than electrons. Following this, the motion of the atoms can be treated classically using Newton's laws of motion. This neglects the fact that vibrations are quantised or that tunneling can happen through quantum mechanics. Another assumption is that the transition states obey a Maxwell-Boltzmann distribution shape and that the species have to collide with enough energy for a reaction to be successful, i.e. to pass over the transition state barrier, however this is not always the case in reality due to quantum tunneling effects.
Transition state theory says that activated complexes exist in a type of equilibrium, quasi-equilibrium, with the reactants, and that these complexes can convert into products. By using rate equations such as the Arrhenius or Eyring equations, the rate of reaction can be found. The transition state will be a saddle point on the PES. The quasi-equilibrium point means that reactants are in equilibrium with the activated complex, but the activated complex is not in equilibrium with the products, i.e. once the transition state has been traversed, the products can not reform the reactants. Another downfall of transition state theory is that, especially at higher temperatures, the trajectory does not always pass through the lowest energy saddle point in the PES, as higher energy vibrational modes are populated.
For systems 1 to 3 studied above, the predicted reaction rates through transition state theory are likely to match well with experimental values, as either the reactants simply cross the transition state barrier to form products, or do not have enough energy to react at all. For systems 4 and 5 however, the rates are likely to differ from predicted values as these systems show barrier-recrossing, where once products have formed, they actually cross back over the transition state barrier and reform the reactants, something that is not 'allowed' in transition state theory. The higher temperature idea could be seen through systems 4 and 5 having higher momenta than in 1 to 3. [1]
(Very good. Fjs113 (talk) 17:41, 28 May 2018 (BST))
Exercise 2 - FHH system
Classifying the Reaction Thermodynamics
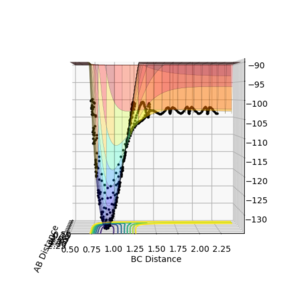
From figures 7 and 8 it can be seen that the reaction of H2 + F is exothermic as the products, HF + F (with the diatomic distance of HF labelled as BC on the plot) is lower in energy than the reactant species, H2 and F. It is therefore the case that the reverse reaction, HF + H is an endothermic. This can be related to the relative bond strengths: clearly the HF bond is much stronger than an H-H bond. This is due to the difference in electronegativity in HF, creating an ionic contribution to the bond, making it stronger, hence energy is released when HF forms from H2 and F.
The parameters used were H1H2 (diatomic) distance = 0.74 Å, momentum = 0, H2F distance = 2.30 Å, momentum = -2.7.

Determining the Transition State
To determine the transition state, I first looked at the internuclear distance vs time plot (figure 9) from the trajectory plotted in figures 7 and 8. The transition state will be in the region where the AB and BC lines cross over, i.e. between 0.7 and 0.8 seconds approximately. To determine the transition state accurately, The momenta for each species, H2 and F, were set to be zero, and the distances AB and BC varied until there was no oscillation observed in either line, corresponding to the H-H-F activated complex at the very top of the peak of the transition state, and not 'rolling' to either reactants or products. This can be seen in figure 10, where the HH (AB) distance is 0.745 Å and the HF (BC) distance is 1.811 Å.


Determining the Activation Energy

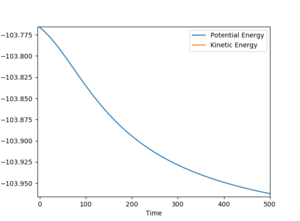
To find the activation energy, I used an MEP calculation and displaced one of the distances slightly from the transition state distances determined previously. This meant that, depending on which distance was changed, the trajectory would fall from the transition state maximum and simply roll to the valley floor of either the reactants or products. The activation energy was then calculated from the difference in potential energy on an energy vs time graph.
HF + H --> H2 + F Activation energy = 29.969 kcal/mol
H2 + F --> HF + H Activation energy = 0.200 kcal/mol
Reaction Dynamics
A productive, reactive trajectory, where H2 + F turn into HF + F products was found with the initial conditions of HH(0.79 Å, momentum = 0.78), HF(1.8 Å, momentum = -0.5).
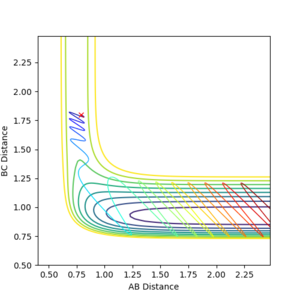
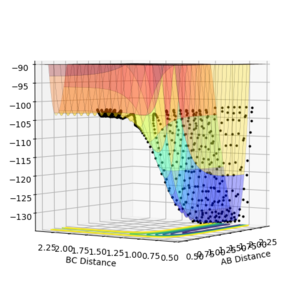


It can be seen from the contour plot, that the product diatomic, HF, is formed in a vibrationally excited state, and continues to oscillate, possessing vibrational energy. From the energy vs time, graph it can be seen that the conservation of energy principle is obeyed, as when the potential energy is at a maximum in an oscillation, the kinetic energy is at a minimum, and vice versa. The vibrationally excited HF molecule will release its energy to the surrounds as heat most likely, colliding with other gas molecules. A way to experimentally test this prediction would be to obtain a gas-phase FTIR spectrum of the HF produced, and this should show relaxation from the vibrational excited state to the ground state. A photon would be emitted corresponding to the difference in energy between the first excited and ground electronic states.
Polanyi's Empirical Rules
Polanyi's empirical rules state that vibrational energy is much more efficient at activating a late transition state reaction than translational energy. The opposite is true for an early transition state, where translational energy is more effective than vibrational energy. In order to test these rules, different initial momenta were set up. The H2 + F --> HF + F reaction is exothermic, as seen in figure 7, and hence through the Hammond postulate will have an early transition state, with the transition state structure resembling the reactants. Therefore, the reaction should be initiated more effectively with translational energy, rather than vibrational energy. The opposite is true for the HF + H --> H2 + F reaction, which is endothermic and hence will have a late transition state, and being initiated more effectively with vibrational energy.The quick brown fox jumps over the lazy dog. (Not sure if meant to be here or not? ;) Fjs113 (talk) 17:41, 28 May 2018 (BST))
[2]
| p(HH) (Vibrational Energy) | p(HF) (Translational Energy) | Plot |
|---|---|---|
| -2.8 | -0.5 | 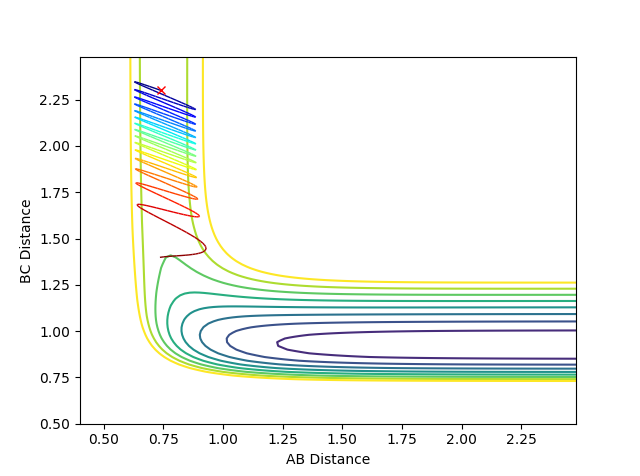
|
| -0.5 | -2.0 | 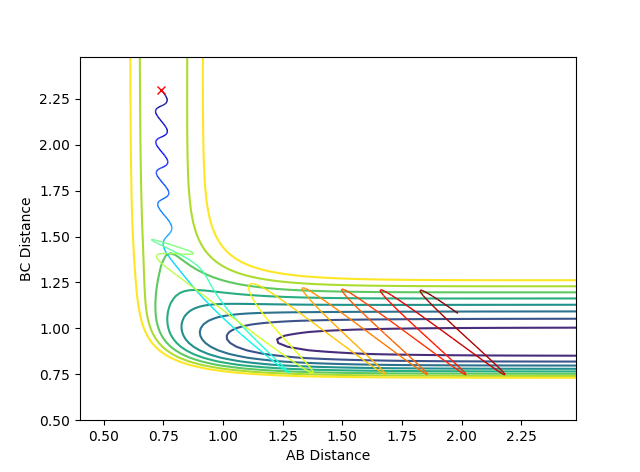
|
| p(HF) (Vibrational Energy) | p(HH) (Translational Energy) | Plot |
|---|---|---|
| -0.4 | -6.7 | 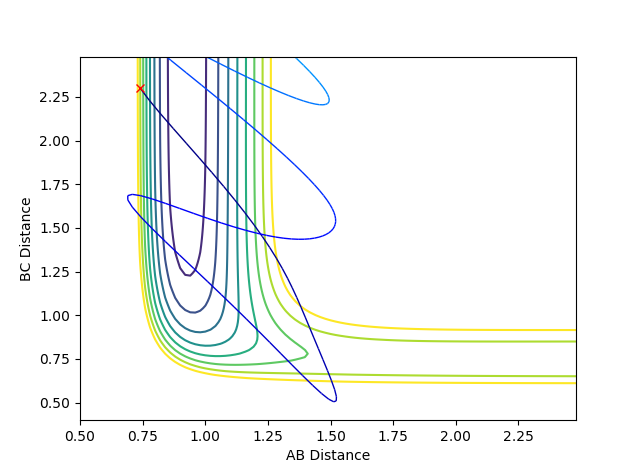
|
| -6.7 | -0.4 | 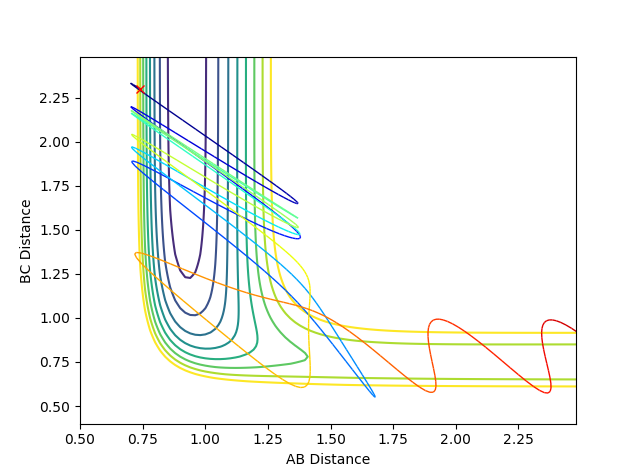
|
It can be seen from table 2 that a greater weighting of translational energy rather than vibrational energy drives the exothermic, H2 + F --> HF + F, reaction, with an early transition state, forming the products after successfully passing over the transition state barrier. However, a greater weighting of vibrational energy does not lead to a productive reaction. It can be seen from table 3 that the opposite is true, with an excess of vibrational energy driving the endothermic reaction, with a late transition state, forming products of H2 and F, whereas an excess of translational energy does not give a reactive, productive trajectory. These results are in agreement with Polanyi's empirical rules.
References
- ↑ https://en.wikipedia.org/wiki/Transition_state_theory, accessed May 2018
- ↑ Science 21 Oct 2011: Vol. 334, Issue 6054, pp. 343-346, DOI: 10.1126/science.1208514

