Inorganic lab sb1016
Computational Analysis of Molecules and their properties
BH3
BH3 molecule was analysed using B3LYP/6-31G(d,p) method/basis set and the following parameters were obtained.
| Optimized Bond Length | 119.99 |
| Optimized Bond Angle | 120.0 |
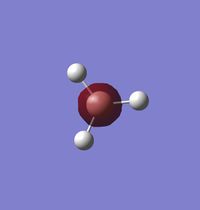
Optimised Borane Molecule |
The optimisation log file is linked here
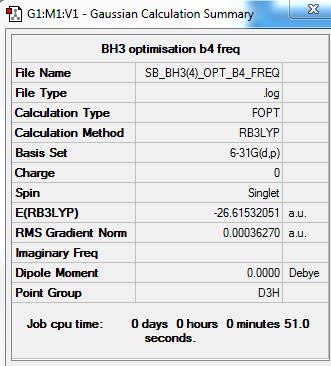
From the optimisation, the summary of the results are presented below:
From the table presented below, it can also be seen that the optimisation was successful as the results have converged.
Item               Value     Threshold  Converged?
 Maximum Force            0.000006     0.000450     YES
 RMS     Force            0.000004     0.000300     YES
 Maximum Displacement     0.000025     0.001800     YES
 RMS     Displacement     0.000016     0.001200     YES
Frequency Analysis for BH3:
The "zero" frequencies are within the required limits of -15 to +15.
Low frequencies ---   -0.9602   -0.9310   -0.0054    5.3142   11.5142   11.5542
Low frequencies --- 1162.9948 1213.1816 1213.1843
Frequency Log file of BH3 can be found here
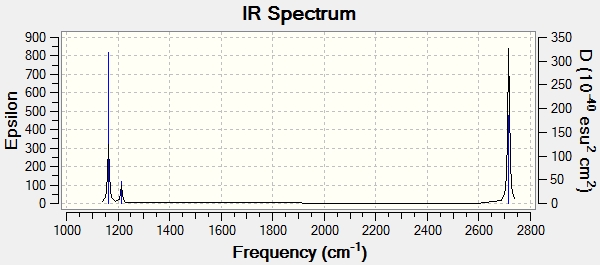
Vibrational Spectrum for BH3
| Wavelength(cm-1) | Intensity(arbitrary units) | Symmetry | IR peak | Type |
|---|---|---|---|---|
| 1162 | 317 | A1 | Active | Out of plane bend |
| 1213 | 46 | E | Active (Low intensity) | Asymmetric bend |
| 1213 | 46 | E | Active (Low intensity) | Bend |
| 2582 | 0 | A1 | Not-Active | Symmetric Stretch |
| 2715 | 185 | E | Active (Low intensity) | Asymmetric stretch |
| 2715 | 185 | E | Active (Low intensity) | Asymmetric stretch |
IR analysis of BH3
Even though there are 6 frequencies, only three are observed. The vibration at 2582 cm-1 is symmetric and therefore, is not observed in the IR spectrum. There are two pairs of vibrations at 1213 cm-1 and 2715 cm-1. The vibrations at each of these frequencies have the same intensity as well. As they are degenerate, they overlap and only one peak is observed for each pair. Due to these reasons, only 3 peaks are observed.
Smf115 (talk) 16:06, 28 May 2018 (BST)Good explanation of why only three peaks are visible mentioning both the degeneracy and IR inactivity of some of the peaks. However, although your frequency log file shows the molecule to be the correct point group (D3h) your symmetry assignments are incorrect and the IR intensities are also wrong. Both of these values can be read from your frequency log file after the low frequencies section.
Molecular Orbital Analysis of BH3
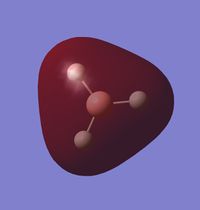
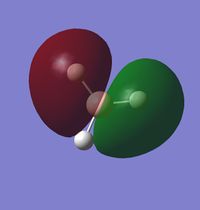
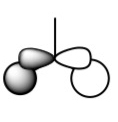
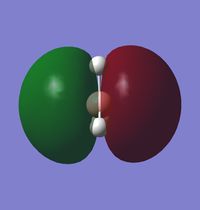
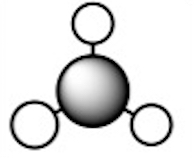
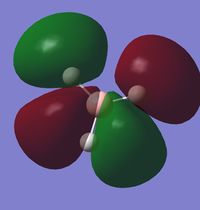
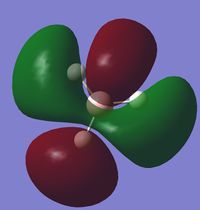
A qualitative MO diagram for BH3 is presented below.
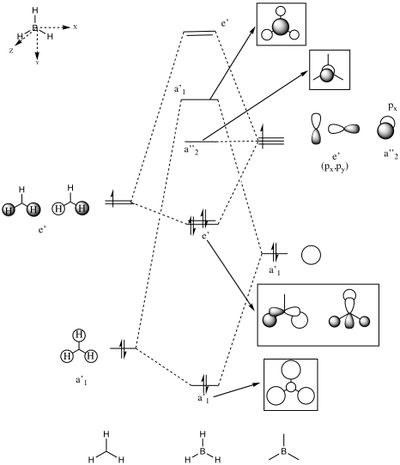
The high degree of similarity between the LCAOs and the real MOs suggest that the technique used for the optimization of BH3 molecule and its frequency analysis is accurate. It also marks the importance and accuracy of MO theory in predicting properties and structure of molecules. This also shows that MO theory can be used to predict the molecular orbitals of more complex systems as well.
Ammonia
NH3 molecule was analysed using B3LYP/6-31G(d,p) method/basis set.
Optimised Ammonia molecule |
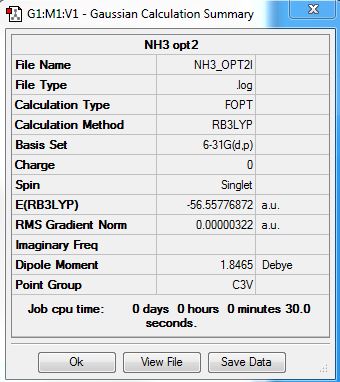
A summary of the results obtained is presented below:
The optimisation log file can be found here
Item               Value     Threshold  Converged?
 Maximum Force            0.000006     0.000450     YES
 RMS     Force            0.000004     0.000300     YES
 Maximum Displacement     0.000016     0.001800     YES
 RMS     Displacement     0.000011     0.001200     YES
The optimisation was successful as the parameters have converged.
Frequency analysis of NH3
Frequency log file can be found here
 Low frequencies ---   -8.5223   -8.4750   -0.0029    0.0335    0.1918   26.4067
 Low frequencies --- 1089.7616 1694.1862 1694.1866
The "zero" frequencies are a little above the allowed range. However, these frequencies are much lower than the first vibrational frequency of 1089 cm-1. Moreover, these high "zero" frequencies are due to the low computational level and basis set and can be corrected by performing the calculation with a better method.
Ammonia Borane
Ammonia Borane calculation were carried out with B3LYP/6-31G(d,p).
Optimised Molecule |
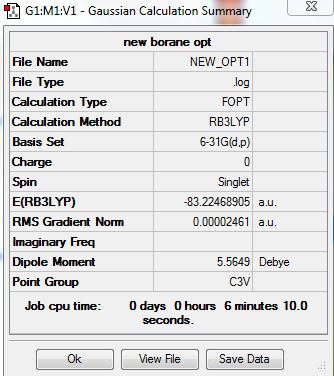
A summary of the optimisation is presented below:
The optimisation log file can be found here
Item               Value     Threshold  Converged?
 Maximum Force            0.000037     0.000450     YES
 RMS     Force            0.000019     0.000300     YES
 Maximum Displacement     0.000379     0.001800     YES
 RMS     Displacement     0.000173     0.001200     YES
It can be seen that the parameters have converged and that the optimisation is successful.
The frequency log file from the frequency analysis can also be found here
Low frequencies ---   -8.4231   -0.0746   -0.0066    0.2378   13.2406   13.2506
Low frequencies ---  262.9935  632.8261  639.1009
The "zero" frequencies are below the specified range.
Energy Analysis of N-B dative bond
The association energy of Ammonia and Borane was calculated using ΔE = E(NH3BH3)-[E(NH3)+E(BH3)].
| Energy | |
|---|---|
| NH3 | -56.557 a.u. |
| BH3 | -26.615 a.u. |
| NH3BH3 | -83.224 a.u. |
| Association | -0.0515 a.u. |
| Association | -135 ± 10 kJ/mol |
The N-B dative bond has medium strength as it is around one-third the strength of a normal N-B covalent bond and N-H covalent bond (~300kJ/mol).
BBr3
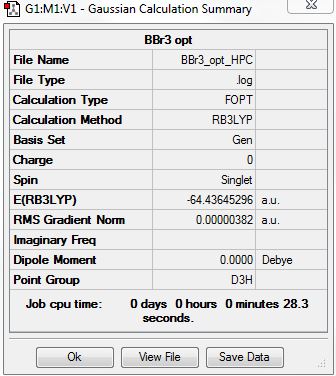
BBr3 was analysed using B3LYP/Gen method/basic set. The PPs used for Br atoms was LanL2DZ potential, whereas for B 6-31G(d,p) was used.
Optimised Molecule |
From the table presented below, it can be seen that all the parameters have converged and that the optimization was a success.
Item               Value     Threshold  Converged?
 Maximum Force            0.000008     0.000450     YES
 RMS     Force            0.000005     0.000300     YES
 Maximum Displacement     0.000036     0.001800     YES
 RMS     Displacement     0.000023     0.001200     YES
The optimization log file is linked here
the frequency log file is linked Click here
Low frequencies ---   -0.0137   -0.0064   -0.0046    2.4315    2.4315    4.8421
 Low frequencies ---  155.9631  155.9651  267.7052
The "zero" frequencies are within the specifies range and are lower than the first vibrational frequency.
Smf115 (talk) 16:13, 28 May 2018 (BST)Well presented structure informaition throughout and nice reporting of the computational method and basis set used, including the pseudopotential here.
Investigation of Ionic Liquids
N(CH3)4+
N(CH3)4+ was analysed using B3LYP/6-31G(d,p) method/baiss set.
Optimised Molecule |
The summary of the optimization is presented below:
The optimization log file can be found here
Item               Value     Threshold  Converged?
 Maximum Force            0.000067     0.000450     YES
 RMS     Force            0.000017     0.000300     YES
 Maximum Displacement     0.000146     0.001800     YES
 RMS     Displacement     0.000081     0.001200     YES
As all the parameters have converged, it can be concluded that the optimization was a success.
Low frequencies ---   -0.0005    0.0001    0.0007   35.2977   35.2977   35.2977
 Low frequencies ---  217.4078  316.4871  316.4871
However, the "zero" frequencies are above the allowed range of ±15 cm-1. This might be a result of low level basis set, relaxed convergence and poor integration criteria. Further calculations can be carried out with a better basis set.
The frequency log file can be found here
Valence Molecular Orbitals
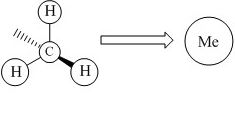
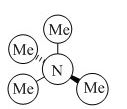
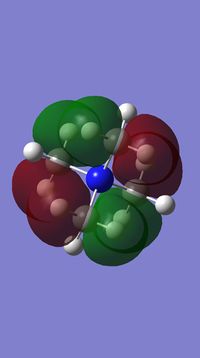
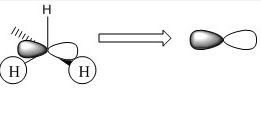
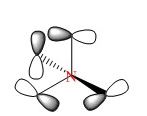
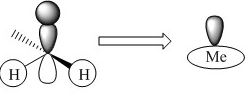
In N(CH3)4+, the MOs follow the symmetry of the point group which is Td. Therefore, for the nitrogen, there are triply degenerate "p" orbitals. This nature of the orbitals gives rise to highly symmetric MOs. However, for the representation below, these degenerate orbitals are just represented as normal p-orbitals on the nitrogen.
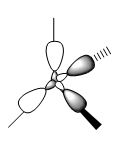
Smf115 (talk) 19:16, 1 June 2018 (BST)The FOs and LCAOs are clearly depicted and are correct for the MOs visualised, however, which MOs these are has not been labelled.
P(CH3)4+
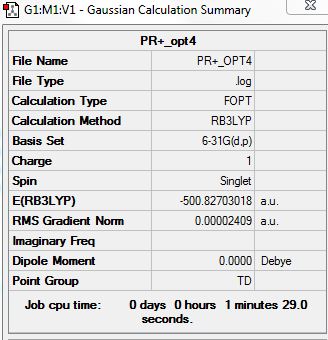
Even though phosphorous is in third period, it is not big enough to use the "Gen" method. Therefore, the calculations were carried out using the B3LYP/6-31G(d,p) method/basis set.
Optimised Molecule |
Summary of optimization:
As all the parameters have converged, it can be concluded that the optimization was a success.
Item               Value     Threshold  Converged?
 Maximum Force            0.000136     0.000450     YES
 RMS     Force            0.000036     0.000300     YES
 Maximum Displacement     0.000498     0.001800     YES
 RMS     Displacement     0.000348     0.001200     YES
The optimization log file is linked here
Low frequencies ---   -0.0023   -0.0017    0.0012   51.3471   51.3471   51.3471
 Low frequencies ---  186.8184  211.5721  211.5721
The "zero" frequency is once again, above the allowed range, as a result of the low level of the basis set used. However, it is smaller than the first vibrational frequency and this margin is adequate for this calculation. This margin can be reduced by using a better method and basis set.
Frequency Log file is linked here
The MOs for this cation will be similar to the N(CH3)4+ cation. However, the orbitals will be more diffuse. Further analysis can be carried out on these orbitals to compute the key differences in electron density distribution and reactivity.
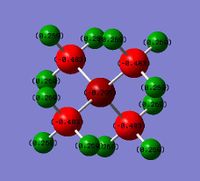
NBO Charge Analysis
For both the structures analysed above, according to the lewis structures, the formal charge is +1. This shows that in this structure, the central atom (N/P) donates an electron to one of the methyl groups and gains a formal +1 charge.
Smf115 (talk) 15:46, 1 June 2018 (BST)Good consideration and comparison of the charges on the main metal cation. However, the same colour range should have been used to highlight the charge distribution across the molecules and the charges on the Me groups and bond polarities should have also been discussed.

