
File:Optimisation graphs.jpg
Size of this preview: 492 × 599 pixels. Other resolution: 583 × 710 pixels.
Original file (583 × 710 pixels, file size: 124 KB, MIME type: image/jpeg)
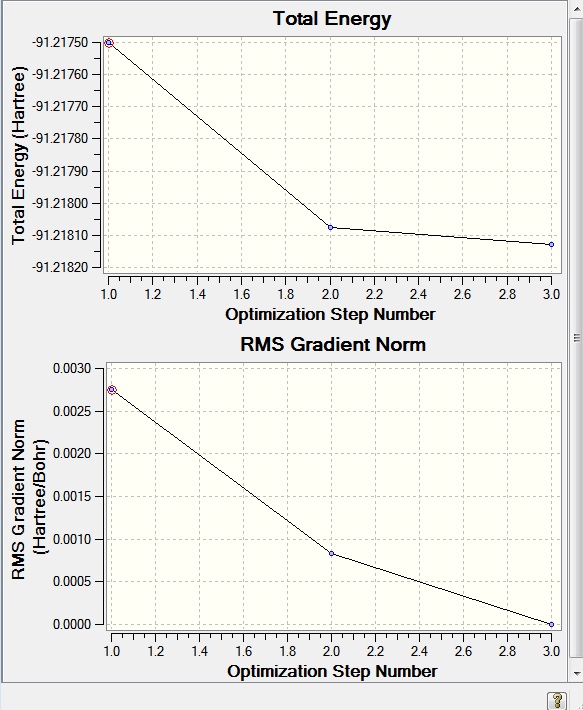
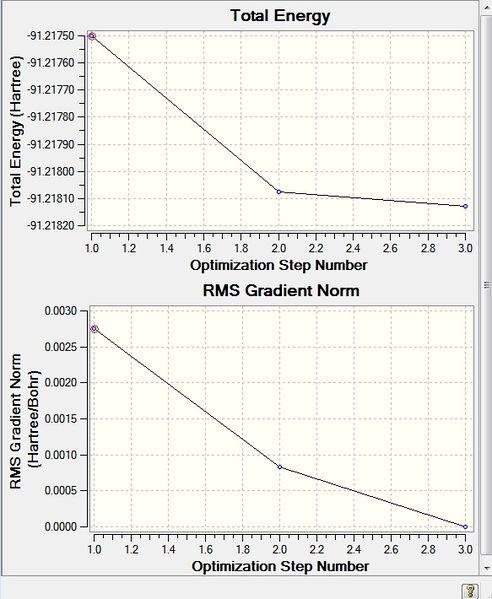
Fig. 2: The Total Energy and RMS graphs produced by the optimisation of BH3
File history
Click on a date/time to view the file as it appeared at that time.
| Date/Time | Thumbnail | Dimensions | User | Comment | |
|---|---|---|---|---|---|
| current | 16:41, 31 January 2012 | | 583 × 710 (124 KB) | Db2409 (talk | contribs) | |
| 15:44, 9 March 2011 |  | 636 × 517 (116 KB) | Tna08 (talk | contribs) | Fig. 2: The Total Energy and RMS graphs produced by the optimisation of BH<sub>3</sub> |
You cannot overwrite this file.
File usage
The following 2 pages use this file: