Mod.timarbab2
Tim Arbabzadah CID:00550893
Module 2 - Inorganic Computational Techniques
Modelling using computational chemistry can be extremely useful. It can be used as a way to test a reactions feasibility before having to carry out an experiment. It can also be used to predict various properties of a molecule before they are experimentally found. The main limitations of this technique are the approximations used, and the time taken. Most calculations end up having to be a compromise between accuracy and time.
Modelling a Molecule of BH3
Optimisation
The output file can be viewed here:Borane Optimisation

BH3 was creasted using Gausview. The bond lengths were then set to 1.5Å. This structure was then run through Gaussian to optimise it. The method used was B3LYP. This sets what approximations are made to solve the Schrödinger equation. The basis set was 3-21G. This will determine the accuracy, and is actually not very accurate. However, it allows the calculations to be made in a short amount of time. It can therefore be thought of as a compromise between time and accuracy. The type of calculation was an optimisation. This means the computer will try to find the optimum position, in terms of energy, for the nuclei.
In the output, i.e. the result of the calculations, was a picture of the molecule as well as other data. The molecule obtained can be seen in figure 1 on the right as a clickable Jmol. The actual text file was opened and shows that the job has been completed. This is shown by the "Optimization completed" written in the output file after showing various parameters had convereged. The B-H bond length was the same for all three B-H bonds, and was found to be 1.19Å (+/- 0.01Å). The H-B-H angle was also the same for all three. This was 120° (+/- 0.1°). This angle makes sense as Boron is trigonal planar.
There is alot of other information can be found in the output. The file type was Jog. The calculation type was FOPT, a free energy optimisation. The calculation method was, as expected, RB3LYP. The basis set was the same as that input, 3-21G. The last two sentences show that the parameters were correctly entered when setting up the calculation. The final energy was -26.46 a.u (+/- 0.07. a.u). The gradient was 2.85 x 10⁻⁶ a.u. The dipole moment was 0 Debye (+/- 0.01 Debye). The point group was D3h. The job time was 12 s.
Changes in the value for energy can be viewed in Gaussview. This is given in the form of two graphs. The energy of the molecule at each step is shown by the top graph. The bottom graph shows the RMS (root mean square) gradient of the top graph. The RMS gradient is found by differention, it is the first derivative of the equation of a line. For a straight line the gradient is the slope. For other types of line the gradient at a certain point is the rate of change at that point. It is the same as drawing a tangent to that point and finding the slope of said tangent, and that is actually a (non-numerical) method to finding the gradient.
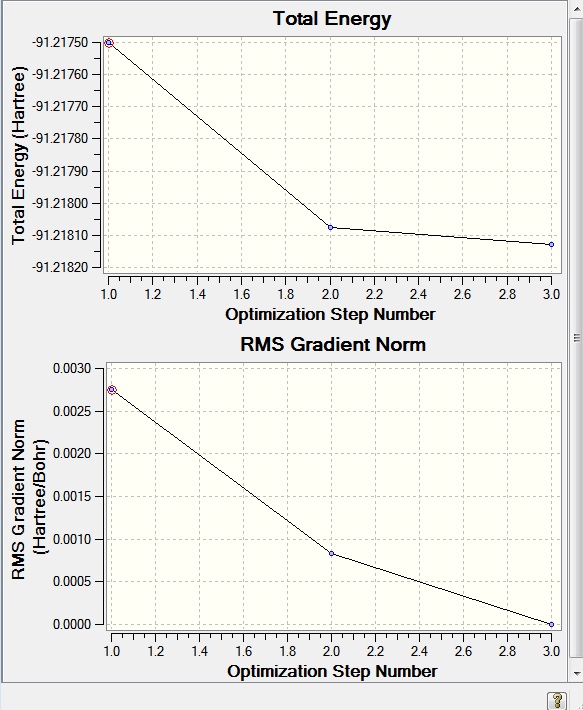
- Fig. 2: The Total Energy and RMS gradient graphs produced by the optimisation of BH3.
Here, as was expected, the last energy was the lowest value and had the lowest gradient. The RMS gradient is almost 0 for this last energy value. This means it is the lowest energy value and that the energy is not changing anymore and so the calculation is complete. The program scans the PES (potential energy surface) and will attempt to find the minimum. Once it has found that minimum it will stop. It judges the position is it at by looking at the RMS gradient. This is the equilibrium position.
Each of the individual steps in the calculation was visualised using Gaussview. These can then be taken as seperate screenshots. This was done and has been placed below as figure 3.
 |
 |
 |
 |
 |
- Fig. 3: The steps when optimising BH3.
The pictures in figure 3 do not all have bonds between the atoms where there should be. Steps 1-3 do not have bonds. The reason for this is that the program decides the position of bonds basaed on distance. Therefore, according to the program, there are no bonds as the two atoms are too far away from each other.
Molecular Orbital Analysis
The output file for the analysis can be found here: Molecular Orbital Analysis.
Using MO theory it is possible to construct an MO diagram of BH3.
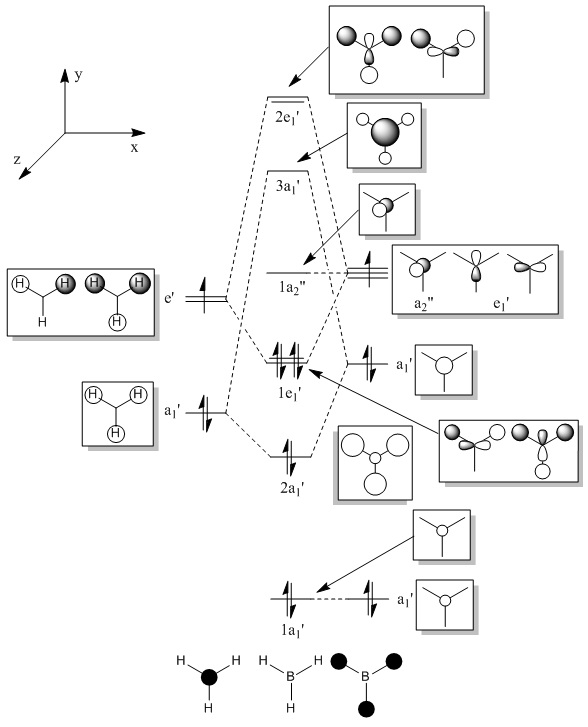
- Fig. 4: The MO diagram for BH3.
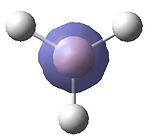
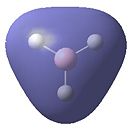
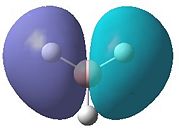
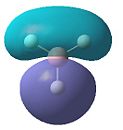
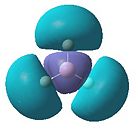
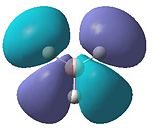
The molecular orbitals obtained from this analysis can also be calculated using the program Gaussian. The energy of the BH3 molecule was optimised as before. Then it was specially optimised and the orbitals were calculated. These MOs are shown in figure 5. They have, for most of them, been shown from the same angle as the MO diagram (figure 4) shows them. The exception to this is the LUMO (1a2"). This has been shown from a different angle as it better represents the orbital.
 |
 |
 |
 |
 |
 |
 |
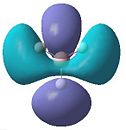 |
- Fig. 5: The MO's as calculated by Gaussian and visualised by Gaussview.
The diagrams in figure 5 can be compared to those produced in figure 4. The two sets of orbitals, for each individual energy level, match up in both shape and form. All of the orbitals match up in this way. This was to be expected, if the calculation was correctly made. If they had not matched up it would suggest a problem with the MO diagram or the calculation. The LUMO may be hard to see that it matches up. However if the 'cartoon' in the MO diagram was twisted to the same view as the image produced by Gaussview, the two would match up.
The orbitals calculated and visualised by the computer will not be perfect, due to the simplifications made in their calculation. They will, however, be a good approximation especially when the length of time taken to produce them is taken into account.
The calculation also calculates the energies of these orbitals. These have been tabulated as figure 6.
| Molecular Orbital | Energy/Hartrees |
|---|---|
| HOMO-3 | -6.766 |
| HOMO-2 | -0.515 |
| HOMO-1 | -0.352 |
| HOMO | -0.352 |
| LUMO | -0.068 |
| LUMO+1 | 0.165 |
| LUMO+2 | 0.179 |
| LUMO+3 | 0.179 |
- Fig. 6: The energies of the orbitals.
This table effectively shows where the orbitals are on the MO diagram. The first thing to note is the large gap between HOMO-3 (1a1') and HOMO-2 (2a1'). This is due to the former being from the 1s orbital of the Boron fragment, and the latter being from the 2s orbital or the Boron fragment (combined with the fragment of correct symmetry from the H3 fragment). The difference from the n = 1 to the n = 2 energy level is large compared to the difference between the 2s and 2p orbitals. In other words; the difference between 1s and 2s is much larger than the energy difference between 2s and 2p. Therefore the HOMO-3 has a much lower energy than HOMO-2. The energy levels also, correctly, showed the symmetry of the levels and the degeneracy.
Natural Bond Orbital Analysis
The output file for this analysis can be viewed here: Natural Bond Orbital Analysis
The output file for the MO analysis was opened in Gaussview. This was then used to analyse the molecule further. The analysis was a natural bond orbital analysis. This gave the charge distribution of the molecule and displays is both graphically and numerically.
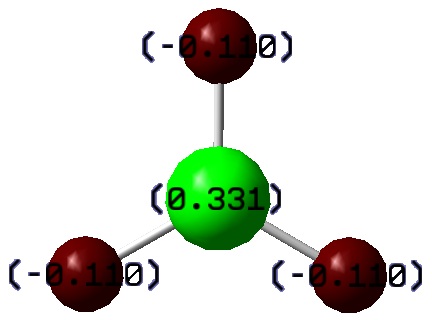
- Fig. 7: The charge distribution of BH3.
The red is indicating an area of negative charge. The green is indicating a build up of positive charge. The results produced make sense chemically. The boron atom should be positively charged. This explains why BH3 is a lewis acid. As figure 7 shows, this is indeed what happens here.
The black on dark red may make it hard to read the numbers. The numbers are: +0.331 for B and -0.110 for each H. It looks, at first sight, as though there is a slight error here, as they should add up to 0. Here they add up to 0.001. However, examining the output file clears up the confusion and shows that they do in fact acdd up to 0. It shows that it is actually the fact that the numbers have been rounded to 3 decimal places that causes the error. In other words, the full numbers given in the output file add up to 0.

- Fig. 8: A screen shot of the relevant part of the output file for the NBO analysis.
More information about the analysis can be obtained by viewing the output file, linked at the start of this section, for the analysis. The output file shows how much each atom in a bond contributes to the electron density. In this molecule it shows the relative contributions of boron and hydrogen in a B-H bond. The output file shows that all the bonds are equal, as they should be. The output file shows how much each atom in a bond contributes to the electron density. In this molecule it shows the relative contributions of boron and hydrogen in a B-H bond. The boron contributes 44.49% and the hydrogen contributes 55.51% to the overall electron density. All of the hydrogen’s contribution is from the 1s orbital. This was expected as this is the only orbital available. The contribution of the orbitals for the boron, on the other hand, is split between orbitals. One third of the contribution is from the 2s orbital, and two thirds of the contribution is from the 2p orbital. This splitting indicates that the boron is sp2 hybridised, as expected from the theory. The boron has 3 sp2 hybrid orbitals. Each one interacts with a 1s orbital on hydrogen. This would leave a vacant p orbital for the lone pair to reside in and give BH3 its Lewis acidity. This is, of course, not looking at the atom from a molecular orbital point of view (i.e. not studying it from the MO diagram). When comparing these results to the MO diagram above, figure 4, it is possible to see that is matches up. The B atom fragment bonds to the H3 fragment via two 2p orbitals and one 2s orbital. Again this is two thirds 2p and one third 2s contribution. Meanwhile, the H3 fragment bonds entirely via 1s orbitals.
There is more information that could potentially be gleaned from the output file. Under the heading 'Second Order Perturbation Theory Analysis of Fock Matrix in NBO Basis' would show any interactions from bonding NBOs into anti-bonding or non-bonding orbitals. In BH3 none of these interactions are present, as is shown by the log file.
Vibrational Analysis
The output file for this analysis can be found here: Vibrational Analysis
The first derivative of a function can be used to find the points where the function is either a minimum, a maximum or turning point. The function is one of these three options when the derivative is equal to zero. The problem is that it does not tell you which of these three posibilities it is. The second derivative will give this information. If the second derivative at the point is positive, the point is a minimum. If the second derivative is negative, the point is a maximum. This knowledge is important here as the frequency analysis is, in essence, the second derivative of the potential energy surfact. This means that if the frequencies produced by the analysis are positive, then a minimum in the potential energy surface is present at that point. If the frequencies are, on the other hand, negative; the point is a maximum in energy and thus a transition state.
The BH3 stucture, optimised above, was opened and was used to perform a frequency analysis. The analysis was performed by Gaussian and the output was visualised in Gaussview. This was then used to visualise the vibrations and produce an IR spectrum.
| Vibration | Description | Frequency/cm-1 | Intensity | Symmetry Label | |||
|---|---|---|---|---|---|---|---|
|
Wag – Hydrogens simultaneously moving perpendicular to the σh plane. | 1146 | 93 | A2' | |||
|
Scissor - Two of the hydrogen atoms moving towards each other in the σh plane. | 1204 | 12 | E' | |||
|
Rock – Combination of a two hydrogen atoms scissoring and the third rocking. | 1204 | 12 | E' | |||
|
Symmetric Stretch | 2593 | 0 | A1' | |||
|
Asymmetric Stretch | 2731 | 104 | E' | |||
|
Asymmetric Stretch | 2731 | 104 | E' |
- Fig. 9: Table showing the vibrational modes of BH3.
The molecule is non linear and therefore should have 3n-6 vibrations (where n is the number of atoms in the molecule). Therefore it should have (4 x 3) - 6 = 6 vibrations. The table shows that this is correctly predicted by the program. There are actually 6 distinct vibrations. The symmetry of the vibration was found using the knowledge of the point group. The point group was known to be D3h. Each of the symmetry operations contained in this group was performed, and the outcomes noted. This gives the character for that symmetry operation. This was then compared to the character table for D3h and so the symmetry label was found.

- Fig. 10: The IR Spectrum for BH3 as produced by Gaussian.
The first thing to note about the IR spectrum is that it is the opposite way around to how it is most often observed in the literature or in the lab. Therefore the peaks are actually peaks and not troughs. The table shows that the calculation found 6 vibrations. The IR spectrum, however, contains only 3 peaks. This apparent discrepency can be explained with reference to the table. First of all, the A1' vibration (the symmetric stretch) has no overall change in dipole moment. This means that it will not show up as a peak on the spectrum. Therefore all of the peaks on the spectrum are due to the other vibrations. The two vibrations labelled wag and rock are both E' and are degenerate in energy. This means that they will also be degenerate in terms of the frequency. Therefore they will only show up as one peak on the spectrum. They correspond to the peak at 1205cm-1. The two asymmetric stretching modes are also E' and also degenerate and so will also show up as just one peak on the spectrum. These two modes correspond to the peak at 2731cm-1. The final mode is the wag, with symmetry of As'. This appears on the spectrum as the peak at 1146cm-1.
Calculations on TlBr3
Optimisation
The output file for the optimisation can be found here: Optimisation
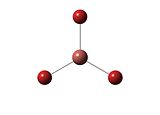
Thallium bromide (TlBr3) was drawn in Gaussview. The symmetry was then rigidly set to D3h. Figure 11 shows the optimised molecule. This was the result of the calculations. A jmol is also included in this figure.
The calculations run were very similar to the BH3 calculations. However the basis set was different. This is because of the large size of the atoms involved in the calculations of TlBr3. The basis set '321-G' takes all of the electrons in the molecule into account. This will cause the calculation to be more accurate but much more time consuming, especially for atoms with a large number of electrons. The pseudo potential used in the optimisation of TlBr3 only considers the valence electrons. These electrons are the outer shell and are where chemistry really occurs. Therefore this assumption is reasonable. The LanL2DZ basis set uses D95V on first row atoms and Los Alamos ECP on heavier atoms.
The calculation summary shows all of the information discussed above. This has been print screened and put in below:
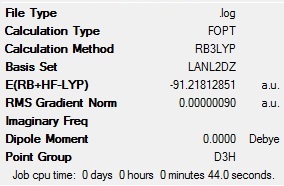
- Fig. 12: The output summary from the TlBr3 optimisation.
The optimised Tl-Br bond length was 2.65Å (+/- 0.01Å). This value was, as expected, the same for all three bonds. The optimised angle was 120° (+/- 0.1°), as it should be because of the point group being D3h. The literature values for bond length and bond angle are 2.52Å and 120° respectively.[1] The results obtained here are very close to the literature. The slight discrepancy could be explained by the difference in calculation method used. The literature used a more powerful and more accurate method. Therefore the results produced will be more accurate. However, as previously stated, this would have made the calculation times too long for the purposes of this experiment.
Vibrational Analysis
The output file for this analysis can be found here: Vibrational Analysis
The output file of the above optimisation was opened using Gaussview and then a vibrational analyssi was performed. To allow the two to be compared, the same method and basis set were used for both calculations. An example of a parameter that could be compared is the energy in the output summary. These should both be the same, or at least very similar. In this case they were both the same.
The output test output file was then opened. This was then searched for the relevant parts of the output, and then print screened and reproduced as figure 13.

- Fig. 13: A screenshot of the frequency output file for the Thallium bromide.
The "Low frequencies" are shown above in figure 13. These should be 0, and they are indeed very close to 0. The first row of numbers labelled "Low frequencies" are the motions that the centre of mass undergoes. These are, as they should be, very small compared to the first vibration listed. To be more quantitative, the first row are an order of magnitude smaller than the second row.
The second row in figure 13 are the real frequencies. These values are all positive. This indicated that the energy has successfully reached a minimum value. This is, in this case, the real reason for carrying out the frequency analysis. That is to say, the frequency analysis will tell you if the molecule has reached an energy minimum. This is due to the reasons outlined above for BH3, namely that the frequency is essentially the second derivative of the potential energy surface and therefore is positive when a minimum value is reached.
Gaussview has a database of bond lengths. It knows what length, roughly, a bond should be. Therefore, if the two atoms are within this distance it will draw a bond inbetween them. If they are within the double bond distance it will draw a double bond, and so on. Most inorganic molecules have bonds that are longer in length than organic molecules. This means that Gaussview decides that the two atoms are too far apart from each other and therefore do not have a bond between them. This is why some of the images throughout this report appear to have bonds missing.
A bond can be generally said to be the attraction between two atoms causing them to either share or exchange electron density. Either way it will cause the two atoms to be close in proximity. If the two share electrons, a covalent bond is formed. If they exchange, an ionic bond is formed. The ionic and covalent are the extreme examples and it is a sliding scale between the two.
Isomers of Mo(CO)4L2
Introduction
In this section two isomers of Mo(CO)4L2 will be modelled and studied. These two isomers are the cis and trans form. The "L" will be PCl3. This is to make the calculations managable for the computer. If this group was, for example, a phenyl group, the calculations would take a very large amount of time. The Cl atom is big enough to not change the results too significantly. At the same time, it is small enough to not be too much of a strain on computing resources.
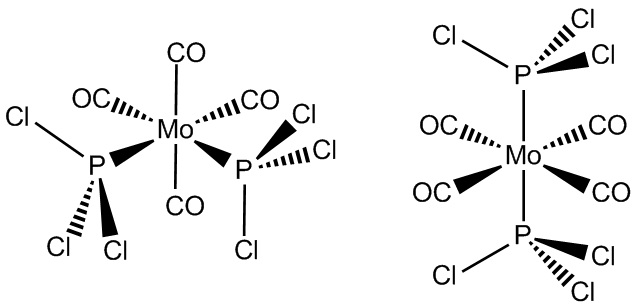
- Fig. 14: The molecular structures of the two isomers being modelled. The cis isomer is on the left and the trans isomer is on the right.
Computational techniques will be used to predict which one of the two isomers is the more thermally stable. As well as other properties, such as the IR spectra. The IR spectra are extremely important in identifying which isomer is present in the sample. This will be discussed below in the section for vibrational analysis.
In this case all of the results were sent to SCAN and all of the results were published to D space. The links to the results of these calculations are included in all the sections.
Optimisation
The files for the first and second optimisations can be found at the following:
The optimisation was performed in two steps. First of all the cis and trans forms were loosely optimised to get the energy closer to the minimum. These were optimised using the B3LYP method and the low level basis set and pseudo-potential like LANL2MB. This was then set to be a loose optimisation. This was to get the geometry roughly correct.
 |
 |
- Fig. 15: The output of the first optimisation of the cis and trans isomers
The first observation to make is that some of the bonds in the output have been deleted. This is to be expected due to the reasons outlined above. To quickly repeat, the program will not draw a bond if the distance is too long. However the bond is known to be there as the two forms are well known.[2]
The second stagee in the optimisation used the output from the first optimisation. The molecule produced from the first optimisation was opened in Gaussian and then altered to get it nearer to the known structure. In this case, the cis isomer was actually surprisingly close to the geometry it was supposed to be at. This was to make sure Gaussian produced the energy minimum and not an energy that was not the minimum but a local minimum. This is analogous to the gauche conformation in an energy profile of roatating a group. In that example the gauche conformation is an energy minimum, but it is not the lowest energy conformation. The way the program finds the lowest energy means it would not keep 'looking' to see if there is a lower energy arrangement once it has found a minimum.
The second optimisation again used the B3LYP method. This time, however, the basis set and pseudo-potential used were LANL2DZ. The basis set and pseudo-potential used this time were much better than those used above for the first optimisation. This time the loose optimisation criterea was removed. In its place the electronic convergence was increased. This was done by placing "int=ultrafine scf=conver=9" into the "additional keywords" section.
 |
 |
- Fig. 16: The result of the second optimisation of the cis and trans isomers.
Once more, Gaussview has not placed in all of the bonds that are present in the molecule. Again, it has not put in the P-Cl bonds. The reason for this is once more due to the reasons outlined above i.e. the way Gaussview decides where bonds are. This does not affect the ability of the program to calculate a bond length, even if it does not draw a bond. The program will just find the distance between the two atoms in question. It will also be able to calculate angles involving atoms with no bonds drawn.
The results displayed in figures 15 and 16 show various parameters of interest. It shows that for both molecules the second calculation is a fine tune. They also show that, for both stages of the optimisation, the energy of the cis isomer was slightly lower than the trans isomer. The energy difference between the two is very low. It is actually so small that it could be argued that it can not be said, with confidence, which of the two isomers is actually lower in energy. This is because the difference in energy between the two isomers is (after the second optimisation) 0.00104064 a.u. When one bears in mind that each of the calculations are only accurate to the nearest 10 kJ/mol, corresponding to 0.07 a.u, the validity of comparing the relative energies can be called in to question. However, it is not harmful to carry out such an analysis. So the difference between the two isomers, after the second optimisation, is 2.73 kJ/mol. A possible reason to believe that this could be anomalous is that the trans isomer is the more thermodynamically stable structure.[2] Therefore it should have the lowest energy. However, this statement is made about the cis and trans isomers of Mo(CO)4(PPh3)2. This is a different complex and the difference between the Ph groups and Cl on the P atom could affect this. The atom chlorine was chose specifically to try to minimise any differences between the complex modelled here and Mo(CO)4(PPh3)2, perhaps the change of atoms has affected the molecule. Another explanation could just be that the calculations are not going to produce perfect results as assumptions are made. To quickly summarise this paragraph, the energy difference after the second optimisation was 2.73 kJ/mol and the more stable one according to the calculations was the cis isomer. This was more stable by a relatively small amount. This is very apparent when compared to the difference between the energies of the two isomers of Mo(CO)4(PPh3)2, which is 72.98kJ/mol.[2]
As expected, the trans isomer has become eclipsed after the second optimisation. This is the most noticeable difference between the first and second optimisations. Another observation is the point groups returned by the calculation. The point group given were, for all cases, C1. The point groups are actually C2v for the cis[2] and D4h for the trans[2] form, as the trans form has higher symmetry than the cis form. This can be seen by looking at the diagrams of the molecules. These point groups are, in all probability, not returned because the molecule slightly deviates from the correct form needed. Taking the trans form as an example, the P-Mo-P should be a perfect straight line and the chlorine atoms should be perfectly eclipsed. Figure 16 shows that this is not the case - most likely due to the fact that this is a model that uses some assumptions and so can not be expected to be perfect. Therefore, when assigning the symmetry the program will perhaps try an operation (following the flow chart for assigning point group) and find that the operation does not return a form where the molecule looks the same. This would make the computer deduce that there is no axis/plane present and so to move on to the wrong next option in the flow chart. This follows through to the point group assignment and causes an incorrect assignment. This is plausible as the group assigned has low symmetry. Therefore it is likely that what has occured is as discussed above.
The bond lengths and the bond angles for the P-Mo-P bonds can be easily found using Gaussview. For the cis isomer the Mo-P bond length was 2.51Å and the P-Mo-P bond angle was 94.2°. The literature values for these are: 2.58Å and 104.6°.[2] These values are similar. They should actually not be exactly the same because the literature values are for the complex Mo(CO)4(PPh3)2. Therefore, while the two bond lengths and angles (that is the one calculated here and the literature) should be similar, they should not be the same. This comparison with the literature is mainly to check if the values obtained are at all plausible. The bond angle in the literature may be larger because the Ph groups are sterically more bulky than the Cl groups. Therefore they will take up more space, and so the lowest energy conformation will be one in which they are located far away from each other. This is achieved by the P atoms being as far as possible from each other in space. The reason Cl is so high is due to its electronegativity. Therefore it will have a high electron density and so the repulsive forces between neighbouring 3 Cl atoms on different P atoms will cause the groups to be fairly far apart in space.
The trans isomer had the same quantities calculated. The bond length was found to be 2.44Å and the angle was 177°. The literature values for the trans isomer are: 2.50Å and 180°.[2]. The angle should have been 180° but perhaps innacuracies in the calculation caused it to be not quite that value. Again the bond length is not unreasonable, and again the difference in length can be attributed to the literature coming from a different molecule. The difference in angle could be attributed to the same reason given for the cis isomer, namely that the PPh3 groups are bulkier than the PCl3 groups and therefore will arrange themselves further apart in space,
Comparing the cis and trans isomers; the cis isomer has has a longer bond length, and a smaller angle. The difference between the bond lengths could be because the two groups are trans to eachother in the trans isomer and hence affect each other a lot more than in the cis.
Changes that could be made to the PR3 ligand are the choice of R group. An R group that is extremely sterically bulky would change the intermolecular forces between different group. In other words, it would demand more space. This could make one of the forms more favourable.
Vibrational Analysis
The output file for the cis and trans vibrational analysis can be found at the following:
trans: trans vibrational analysis
The output file from the second optimisation was then used to carry out a frequency analysis. The use of this analysis was two fold. First of all, the analysis is an excellent way to check if the energy has actually been minimised. Due to the reasons outlined before (the second derivative showing the minimum in potential energy surface) if the frequencies obtained are all positive, the energy has been minimised successfully.


- Fig. 17: Screenshow of the output files after frequency analysis. The top is the cis isomer and the bottom is the trans isomer.
Figure 17 (above) clearly shows that both the cis and trans isomers have been optimised properly, as all the frequencies are positive. Also, the first row of numbers labelled "Low frequencies" are very small. As for the previous vibrational analysis, these centre of mass motions should be 0, but being very close to 0 is also good.
Some of the vibrations have a very low frequency, and thus very low energy, as seen by using Gaussview to show all of the frequencies. These vibrations have been animated, for both the cis and trans isomers, and compiled into the table below labelled figure 18:
| Vibrational Mode | Frequency/cm-1 | Intensity | Vibrational Mode | Frequency/cm-1 | Intensity | ||||||
|
11 | 0.03 |
|
5 | 0.09 | ||||||
|
18 | 0.07 |
|
6 | 0.00 |
- Fig. 18: A table showing the different vibrations listed as "Low frequencies" for the cis and trans complex. The cis is on the left, the trans is on the right.
These very low energy vibrations will be able to occur at room temperature. This is because there is enough energy for them to occur at 298K. The IR spectra for the cis and trans forms were produced using Gaussview. These are reproduced in figure 19 below:
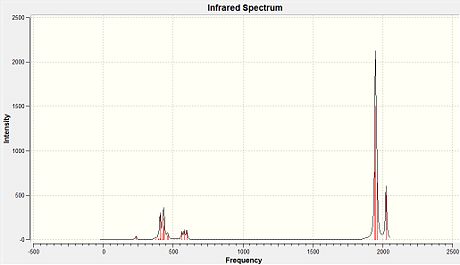 |
 |
- Fig. 19: The IR spectra for the cis and trans isomers. The cis is on the left and the trans is on the right.
The above shows that the two spectra are clearly different. This proves that the cis and trans forms produced were actually the two seperate isomers. The reason for the difference in appearance of the spectra is explained below.
| Cis isomer | Trans isomer | ||||||||
|---|---|---|---|---|---|---|---|---|---|
| Frequency / cm-1 | Intensity | Literature Frequency/cm-1 - for Mo(CO)4PCl3[3] | Literature Frequency/cm-1 - for Mo(CO)4PPh3[4] | Symmetry | Frequency/cm-1 | Intensity | Literature Frequency/cm-1 - for Mo(CO)4PCl3[3] | Literature Frequency/cm-1 - for Mo(CO)4PPh3[4] | Symmetry |
| 1945 | 761.9 | 1986 | 1897 | B2 | 1950 | 1475.4 | 1896 | 1902 | EU |
| 1949 | 1499.5 | 1994 | 1908 | B1 | 1951 | 1466.8 | 1896 | 1908 | EU |
| 1959 | 634.0 | 2004 | 1927 | A1 | 1977 | 0.6 | - | - | B1g |
| 2024 | 597.0 | 2072 | 2023 | A1 | 2031 | 3.8 | - | - | A1g |
Fig. 20: A table comparing the IR stretches of those calculated here with two literature examples.
The values calculated here and the literature values for the vibrations were, as expected, slightly different. This is due to the fact that the computational method treats the vibrations harmonically. They are actually anharmonic due to quantum mechanical repulsions when the atoms get too close together. Also, the influence of having different atoms/groups could make these different.
The cis isomer should have 4 stretches in the IR spectra, relating to 4 carbonyl stretching mode,. The trans isomer will only have one stretch on the spectrum. So in other words the cis form should have more peaks than the trans form. This is because the dipole moments of two of the stretches in the trans cancel out. The last two stretching modes are degenerate. This means they will have the same frequency and the same energy. As seen by the table above, for the trans isomer, the two stretching modes with a relatively large intensity are degenerate in energy and so correspond to the single peak in the IR spectrum shown above (figure 19). For the cis isomer, the 4 modes are seen but they overlap. This is why the spectrum appears to only have two peaks.
Mini Project - Exploring Bonding in Main Group Halides
Introduction
The structure of B2H6 was, at one point, a contentious issue.[5] The structure and geometry are now well known. Diborane has two boron atoms of sp3 hybridisation. Two of the orbitals bond to the 1s orbitals of the terminal 1s Hs. The other two bond with the bridging 1s H orbitals. This means that the B-bridgingH-B forms a 3 centre 2 electron bond. The force constant of the B-B vibration is not accounted for by this model. This problem is solved by the use of MO theory. If one goes even further and actually works out the entire MO diagram, it can be seen that, through the use of MO theory, no special bonding is actually needed to explain the structure. This example shows the power of MO theory and how even drawing 'cartoon like' pictures can be useful in explaining, to a good degree of precision, the structure and shape of a molecule.
Similarly to B2H6, Al2Cl6 has a unique bonding to explain the shape it takes.
The questions asked in this project are: What if instead of Al2Cl6 you replace two of the Cl atoms with Br atoms? Is there a particular conformation or position that the Br atoms prefer? In other words in which position, bridging or terminal, does placing the Br atoms make the molecule most stable? What effect does adding the Br atoms have on the vibrational spectrum? Finally, what do the orbitals for these two types of molecules look like?
Diborane
Optimising
As discussed above, diborane has a unique structure. This made drawing the structure in Gaussview tricky. To overcome this, the molecule was drawn in ChemBio3D Ultra 12.0. This was then quickly optimised using the MM2 force field, giving a quick approximation of the structure. The outcome from this brief optimisation was actually fairly accurate, and was saved as a .mol file so it could be opened in Gaussview. An optimisation, in Gaussian, was then carried out on this molecule. The method was B3LYP with a basis set of 6-31G. This calculation took a very short amount of time. The output file for this optimisation can be viewed here: Borane optimisation
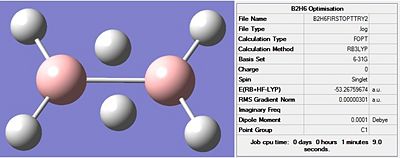
- Fig. 21: The output from the optimisation. Including: a picture(left), the output file (right) and a jmol (button).
The output file shows that the optimisation has been successfully completed. This is seen by the four "YES" responses at the bottom. Also the RMS gradient being so small shows it has finished.
The bonds have been incorrectly drawn by Gaussview. It has not placed the bonds between the B and bridging Hs but rather placed a bond between the two B atoms, as seen by the diagram in figure 21. However the shape appears to be, qualitatively, correct. More quantitative analysis can be done by finding bond lengths and angles. The terminal H-B-H angle was 121.7° and the H-B-B angle was 119.2°. This suggests that the program may have incorrectly optimised the molecule so that it is sp2 hybridisation, as opposed to the sp3 structure actually present. The hybridisation 'chosen' by the program cannot be said with certainty until more analysis is completed. It has not put all 3 hydrogens terminal, and so is at very least partially correct. The symmetry has also been assigned incorrectly as C1 rather than D2h.
The bond lengths were 1.19Å for B-terminalH and 1.32Å for B-bridgingH. These are fairly similar to other calculations done using Gaussian.[6] They should not be exactly the same, as the calculations in the reference were slightly different - they investigated solvent effects.
Molecular Orbital Analysis
The output file can be found here: Borane MO analysis
The full MO diagram for diborane has been produced. This was produced using symmetry adapted fragments. Two BH2 fragments were combined to give the fragment B2H4 (this is the fragment shown on the left of the MO diagram in figure 22). This fragment was then combined with the fragment from the two bridging Hs. It is important to note that the first two orbitals on the diagram are significantly lower in energy. However this is hard to show explicitly on the diagram, and so has been pointed out here instead. The full MO diagram is shown below:
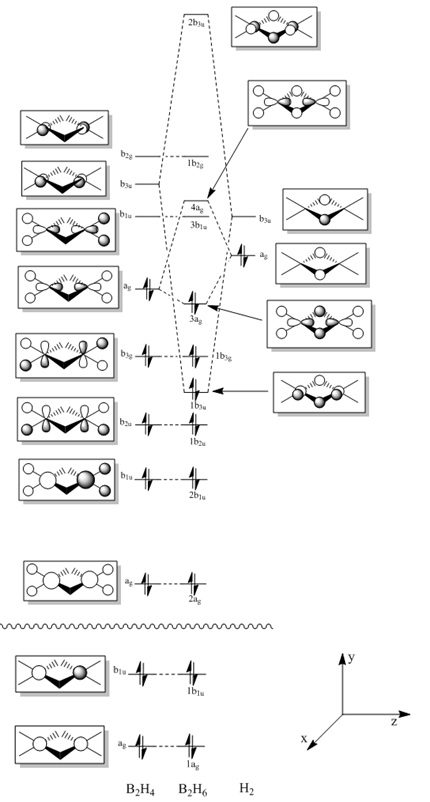
- Fig. 22: The full MO diagram for diborane.
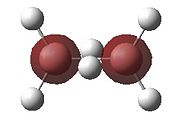
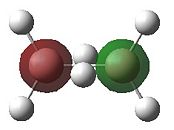
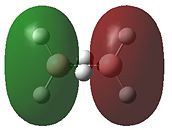
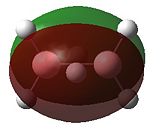
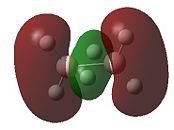
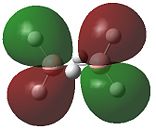
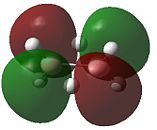
The checkpoint file was retrieved and the MOs were viewed. The computed MOs can be compared to the MOs given by the theoretical analysis.
 |
 |
 |
 |
 |
 |
 |
 |
 |
 |
 |
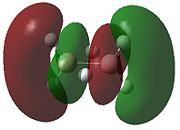 |
- Fig. 23: The MO's for diborane as calculated by Gaussian and visualised by Gaussview.
Frequency Analysis
The output file can be found here: Borane Frequency Analysis
The IR spectrum for diborane was produced and is shown below. This was fairly close to those produced experimentally.[7]
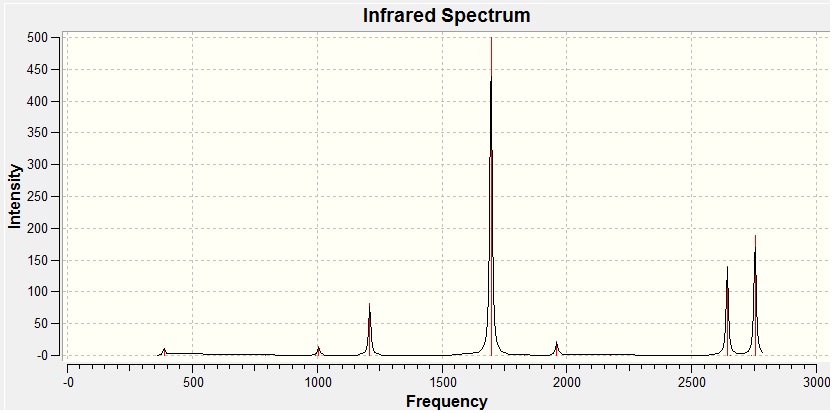
- Fig. 24: The IR spectrum for diborane, as produced by the calculation.
The frequencies produced were all positive. This shows that it was an energy minima and so the optimisation was complete. The only problem is it is possible it was a minimum value but only a local minimum and not the absolutely lowest value possible.
NBO Analysis
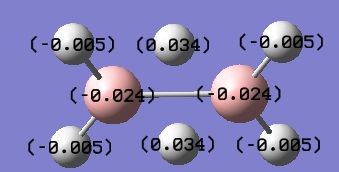
- Fig. 25: The charge distribution of diborane as shown by the computer
Conclusion
Due to time running out only the diborane could be optimised. However the results are consistent with those for previous computational analysis and for the literature. As expected there was some error and the computer program did confuse the bonding slightly, especially in terms of diagrams.
References
- ↑ J. Blixt, J. Glaser, J. Mink, I. Persson, P. Persson and M. Sandtroem, J. Am. Chem. Soc., 1995, 117(18), pp. 5089-5104
- ↑ 2.0 2.1 2.2 2.3 2.4 2.5 2.6 M. Ardon, P. D. Hayes and G. Hogarth, J. Chem. Educ., 2002, 79(10), pp 1249-1251.
- ↑ 3.0 3.1 ELmer C. Alyea and Shuquan Song, Inorg. Chem., 1995, 34, 3864-3873
- ↑ 4.0 4.1 D. J. Darensbourg and R. L. Kemp, Inorg. Chem, 1978, 17, 2680.
- ↑ P. Lazlo, Angew. Chem., Int. Ed., Engl., 2000, 39(12), pp. 2071-2072
- ↑ Yu-Bo Fan, Zong-Biao Ding, Quan-Rui Wang* and Feng-Gang Tao, Chemical Physics Letters, 2000, 328, pp. 39-44.
- ↑ H. G. Nadeau, D. M. Oaks, Anal. Chem., 1960, 32(11), pp. 1480–1484.
