Rep:Mod2db2409wd6
Module 2
BH3
Introduction:
The optimization calculations solves the Schrodinger equation for the electron density through the Bohn-Oppenheimer approximation, which assumes that the nuclei occupy fixed positions. This allows us to obtain an energy and density which is dependent on frozen nuclear positions. Any nuclear movement will result in a different energy. If we consider a dissociation curve of a diatomic molecule, when the nuclei get too close their energy goes up due to electrostatic repulsions. As the nuclei stretch and their bonds break, the energy goes up and the molecule dissociates. Thus, somewhere between these two extremes is a stable equilibrium arrangement located on the PES minima. The calculation involves changing nuclear positions by fixed amount until the lowest energy value is reached. However, The true curves are not always as ideal as the PES discussed previously and the calculation can often result in a false minima. Therefore, geometry optimizations from different starting points are required in order to determine the true minimum. When the nuclei and electrons are in equilibrium they experience no restoring forces. However, when the nuclei are not in equilibrium various interactions i.e. nuclear-nuclear repulsions exert forces on the nuclei and electrons allowing them to reorganize to more stable positions where the first derivative related to the E(R)function tends to zero. Therefore, the optimized structure is found when the first derivative of the PES is zero. This optimized geometry is the most probable geometry and that found in the gas phase.
Aim:
The aim of this computational report will be to explore the most stable mechanical and electronic structure through a variety of computational techniques. In this section of the report Gaussian geometry, energy and frequency calculations will be used to explore the nature of a trigonal planer molecule in this case a molecule of BH3. The objectives for this report are outlined below.
- To use molecular orbital calculation and NAO analysis to elucidate hybridization and bonding for a variety of molecules
- To use pseudo potentials to accurately model the electron distribution of heavier metal atoms and compare between a cis and trans isomer.
- Analyze geometric differences between a cis and trans isomer of Tl
- Use additional basis sets to model the d orbital contribution
- Use of symmetry and point groups to rationalize calculated IR spectrum's and compare with literature
- To use frequency analysis to decipher the main vibrational motions.
- Identify the main conformation of disiloxane using optimization techniques.
- Explore the effect of basis sets on the optimization of a disiloxane.
- Explore the bonding of disiloxane and compare with Dimethyl ether to rationalize the strength of the Si-O bond
Optimization:
The BH3 molecule was optimized on gaussview using the Gaussian DFT B3LYP method and the 3-21G basis set, a . The Starting BH3 molecule was drawn with an arbitrary bond length of 1.5A in order to minimize computational time. The file summary for this is shown below.
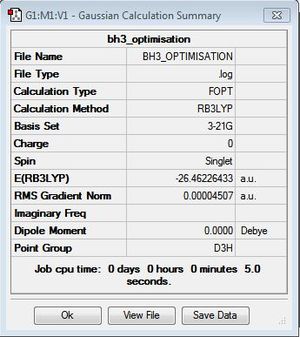
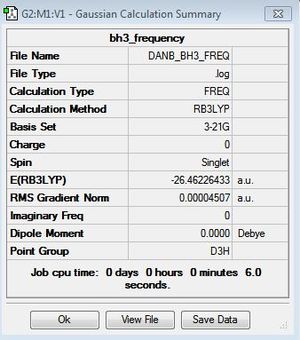
The FOPT means that gaussian is performing the full optimisation[1].The calculation method "RB3LYP" describes the methematical model being used.
As you can see from the summary above, the RMS gradient is effectively 0 and the calculation has converged. This shows, that we have reached the energy minimum. The optimized bond lengths and angles were found to be 1.1934A and 120o. This agrees with the literature value of 1.1867A [2] and the ideal trigonal planer bond angle of 120o. The dipole moment is reported to be 0 as the molecule is perfectly symmetric. The calculated energy -26.46au (-0.01Kj/mol) is an absolute energy value and can only be used to compare different conformations of BH3. The point group has been determined to be Dh3, with a calculation time of 5 seconds.
 Item               Value     Threshold  Converged?
 Maximum Force            0.000413     0.000450     YES
 RMS     Force            0.000271     0.000300     YES
 Maximum Displacement     0.001643     0.001800     YES
 RMS     Displacement     0.001076     0.001200     YES
 Predicted change in Energy=-1.018634D-06
 Optimization completed.
    -- Stationary point found.
                           ----------------------------
                           !   Optimized Parameters   !
                           ! (Angstroms and Degrees)  !
 --------------------------                            --------------------------
 ! Name  Definition              Value          Derivative Info.                !
 --------------------------------------------------------------------------------
 ! R1    R(1,2)                  1.1935         -DE/DX =    0.0004              !
 ! R2    R(1,3)                  1.1935         -DE/DX =    0.0004              !
 ! R3    R(1,4)                  1.1935         -DE/DX =    0.0004              !
 ! A1    A(2,1,3)              120.0            -DE/DX =    0.0                 !
 ! A2    A(2,1,4)              120.0            -DE/DX =    0.0                 !
 ! A3    A(3,1,4)              120.0            -DE/DX =    0.0                 !
 ! D1    D(2,1,4,3)            180.0            -DE/DX =    0.0                 !
 --------------------------------------------------------------------------------
 GradGradGradGradGradGradGradGradGradGradGradGradGradGradGradGradGradGrad
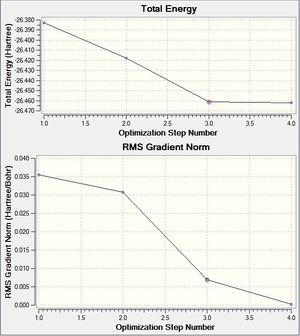
The text above suggests that the forces have converged and that the optimization has been successful. The graphical representation of each stage of the optimization can be seen above. The first graph shows the energy at each step of the calculation and the second graph shows the associated gradient. We start fairly close to to the minimum and proceed via 4 iterative steps.
The simplistic tool of using straight lines to represent covalent bonds is inadequate to describe the complexity of chemical bonding. The drawn bonds only represent valence orbitals, which on the surface is a fair assumption to decipher reactivity and bonding. This model is extremely useful for considering valencies on a VSEPR model. However, we can obtain more detailed information regarding the bonding and reactivity of a molecule by describing its electron distribution quantum mechanically. By modelling the bonding through distance dependent orbital (density probability) interactions with appropriate symmetry. Thus, the first two structures of the optimization do not contain any bonds. This leads us to question the Gaussian definition of bonding. The reason why Gaussview omits the bonds is due to an internal list of bond distances, thus when the calculated distance is outside these limits the bonds are not drawn. The internal list is suitable for organic molecules, but as inorganic compounds have a much wider range of bond distances due to increased size and bonding versitility, the bonds are left out for many inorganic molecules. However, even if the bond is not drawn, Gaussian preserves the quantum mechanical treatment through favorable orbital interactions between atoms preserving the essence of bonding.
Calculated MOs:
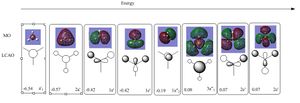
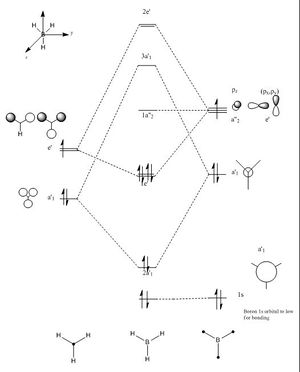
Furthermore, gaussian was also used to calculate and solve the electronic structure and generate the MO's of the molecule. The calculated MO's are correlated to their corresponding LCAO. A major observation is the swapping of the 2e' and the 3a"1 orbitals in the MO diagram. This suggests that these molecular orbitals are able to swap positions with relative ease. The values located on the bottom left of each MO are the corresponding calculated energies. The calculated MO's agree with those predicted by the LCAO and show a more de-localised picture by combining bonding and anti bonding character. For example for the 2a'1 orbital there is a completely bonding molecular orbital that spans the whole molecule. A lower energy non bonding orbital can also be seen corresponding to the Boron 1s orbital which is to low in energy to interact with Hydrogen. For the antibonding orbitals we can directly see an increase in the number of nodes. Furthermore, for the 3a'1 orbital we would expect to see less electron density on the more electronegative hydrogen. However, this is not what we see in the computed molecular orbital, suggesting a possible limitation of the calculation. Overall, the calculated MO's agree with the LCAO making this technique rather useful and accurate in predicting MO's.
NAO Analysis:
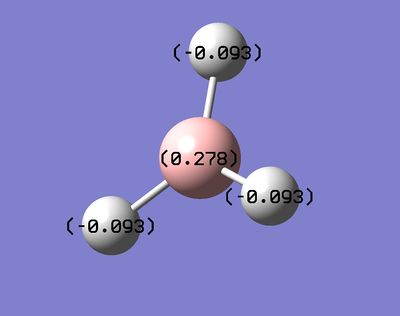
The full NBO option that was ticked for the Molecular orbital analysis allows us to analyse the data regarding the Natural bond orbitals and the charge distribution. The charge distribution can be seen above with the Hydrogen's being the more negatively charged environment. Thus, the figure clearly identifies Boron as being more electropositive compared to the Hydrogens. In addition, the strong lewis acidity of Boron is due an empty p orbital perpendicular to the plane of the molecule. Furthermore, more information can be extracted from the output file. The charges stated in the figure can be seen below in the LOG file.
Summary of Natural Population Analysis:

                                       Natural Population
                Natural  -----------------------------------------------
    Atom  No    Charge         Core      Valence    Rydberg      Total
 -----------------------------------------------------------------------
      B    1    0.27816      1.99954     2.72230    0.00000     4.72184
      H    2   -0.09272      0.00000     1.09256    0.00015     1.09272
      H    3   -0.09272      0.00000     1.09256    0.00015     1.09272
      H    4   -0.09272      0.00000     1.09256    0.00015     1.09272
 =======================================================================
   * Total *    0.00000      1.99954     6.00000    0.00046     8.00000
Furthermore, information regarding the nature of the bonding between the boron and hydrogen atoms can be seen in the occupancy section shown below.
        (Occupancy)   Bond orbital/ Coefficients/ Hybrids
 ---------------------------------------------------------------------------------
     1. (1.99854) BD ( 1) B   1 - H   2
                ( 45.36%)   0.6735* B   1 s( 33.33%)p 2.00( 66.67%)
                                            0.0000  0.5774  0.0000  0.0000  0.0000
                                            0.8165  0.0000  0.0000  0.0000
                ( 54.64%)   0.7392* H   2 s(100.00%)
                                            1.0000  0.0001
     2. (1.99854) BD ( 1) B   1 - H   3
                ( 45.36%)   0.6735* B   1 s( 33.33%)p 2.00( 66.67%)
                                            0.0000  0.5774  0.0000  0.7071  0.0000
                                           -0.4082  0.0000  0.0000  0.0000
                ( 54.64%)   0.7392* H   3 s(100.00%)
                                            1.0000  0.0001
     3. (1.99854) BD ( 1) B   1 - H   4
                ( 45.36%)   0.6735* B   1 s( 33.33%)p 2.00( 66.67%)
                                            0.0000  0.5774  0.0000 -0.7071  0.0000
                                           -0.4082  0.0000  0.0000  0.0000
                ( 54.64%)   0.7392* H   4 s(100.00%)
                                            1.0000  0.0001
     4. (1.99954) CR ( 1) B   1           s(100.00%)
                                            1.0000  0.0000  0.0000  0.0000  0.0000
                                            0.0000  0.0000  0.0000  0.0000
     5. (0.00000) LP*( 1) B   1           s(100.00%)
The main feature from this section can be found in the BD column. This column provides data regarding the relative orbital contributions for the bond between the two atoms. For all the B-H bonds we can see that the hydrogen orbital contribute a greater percentage than the Boron atomic orbitals. This arises from the H3 fragment orbitals being lower in energy relative to Boron. Thus, we would expect the bonding orbitals to contain a greater contribution from the more energetically stable Hydrogen's. In addition, we can also determine the degree of hybridization around the Boron center by analyzing the relative contributions from the 2s and 2p atomic orbitals. We can clearly see that Boron contributes 45.36% to the bond and the Hydrogen contributes 54.64%. This corresponds to a Sp2 hybridized center, which is what we would expect from the D3h point group. Finally, the fourth bond orbital with 100% s character is a non bonding 1s orbital located on the Boron atom. The 5th bond orbital corresponds to the lone pair on the Boron. The output file has computed this as an s orbital but we would expect this to be a p orbital. Thus, on this occasion we may have identified a limitation to this technique, reminding us that these results are approximate guidelines. Nonetheless, the natural bond orbital summary extract shows the approximate energies and populations of the B-H bond and the lone pair. This section can be seen below.
<prev>
Natural Bond Orbitals (Summary):
                                                         Principal Delocalizations
          NBO                        Occupancy    Energy   (geminal,vicinal,remote)
====================================================================================
Molecular unit  1  (H3B)
    1. BD (   1) B   1 - H   2          1.99854    -0.43328
    2. BD (   1) B   1 - H   3          1.99854    -0.43328
    3. BD (   1) B   1 - H   4          1.99854    -0.43328
    4. CR (   1) B   1                  1.99954    -6.68393  10(v),11(v),12(v)
    5. LP*(   1) B   1                  0.00000     0.53915
    6. RY*(   1) B   1                  0.00000     0.37512
    7. RY*(   2) B   1                  0.00000     0.37512
    8. RY*(   3) B   1                  0.00000    -0.04064
    9. RY*(   4) B   1                  0.00000     0.41499
   10. RY*(   1) H   2                  0.00015     0.73308
   11. RY*(   1) H   3                  0.00015     0.73308
   12. RY*(   1) H   4                  0.00015     0.73308
   13. BD*(   1) B   1 - H   2          0.00146     0.42130
   14. BD*(   1) B   1 - H   3          0.00146     0.42130
   15. BD*(   1) B   1 - H   4          0.00146     0.42130
      -------------------------------
             Total Lewis    7.99516  ( 99.9396%)
       Valence non-Lewis    0.00437  (  0.0547%)
       Rydberg non-Lewis    0.00046  (  0.0058%)
      -------------------------------
           Total unit  1    8.00000  (100.0000%)
          Charge unit  1    0.00000
</prev>
Frequency Analysis:
In order to find the vibrational modes and the IR spectrum of the BH3 molecule a frequency analysis was carried out. This frequency analysis revolves around finding the second derivative on the potential energy curve. Thus, if we obtain positive frequencies we are located on an energy minimum. A negative value would suggest the presence of a transition state. The analysis was carried out on the optimized BH3 molecule. The obtained energy output after the frequency operation matched that for the optimized BH3, indicating a successful calculation. The frequency summary and output are shown below.
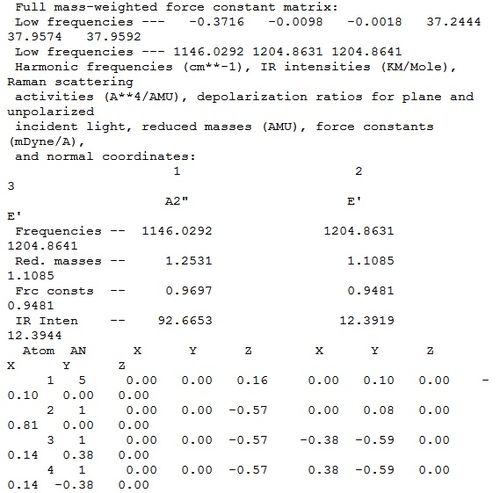
The first 3 low frequencies are negative, which would suggest the presence of a transition state. However, due to the relatively simply structure of BH3, it is unlikely that a transition state is present as only bond lengths have been changed. Furthermore, the 6 low frequencies are related to the 3 translational and 3 rotational non vibrational degrees of freedom. Thus, a molecule has 3N-6 vibrational frequencies. the remaining frequencies correspond to the stretch and bending modes of the molecule which are summarized below.
| Number | Vibrational form | Description | Animation | Frequency | Intensity | Lit Frequency | Symmetry Point Group D3h |
|---|---|---|---|---|---|---|---|
| 1 | 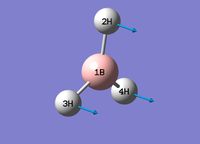 |
Animation | Umbrella Deformation | 1146.03 | 92.67 | 1148 [4] | A2" |
| 2 | 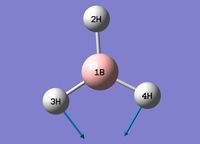 |
Animation | Scissor Motion | 1204.86 | 12.39 | 1197 [5] | E' |
| 3 | 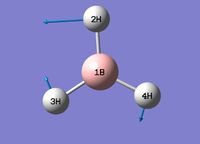 |
Animation | Rocking Motion | 1204.86 | 12.39 | 1197 [6] | E' |
| 4 |  |
Animation | Symmetric vibration | 2591.65 | 0.0 | Not observed | Totally symmetric A'1 |
| 5 | 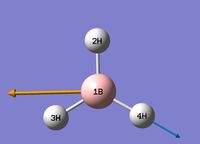 |
Animation | Asymmetric Stretch | 2730.07 | 103.86 | 2602 [7] | E' |
| 6 | 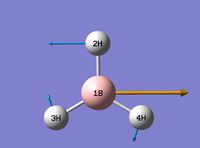 |
Animation | Asymmetric Stretch | 2730.07 | 103.85 | 2602 [8] | E' |
From the above table we can see the higher energy stretching modes at 2730.07cm-1 and 2591.65cm-1. It is important to note that the 2730.07 stretch is degenerate, which is consistent with the e" assignment from the molecular orbital diagram. The IR spectrum can be seen below.
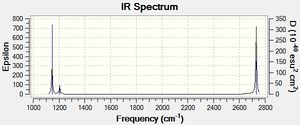
In the IR spectrum above we observe less than the expected 3N-6 stretches. The two degenerate stretches at 2730cm-1 and 1204.86cm-1 results in two less stretches being observed. Additionally, the totally symmetric stretch at 2591.65cm-1 has 0 intensity and is therefore not observed. The intensity of this stretch is related to the dipole moment and as the stretch is totally symmetric, it has a dipole moment of 0 corresponding to a zero intensity.
TlBr3
Our investigation will now be extended to a heavier trigonal planer molecule (TlBr3) and the effect of a heavier atom will be explored. The fact that TlBr3 has more electrons will result in more complicated and longer calculations. In order to minimize possible limitations we will solely model the valence electrons responsible for bonding and use an improved basis set to account for the complex electronic structure. The improved basis set that was chosen was a compromise between best description of electronic structure and computational time constraints. Thus, the LanL2DZ basis set fitted these criteria, providing a medium sized basis set for first row atoms and a pseudo potential for heavier atoms. The geometry optimization will involve the same method outlined previously (DFT B3LYP). The optimization begins from a restricted D3H trigonal planer structure. We restrict the symmetry to ensure no splitting of frequencies, ensuring reliable results, minimizing the error. The optimizations summary and the optimized molecule can be seen below.
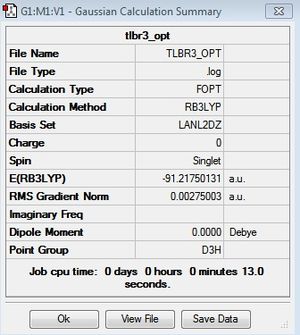
The optimized molecule contained Tl-Br bond length of 2.65 A and a bond angle of the ideal trigonal planer 120o. This is in agreement with literature, which identifies the bond as being 2.5A [9] The section below taken from the output file shows the successful convergence onto a stationary point.
<prev>
Item               Value     Threshold  Converged?
Maximum Force            0.000002     0.000450     YES
RMS     Force            0.000001     0.000300     YES
Maximum Displacement     0.000016     0.001800     YES
RMS     Displacement     0.000010     0.001200     YES
Predicted change in Energy=-4.107348D-11
Optimization completed.
   -- Stationary point found.
                          ----------------------------
                          !   Optimized Parameters   !
                          ! (Angstroms and Degrees)  !
--------------------------                            --------------------------
! Name  Definition              Value          Derivative Info.                !
--------------------------------------------------------------------------------
! R1    R(1,2)                  2.651          -DE/DX =    0.0                 !
! R2    R(1,3)                  2.651          -DE/DX =    0.0                 !
! R3    R(1,4)                  2.651          -DE/DX =    0.0                 !
! A1    A(2,1,3)              120.0            -DE/DX =    0.0                 !
! A2    A(2,1,4)              120.0            -DE/DX =    0.0                 !
! A3    A(3,1,4)              120.0            -DE/DX =    0.0                 !
! D1    D(2,1,4,3)            180.0            -DE/DX =    0.0                 !
--------------------------------------------------------------------------------
GradGradGradGradGradGradGradGradGradGradGradGradGradGradGradGradGradGrad
</prev>
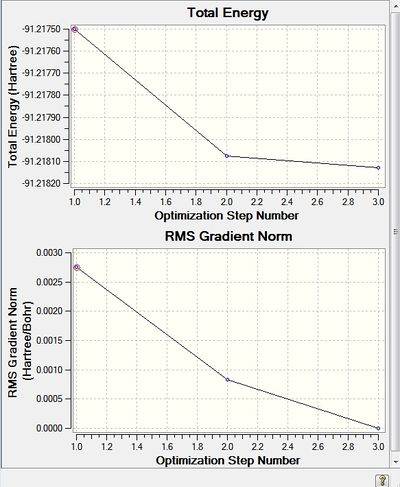
Furthermore, the optimization graphs identify a three step slope rather than the 4 observed for BH3, suggesting that the starting geometry was closer to the minimum than BH3. Nevertheless, both graphs appear to support the optimization being located on the global minimum.
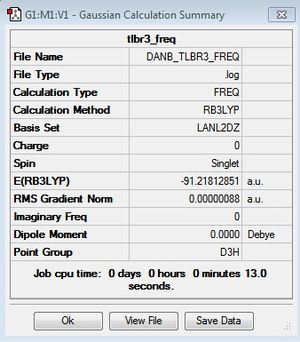
As discussed previously the frequency analysis enable us to isolate transition states confirming the minimum geometry. Thus, the frequency analysis requires the same method and basis set previously used. If the calculation is successful the energy value should be the same as the geometry optimization energy value. As you can see from the summary below the same energy value is calculated supporting a successful calculation.
<prev> Full mass-weighted force constant matrix:
Low frequencies ---   -3.4213   -0.0026   -0.0004    0.0015    3.9367    3.9367
Low frequencies ---   46.4289   46.4292   52.1449
Harmonic frequencies (cm**-1), IR intensities (KM/Mole), Raman scattering
activities (A**4/AMU), depolarization ratios for plane and unpolarized
incident light, reduced masses (AMU), force constants (mDyne/A),
and normal coordinates:
                    1                      2                      3
                   E'                     E'                     A2"
Frequencies --    46.4289                46.4292                52.1449
Red. masses --    88.4613                88.4613               117.7209
Frc consts  --     0.1124                 0.1124                 0.1886
IR Inten    --     3.6867                 3.6867                 5.8466
 Atom  AN      X      Y      Z        X      Y      Z        X      Y      Z
    1  81     0.00   0.28   0.00    -0.28   0.00   0.00     0.00   0.00   0.55
    2  35     0.00   0.26   0.00     0.74   0.00   0.00     0.00   0.00  -0.48
    3  35     0.43  -0.49   0.00    -0.01  -0.43   0.00     0.00   0.00  -0.48
    4  35    -0.43  -0.49   0.00    -0.01   0.43   0.00     0.00   0.00  -0.48
</prev>
The frequency analysis involves calculating the second derivative of the energy relative to nuclear position. A minimum is only reached when this derivative is positive on both sides of the stationary point. For molecules with large force constants, we expect to see increased curvature and a large second derivative and vica versa. Thus, negative low frequencies can arise from being positioned below the threshold convergence gradient, leading to a negative second derivative for the low frequencies. Thus in this case we observe the lowest frequency of the 3N-6 low frequencies at -3cm-1 which is inside an acceptable tolerance of 10cm-1.
| Number | Vibrational form | Animation | Description | Frequency | Intensity | Lit Frequency | Symmetry Point Group D3h |
|---|---|---|---|---|---|---|---|
| 1 | 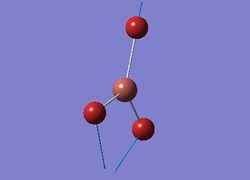 |
Animate | Scissor Motion | 46.43 | 3.69 | 45 [10] | E' |
| 2 | 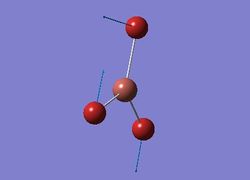 |
Animate | Rocking motion | 46.43 | 3.69 | 45 [11] | E' |
| 3 | 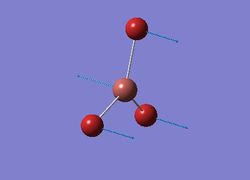 |
Animate | Umbrella Deformation | 52.14 | 5.85 | 68 [12] | A2" |
| 4 | 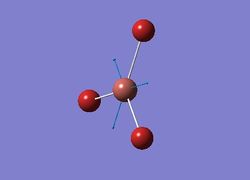 |
Animate | Symmetric vibration | 165.27 | 0.0 | 186 [13] | Totally symmetric A'1 |
| 5 | 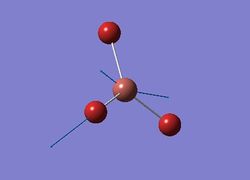 |
Animate | Asymetric Stretch | 210.69 | 25.48 | 205 [14] | E' |
| 6 | 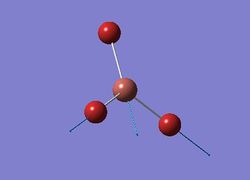 |
Animate | Asymmetric Stretch | 210.69 | 25.48 | 205 [15] | E' |
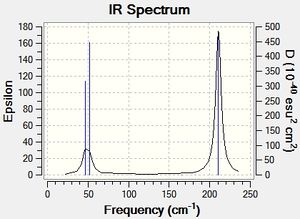
These vibrational motions can be seen in the spectrum below. although they may appear to be quite similar to those of BH3 the frequencies are in fact much lower in energy. This may be due to the fact the atoms are heavier in this example, resulting in shorter frequencies, analogous with varying the masses on a spring. The totally symmetric stretch at 165.27cm-1 has the expected zero intensity due to the zero overall dipole moment. Furthermore, the degenerate motions at 46.43 cm-1 overlap with bending motion at 52.14cm-1, thus reducing the number of peaks observed to 2. The remaining degenerate motions at 210.69cm-1 corresponds to high energy asymmetric stretches.
MO(CO)4L2
The structures of the cis and trans isomers were optimized using the following criteria:
- Method: B3LYP
- Psuedo potential: LANL2MB
- Additional key words: opt=loose
The trans and cis preliminary optimization summaries can be seen below. Both isomers have very similar energy values, but the cis isomer appears to be lower in energy after this preliminary optimization. In addition, for the cis isomer we can see a dipole moment of 8.63 Debye compared to 0 for the trans isomer.
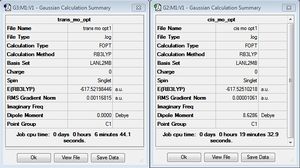
This is a low level calculation and provides a preliminary optimization as it returns fairly accurate bond lengths and angles but does not accurately describe the dihedral angles, particularly the rotation of the PCL3 groups. As Gaussian finds the closest minima not the global minimum, the second optimization had to be carried out from a specific starting orientation. Thus, for the trans isomer the PCl3 groups were rotated giving an eclipsed conformation with one Cl of each group lying parallel to one Mo-C bond. For the cis isomer one Cl of each group was aligned parallel to an axial C-CO bond with one pointing up and one pointing down.
These conformers were then optimized using the following criteria:
- Method: B3LYP
- Psuedo-potential: LANL2DZ
- Additional key words: int=ultrafine scf=conver=9
The second isomer optimization summaries can be seen below. After the second optimization the cis conformation is still identified as being slightly lower in energy. In addition, as seen the previous summary the cis isomer has a much larger dipole moment. After this optimization we see the difference between the dipole moments decrease, as the trans isomer increases slightly and the cis isomer decreases quite dramatically to 1.3098 Debye. The increase in the trans dipole moment suggests a loss of symmetry disturbing the symmetrical distribution of electron density.
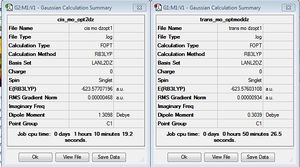
Furthermore, due to the fact that the Phosphorous atom likes to be hypervalent, and use its low lying D orbitals. This is why we see a hypervalent warning in the output file. Thus, after the previous optimization an extra basis set was used to provide more accurate and reliable results. The Gaussian input file was edited by adding the keyword extra basis and adding a couple lines of text to the end of file which describes the D function of specific width and a decay rate. The frequencies were then calculated from this optimized geometry. The added code and optimization summaries can be seen below.
# opt b3lyp/lanl2dz geom=connectivity int=ultrafine scf=conver=9 extrabasis
(blank line)
P 0
D  1  1.0
0.55  0.100D+01
****
(blank line)

We can see some interesting changes in this final optimization using a more advanced basis set. One of the major observations is that we know observe a preferred stability for the trans isomer. We also observe a further decrease in the magnitude of the dipole moments with the cis isomer still having the larger moment. The C1 point group is preserved through the optimizations. The difference in energy between the two isomers was calculated to be 0.068 au. As 1 hartree(au) = 2625.5 we can convert the difference into to Kj/mol giving a value of 178.5kj/mol. This value is extremely large, as we would expect a smaller barrier to isomerisation and is most likley due to a calculating error for one of the isomers.
We will continue to analyses the reliability of these optimizations by comparing bond lengths and angles to literature. The tables below tabulate the calculated and literature values for the cis and trans isomers.
| Bond | Cis Gaussian (A) | Cis Literature [22] (A) | Trans Gaussian (A) | Trans Literature [23](A) |
|---|---|---|---|---|
| Mo-C cis to P | 2.05 | 2.06 | 2.06 | 1.97 |
| Mo-C trans to P | 2.01 | 1.97 | - | - |
| C=O cis to P | 1.173 | 1.13 | 1.17 | 1.17 |
| C=O trans to P | 1.175 | 1.16 | - | - |
| P-Cl | 2.17 | N/A | 2.24 | N/A |
| Mo-P | 2.47 | 2.58 | 2.44 | 2.50 |
The bond distances appear to vary for each isomer. However, the Mo-P bond length for the cis isomer is 0.03A longer than the trans isomer indicating a lengthening of the Mo-P. This may be caused by either steric repulsion or a result of decreased back bonding. The Latter seems more likely as we can see that the P-Cl bond is much shorter and stronger for the cis isomer which is in agreement with decreased back bonding for the cis isomer, weakening the Mo-P bond. Furthermore, the C=O bonds for the cis isomer are longer for the carbonyl groups trans to the Phosphorous ligands compared to those that are cis. This observation can be accounted for by the trans effect. This is due to electron density on the metal being donated from the lone pair on phosphorous and occupying the opposite π*CO thus weakening the trans C=O bond, resulting in a longer bond length. However, this interactions results in a strengthening of the trans Mo-C bond via electron donation, resulting in a shorter bond distance for the trans Mo-C bond.
We will Know start to analyse the bond angles within the two isomers and compare these with literature values. The P-Mo-P angle for cis-[Mo(PPH3)2(CO)4] was given to be 104.6o from literature [24] with a Mo-P bond length of 2,57A. For the optimized cis structure we observe similar bond length. The calculated angle for the Cis P-Mo-P angle was found to be 94.15o slightly larger than the ideal 90o. This value is much closer to that observed for a PPhMe2 disubstituted complex (94.78o). Thus, as we remove steric bulk from the phosphine, by replacing Ph groups with Cl, packing is easier and we get values closer to the ideal 90o. This is what we observe for our calculated cis complex as we get angles within the range 88-94o. Furthermore, for a trans [Mo(P(OMe)3)2(CO)4] the cis ligand angles were reported to be in the range of 86.7 and 93.3o [25]. For the optimized trans structure the bond angles fell between 88-94o, which appear to agree with literature. Furthermore, the substituted chlorine atoms are by no means an accurate representation for the Phenyl group to obtain the correct geometry with minimal computational power. Thus, due to the small difference between the two isomers the most stable cannot be assigned as steric and electronic effects are not sufficient, as intra-molecular interactions may play an important role in determining the isomers relative stabilities. Thus, the calculated information is hardly conclusive but does suggest that conversion between the two isomers should proceed with relative ease at ambient temperatures.
Vibrational Analysis
The two Fully optimised isomers can be seen in the animations below. In additon, the frequency analysis identified some low frequency vibrations for both isomers. The first 3 of these vibrations are described and animated below. These vibrations involve a rocking vibrational mode due to the twisting of the PCl3 groups. The energy at room temperature (298 K) is approximately 2.5 kJ mol-1, corresponding to a frequency of around 210 cm-1. Thus, the frequencies of these rotations are all below value, suggesting that they are all accessible at room temperature[26][27].
| Cis | Trans |
| Isomer | Frequency 1 (cm-1) | Frequency 2 (cm-1) | Frequency 3 (cm-1) |
|---|---|---|---|
| Cis | 11 Animate | 19 Animate | 44 Animate |
| Trans | 35 Animate | 47 Animate | 50 Animate |
The fact that no low negative frequencies were obtained suggests a succesfull 2 step optimisation and frequency calculation. The tables below tabulate the higher frequency vibrations and their corresponding motions
| Frequency (cm-1) | Lit Frequency (cm-1) [29] | Intensity | Animation | Symmetry |
|---|---|---|---|---|
| 1947 | 1986 | 1450 | Animation | B2' |
| 1949 | 1994 | 844 | Animation | B2 |
| 1960 | 2004 | 595 | Animation | A1' |
| 2024 | 2072 | 583 | Animation | A1' |
| Frequency (cm-1) | Lit Frequency (cm-1)[31] | Intesnity | Animation | Symmetry |
|---|---|---|---|---|
| 1951.06 | 1896 | 1465 | Animate | Eu |
| 1951.69 | 1896 | 1457 | Animate | Eu |
| 1977.33 | n/a | 0.9 | Animate | B1g |
| 2031.32 | n/a | 3.7 | Animate | A1g |
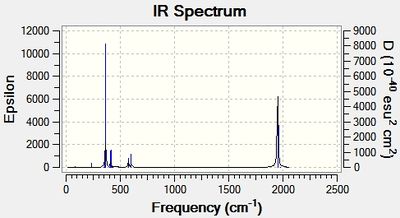
The computed cis-IR stretches are different from literature by approximately 50cm-1. As Gaussian calculates values using the harmonic oscillator approximation, discrepancies are likely to arise as the experimental data uses the anharmonic model. Thus, we can use these observed discrepancies to evaluate the reliability of the harmonic approximation, which in this case does not accurately predict the vibrations, but does provide a guideline to their relative separations. Additionally, the number of IR active peaks is accurately represented computationally, providing a means of differentiating the two the isomers spectroscopically.
| Trans | Cis |
|---|---|
 |
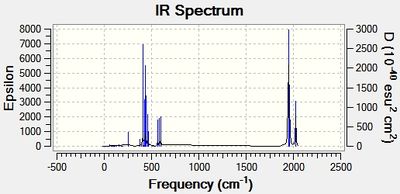 |
the trans isomers shows a single peak at 1951 whereas the cis isomer shows 4 peaks at 1947,1949, 1960 and 2024cm-1. Thus, the number of carbonyl vibrations can be predicted from the symmetry of the molecule. If we assume rapid rotations of the PCL3 group then we can assign the cis and trans isomers as having C2v and D4h respectively. Thus, due to the trans high symmetry only on of the carbonyl vibrations is IR active, whereas the opposite lack of symmetry for the cis isomers results in 4 IR active carbonyl stretches. This may appear counter intuitive as we calculate 4 vibrations for each isomer. However, this is due to the first two vibrations of the trans isomer being degenerate and the remaining two resulting in no change in dipole moment making them IR inactive. This is further supported by the low intensities of these two vibrations compared to the first two degenerate vibrations. On the whole the calculated spectrum is what we would expect for these isomers, with deviations within the calculated computational error.
Mini Project
The aim of this mini project will be to investigate the structure and bonding in siloxanes. The nature of the Si-O bond will be explored through the use of various substituents. Polymeric siloxanes are extermely versitile and have found widespread applications due to their thermal and chemical inhertness. This versitility has been atributed to the strength and flexibility of the Si-O-Si linkage reported to have a bond dissociation energy of 799KJmol-1 [32], which will be explored through MO calculations. Furthermore, The reason why the Si-O bond is so strong has been attributed to the delocalisation of Oxygens lone pairs into the vacant D orbitals on Silicon. This will be investigated further by analysing the molecular orbitals, natural bond orbitals and frequencies of a siloxane and its carbon anologue. This should allow is to compare the degree of delocalisation for each anologue
The siloxanes widest application is as polymer in electric circuits. However, the compuational demands for investigating a large polymer would be far to large for this mini project. Thus, we will be analysing the Si-O-Si linkage in a disiloxane. The results obtained should provide an approximate guidline for longer structures.
The Siloxanes also have various cyclic anaologues which are widely used as an emollient in the cosmetic industry . The most common of these cyclic anaolgues is Decamethylcyclopentasiloxane also known as D5. These cyclic anologues also have a wide range of applications. Though D5 is not harmful to humans, recent studies have highlighted its build up in the enviroment and its enviromental consequences, demanding consideration for regulation. Various techniques to destbailise its structure and prevent its enviromental build up are being developed. Perhaps, by studying the bonding in Si-O we can decipher a means to allow controled degradability.
Optimisation
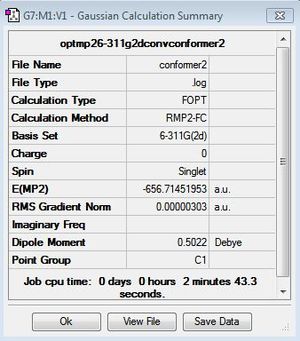
The Disiloxane optimization highlights the effect of basis sets on the linearity of the molecule. Literature thoroughly describes various compuational methods and their resultant geometries [33]. Thus, in order to explore this phenomenon various computational methods will used to depict this effect. In order to ensure that the molecule lied on its global minimum its bond lengths and angles were set to those stated in literature, 1.634A[34] and 151.2[35] o. The first optimization was done twice using the DFT B3LYP method with a low level basis set 3-21G until the calculation had successfully converged. However this initial optimization resulted in a linear eclipsed molecule with a bond angle of 179.7o and a bond length 1.67A . This is clearly very different from what we would expect to see experimentally, suggesting a limitation in this method. Thus, literature identifies the MP2/6-311G as being more accurate in describing the bent geometry of disiloxane. However, due to the d orbitals on silicon we can obtain a more detailed picture by incorporating the d orbitals into our calculation. Literature identifies an improvement of 10 o between the d and 2d descriptions. We can improve this further at the cost of computational time by adding a (+) to the method, this allows the orbitals to become slightly more diffuse, allowing favorable orbital overlap to be emphasized. The carbon analogue will be optimized using the simple DFT/B3LYP 6-311G method as no d orbitals need to modeled, of course this mean that the calculated energies cannot be compared. The diagram below depicts to three major conformations for the disiloxane molecule, after computational optimization of the three conformers only the first and second molecules are obtained with the same energy values of -656.71 au . This suggests that conformers 1 and 2 inter convert at room temperature with no boundary to rotation, making conformer 3 a transition state to rotation. Thus, the Si-O bond must exhibit single bond character, with the majority of the bond strength being attributed to d-p orbital interactions.

| Method | Geometry | Bond angle | Si-O bond length(A) | Si-H bond length(A) | Energy (au) | Lit Energy (au) [37] |
|---|---|---|---|---|---|---|
| DFT/B3LYP 3-21G | Click Here | 179.5 | 1.67 | 1.49 | -654.4 | - |
| MP2/6-31G | Click Here | 179.9 | 1.69 | 1.49 | -656.3 | - |
| MP2/6-311G(d) | Click Here | 155.2 | 1.66 | 1.49 | -656.67 | -656.67 |
| MP2/6-311G(2d) | Click Here | 139.1 | 1.65 | 1.49 | -656.71 | -656.71 |
Item               Value     Threshold  Converged?
 Maximum Force            0.000014     0.000450     YES
 RMS     Force            0.000003     0.000300     YES
 Maximum Displacement     0.000093     0.001800     YES
 RMS     Displacement     0.000031     0.001200     YES
 Predicted change in Energy=-7.713612D-10
 Optimization completed.
    -- Stationary point found.

It is clear from the above table that the most accurate method is clearly the MP2/6-311G2d as the bent angle and bond length are the closest to literature. These calculations have been coreelated with those that have been compuationaly reported in literature. This can be seen for the last two methods which are identical to the literature calculated energy value. In addition, as the molecule becomes more bent we see an afforded stability as the molecule becomes more stable with a more accurate calculation. Therefore, any future optimisations involving Si will utilise the same method. As we increase the accuracy of our method the results tend from the upper limits and converge on the true values. We can see that the MP2/6-311G(2p) calculation has successfully converged from the section of the outputfile shown above, the summary files for each calculation are also shown.We will now optimise the geometry and calculate the MO of a carbon anaologue for comparison with disiloxane molecular orbitals. Furthermore in order to explore the Si-O bond in more detail, the effect of EW and ED substituents on the Si-O bond will be studied. Thus the optimised structures for of the disubstituted alcohol and cyanide will be calculated below from the optimised disiloxane using the MP2/6-311G(2d) method. The results can be seen below.
| Formula | Geometry | bond angle | Si/C-O bond length(A) | Si/C-H bond length | Si-X |
|---|---|---|---|---|---|
| cis-SiH2OHSiH2OH [38][39] | Optimised Geometry | 146 | 1.63 | 1.49 | 1.64 |
| cis-SiH2CNSiH2CN [40][41] | Optimised Geomtry | 147.7 | 1.64 | 1.49 | 1.84 |
| cis-SiH2FSiH2F [42] | Optimised Geomtry | 155.3 | 1.63 | 1.48 | 1.59 |
| CH3OCH3 | Optimised carbon analogue | 113.3 | 1.45 | 1.09 | - |
From the baove table we notice that the bond angle has moved closer to linearity as a result of increasing EW charachter of the substituents. However, this may not be a purely electronic effect and can also be attributed to steric reasons as the molecule attempts to remove steric strain. In addition, we see a shortening of the Si-O bond for both electron donating and electron withdrawing substitutents. However, we would expect the electron withdrawing substituents to drag electron density from O, strengthening and shortening Si-O bond. A reason why we have observed the same relationship for the Electron danating OH group could be due to resonance and inductive effects affording greater delocalisation and conjugation of electron density throughout the molecule and would strengthen the Si-O bond. The Si-H bond remained unchanged except for Flourine where we see a minor shortening most likely due inductive effects of flourine perturbing electron density towards itself . Finaly, we can see that the carbon anaologue has a more acute angle and a shorter bond compared to siloxane. This suggests, that the reason for the strength and versatility of the Si-O bond will be found in the its MO diagram.
MO calculations
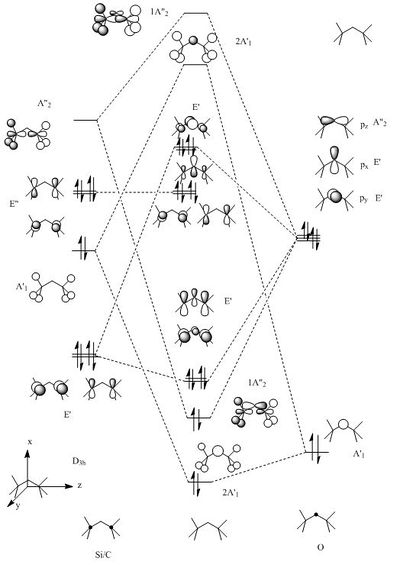
The MO were calculated using the same method as the previous optimizations, except adding the additional words pop=full to the calculation and asking for full NAOs. The calculated MOs and the molecular orbital diagram for carbon and silicon will be analyzed and compared in this section. For the eclipsed disiloxane the point group was determined to be of D3h symmetry in agreement with Literature [43]. The qualitative MO diagram can be seen below.
| Molecular orbital | Disiloxane | Energy (au) | Dimethyether | Energy(au) | Symmetry |
|---|---|---|---|---|---|
| LUMO+1 | 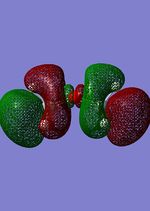 |
0.15 | 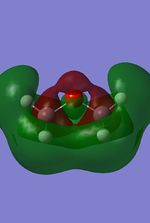 |
0.032 | 1A"2 |
| LUMO |  |
0.11 | 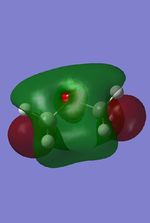 |
-0.038 | 2A'1 |
| HOMO | 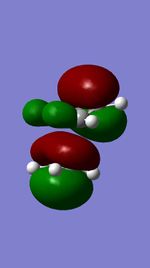 |
-0.45 | 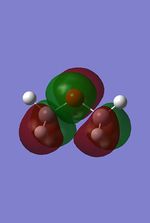 |
-0.33 | E' |
| HOMO-1 |  |
-0.45 | 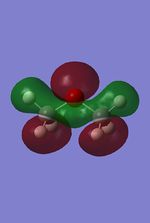 |
-0.41 | E' |
| HOMO-2 |  |
-0.49 | 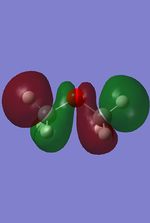 |
-0.46 | E" |
| HOMO-3 |  |
-0.49 | 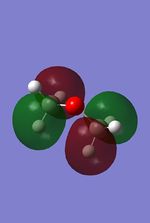 |
-0.48 | E" |
| HOMO-4 |  |
-0.58 | 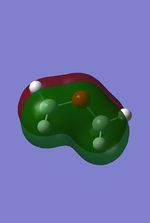 |
-0.54 | E' |
| HOMO-5 | 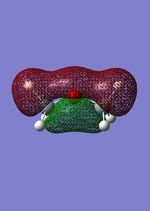 |
-0.58 | 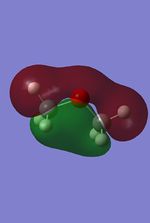 |
-0.54 | E' |
| HOMO-6 |  |
-0.6 | 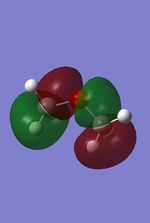 |
-0.55 | 1A"2 |
| HOMO-7 | 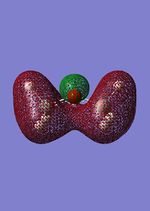 |
-0.69 | 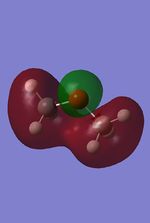 |
-0.71 | 2A' |
From these calculation we see similar shaped MO's for Dimethyther and the Disiloxane. The precise ordering of the orbitals varies and can be seen from the calculated energy column. The main ordering discrepancy can be seen for the HOMO-2 and HOMO-3, where the HOMO-2 is destabilized slightly resulting in a loss of degeneracy. This is most likely due to either a break in symmetry allowing mixing or due to different degrees of splitting arising from the difference in electronegativity between Si/O and C/O .This also explains why we obtain a greater spread of energy values for the disiloxane on not the dimethylether. After adding the MO energies for each analogue the disiloxane was determined to be more stable by 0.044au. The main difference in shape and size can seen in the LUMO+1. For the dimethylether we see a greater degree of delocalisation between C and H atoms, perhaps this is due to a more acute angle between the carbons, allowing them to get close enough to electronically interact with one another. Furthermore, we see four nodes for both MO's with the Carbon MO being less destabilizing, this can most likely be attributed to splitting perameters. Many of the MO's also suggest possible p-d bonding as the HOMO-2 and HOMO-3 for Si have the correct symmetry to overlap with a d orbital, thus there is possibility for d orbital involvement. The Klopman-salem equation states that the stabilisation energy is inversely proportional to the orbital difference in energy. Thus, in this example a large gap between the HOMO and the d orbitals of Si is likely, so we would expect minimal stabilization from the d orbitals. Perhaps, further MO studies on Di-substituted disiloxanes would elucidate d-orbital involvement further, this is beyond the scope of this mini project as we would expect more complicated Molecular orbitals to arise. These calculations would replenish our calculational time constraints and would require a more in depth MO analysis, to clearly elucidate substituent effects on the Si-O bond.
NAO Analysis
| Disiloxane | Dimethylether |
|---|---|
 |

|
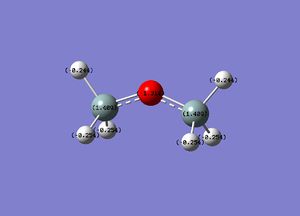
We can see from the NAO analysis that the Si is much positive than its corresponding carbon analogue. This can be attributed to Silicons high electropositivity. In addition, the oxygen is much more negative for the disiloxane than the dimethyl ether. This, suggests that the build up of electron density is found on the oxygen with a greater electrostatic attraction due to a greater difference in electronegativity for the disiloxane. The main extracts from the output file can be seen below.
| Extract section | Disiloxane | Dimethyl ether |
|---|---|---|
| Summary of Natural Population |
                                      Natural Population
               Natural  -----------------------------------------------
   Atom  No    Charge         Core      Valence    Rydberg      Total
-----------------------------------------------------------------------
    Si    1    1.40882      9.99864     2.54763    0.04491    12.59118
     H    2   -0.24384      0.00000     1.24270    0.00114     1.24384
     H    3   -0.25407      0.00000     1.25278    0.00128     1.25407
     H    4   -0.25407      0.00000     1.25278    0.00128     1.25407
     O    5   -1.31370      1.99979     7.30332    0.01059     9.31370
    Si    6    1.40882      9.99864     2.54763    0.04491    12.59118
     H    7   -0.25407      0.00000     1.25278    0.00128     1.25407
     H    8   -0.24384      0.00000     1.24270    0.00114     1.24384
     H    9   -0.25407      0.00000     1.25278    0.00128     1.25407
=======================================================================
  * Total *    0.00000     21.99706    19.89512    0.10782    42.00000
|
                                      Natural Population
               Natural  -----------------------------------------------
   Atom  No    Charge         Core      Valence    Rydberg      Total
-----------------------------------------------------------------------
     C    1   -0.21532      1.99921     4.20689    0.00921     6.21532
     H    2    0.18579      0.00000     0.81317    0.00105     0.81421
     H    3    0.15372      0.00000     0.84324    0.00304     0.84628
     H    4    0.15373      0.00000     0.84323    0.00304     0.84627
     O    5   -0.55583      1.99983     6.54975    0.00625     8.55583
     C    6   -0.21532      1.99921     4.20689    0.00921     6.21532
     H    7    0.15372      0.00000     0.84324    0.00304     0.84628
     H    8    0.18579      0.00000     0.81317    0.00105     0.81421
     H    9    0.15372      0.00000     0.84324    0.00304     0.84628
=======================================================================
  * Total *    0.00000      5.99825    19.96282    0.03893    26.00000
|
| Bond/Orbital Coefficents/Hybrid | File:Hybrid NAO siloxane1.txt | File:Hybrid NAO dimethyether.txt |
The Bond/orbital/Hybrid section provides a wealth of information regarding the bonding within the molecule by describing the orbital contributions. We can clearly see that for Si-H bond the majority of the electron density from Si (73%) comes from the p orbitals with only 1.6% being contributed from the d orbitals, suggesting sp3 hybridization. However, 62% of the electron density in the Si-H bonds comes from the 1s orbital of Hydrogen. As we begin to inspect the Si-O bond we see the majority of the Si contribution (13.66%) comes from the p orbital (75%). However, 86% of this bond is contributed from s and p orbitals on oxygen in the approximate ratio of 1:1.36 respectively. We see very little contribution to bonding from the d orbitals on silicon but as we move to the RY* section we see d orbital contributions rise to figures around 90% suggesting significant d orbital involvement. We see a similar picture for dimethylether with no involvement of d orbitals. We observe a much larger contribution from C to the C-H bond with similar orbital contributions to that observed for the disiloxane, suggesting sp3 hybridization. When we analyze the bonding picture for the C-O bond we can see that most of the electron density (66%) is contributed from the p orbitals on the oxygen, we see a large p orbital contribution for disiloxane.
Frequency analysis
| Disiloxane | dimethyl ether |
|---|---|
Full mass-weighted force constant matrix:
Low frequencies ---   -1.3151   -0.0019   -0.0014    0.0024    0.1897    3.1051
Low frequencies ---   43.5333   53.8757  125.1093
                                          A                      A                      A
Frequencies --    43.5331                53.8757               125.1093
Red. masses --     1.9569                 1.0141                 3.8295
Frc consts  --     0.0022                 0.0017                 0.0353
IR Inten    --     1.3073                 0.0000                 0.4656
|
Full mass-weighted force constant matrix: Low frequencies --- -14.7322 -14.6333 -14.0525 -0.0011 -0.0011 -0.0010
Low frequencies --- 212.6885 231.0081 395.4438
A A A
Frequencies -- 212.6692 231.0074 395.4438
Red. masses -- 1.0296 1.3072 2.3006
Frc consts -- 0.0274 0.0411 0.2120
IR Inten -- 0.0000 9.1627 3.5245
|

The frequencies for the disiloxane and carbon analogue were calculated using the additional words pop=(full,nbo). The low frequency output can be seen above and the main high frequency vibrations are tabulated below. We can see that no significantly negative values were obtained, suggesting a successful calculation. The tabulated vibrations can be seen below.
| Frequency | Intensity | Animation | Description |
|---|---|---|---|
| 395 | 3.5 | Animate | C-O scissoring |
| 873 | 27 | Animate | C-O symmetric stretch |
| 1079 | 65 | Animate | C-O rocking |
| 1163 | 43 | Animate | CH3 wagging and C-O rocking |
| 1520 | 18 | Animate | C-H rocking |
| 1530 | 17 | Animate | C-H assymetric scissoring |
| 2961 | 57 | Animate | C-H deformed asymmetric stretch |
| 2973 | 64 | Animate | C-H Symmetric stretch |
| 3019 | 169 | Animate | C-H Symmetric rocking |
| 3126 | 29 | Animate | C-H Asymmetric stretch |
| 3129 | 30 | Animate | C-H symmetric stretch |
| Frequency | Intensity | Animation | Description |
|---|---|---|---|
| 125 | 0.5 | Animate | C-O scissoring |
| 616 | 0.4 | Animate | C-O symmetric stretch |
| 753 | 117 | Animate | C-H2 Symmetric twisting |
| 766 | 105 | Animate | Symmetric wagging |
| 956 | 157 | Animate | Symmetric CH rocking |
| 960 | 828 | Animate | Symmetric CH3 wagging |
| 962 | 134 | Animate | Symmetric C-H scissoring |
| 1027 | 38 | Animate | Symmetric CH3 wagging |
| 1095 | 269 | Animate | C-O rocking |
| 2198 | 38 | Animate | C-H Assymetric stretch |
| 2202 | 284 | Animate | C-H2 symmetric rocking |
| 2208 | 147 | Animate | C-H2 symmetric stretch |
| 2228 | 99 | Animate | C-H assymetric stretch |
| 2232 | 98 | Animate | C-H symmetric stretch |
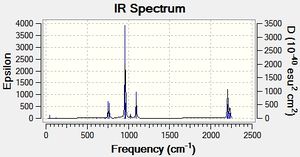
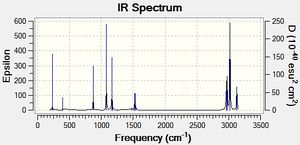
The major chracteristic difference can be found for the C-O symmetric stretch. The disiloxane stretching vibration was found 257cm-1 lower at 616cm-1 than the analogous vibration for Dimethylether. This suggests that despite the carbon analogue having a shorter C-O bond the Si-O bond is infact significnatly stronger. This is further supported by the siloxane scissoring motion being 270cm-1 lower at 125cm-1 than the dimethyl ether. However, the frequencies of the C-O rocking motion disagree with this assertation as the C-O rocking frequency is 16cm-1 lower a 1079. This difference is of an order magnitude lower than the Symmetric and Scissoring differences is therefore most likely caused by a small calculational error. Thus we can say with some degree of reliability that the Si-O bond is approximately 5.09*10^-21J more stable than the C-O bond.We can see from the spectra below that the two analogues can be easily distinguished from one another. For dimethylether we see a wider spread of peaks than the spectrum for Disiloxane. We would expect this to be a result of larger number of IR active peaks for dimethyl ether. This is supported by the fact that the for the calculated frequencies the Disiloxane has 7 zero intensity peaks whereas the dimethyl ether has 6. This could be caused by various effects, including symmetry constraints and larger changes in dipole moments. Furthermore, we would expect lower frequency vibrations for the electron withdrawing substituents as Si-O bond strength increases. In addition, the EW substitents would force the molecule towards a more linear structure with greater symmetry due to various effects (discussed later). Thus, we would expect fewer IR active peaks due the afforded symmetry and loss of dipole moment.
| Disiloxane | Dimethylether |
|---|---|
 |
 |
Conclusions
To conclude, throughout the mini project various techniques have been used to elucidate and rationalize the Si-O bond strength. We began the mini project by testing various basis sets and methods outlined in literature to obtain a bent angle which corresponded to the literature. Once the MP2/6-311G method was isolated as being the most accurate, d orbital contributions were taken into account to improve the accuracy of the optimizations. Thus, the MP2/6-311G(2d) basis set was determined as being the most accurate which is in agreement with that reported in the literature. Thus, once we had determined an accurate method with a basis set that accurately described the d orbital contributions the geometric isomers of the disiloxane were optimized. The results suggested that there was free rotation around the bond as both isomers had the same energy values. MO comparisons were then made with a carbon analogue (dimethylether), the results showed that both analogues had very similar molecular orbitals with some minor discrepancies. This was what we expected as the qualitative MO diagram for both analogues were exactly the same with different occupancies. We observed a greater delocalisation for the dimethyether, which we attributed to a larger bent angle allowing neighboring carbons to electronically interact with one another.
Three disubstituted disiloxanes were optimized to decipher the substituent effect on the geometric parameters. We observed a slight constriction of the Si-O bond length, this effect was rationalized as a result of electron density on the oxygen being dragged towards the substituents, pulling electron density over the Si-O bond. The results clearly showed that as we increased the EW character of the substituents the bond angle moved towards linearity as polar and coulombic repulsion effects increased, widening the bond angle. We would expect that electron withdrawing substituents would increase the polarity and contract the d orbital functions leading to a more open angle via increased p-d overlap [48]. Strengthening the bond as the positive charge on Si increases, creating a stronger electrostatic attraction. Thus, we can enforce linearity through steric repulsion and steric bulk. We would expect the opposite to be true for electropositive ED substituents. In the diol example we can see that its electron withdrawing effects of Oxygen are countered by resonance and electron donation, resulting in only small geometric changes. Furthermore, the NAO analysis provided a wealth of information regarding the contributions to bonding. The main observation was that the d orbitals only contributed approximately a 1.5% to bonding, thus making the p-d model unlikely. Despite, the minor role of d orbitals in determining the bent angle they are important in facilitating electronic charge flow from oxygen to silicon. teh results suggest taht for linear disiloxanes the d-p interaction would be favored. Literature reports a small barrier to bending of approximately 1Kcal/mol but also suggests a high compliance of the Si-O-Si bend from second order Jahn-Teller coupling [49]. Nevertheless, a more accurate rationalization is that the oxygen lone pairs donate into the σ* orbital of Si-H bond. This σ* orbital is expected to be much lower in energy than the d orbital on Silicon, so we would expect a much stronger interaction. In conclusion, d orbital interactions are unlikely and the p-σ* model appears to describes the experimental situation more accurately. The d-p and p-σ* interactions are shown below.

References:
- ↑ http://www.gaussian.com/g_tech/g_ur/k_opt.htm
- ↑ The Ab Initio Limit Quartic Force Field of BH3 MICHAEL S. SCHUURMAN, WESLEY D. ALLEN, HENRY F. SCHAEFER III Center for Computational Chemistry, University of Georgia, Athens, Georgia 30602-2525Received 3 February 2005; Accepted 4 March 2005DOI 10.1002/jcc.20238
- ↑ http://hdl.handle.net/10042/to-12143
- ↑ M. Jacox, Vibrational and Electronic Energy Levels of Polyatomic Transient Molecules, J. Phys. Chem. Ref. Data, 1994, Monograph 3
- ↑ M. Jacox, Vibrational and Electronic Energy Levels of Polyatomic Transient Molecules, J. Phys. Chem. Ref. Data, 1994, Monograph 3
- ↑ M. Jacox, Vibrational and Electronic Energy Levels of Polyatomic Transient Molecules, J. Phys. Chem. Ref. Data, 1994, Monograph 3
- ↑ M. Jacox, Vibrational and Electronic Energy Levels of Polyatomic Transient Molecules, J. Phys. Chem. Ref. Data, 1994, Monograph 3
- ↑ M. Jacox, Vibrational and Electronic Energy Levels of Polyatomic Transient Molecules, J. Phys. Chem. Ref. Data, 1994, Monograph 3
- ↑ Structure of Thallium(II1) Chloride, Bromide, and Cyanide Complexes in Aqueous Solution Johan Blixt3 Julius Glaser,*J Jhos Mink$?* Ingmar Persson,* Per Perssondl and Magnus Sandstr;dm*vi:doi/pdf/10.1021/ja00123a011
- ↑ J. Davies, et al., J. Chem. Soc A, 1968, pp.2050-2054
- ↑ J. Davies, et al., J. Chem. Soc A, 1968, pp.2050-2054
- ↑ J. Davies, et al., J. Chem. Soc A, 1968, pp.2050-2054
- ↑ J. Davies, et al., J. Chem. Soc A, 1968, pp.2050-2054
- ↑ J. Davies, et al., J. Chem. Soc A, 1968, pp.2050-2054
- ↑ J. Davies, et al., J. Chem. Soc A, 1968, pp.2050-2054
- ↑ http://hdl.handle.net/10042/to-12144
- ↑ http://hdl.handle.net/10042/to-12145
- ↑ http://hdl.handle.net/10042/to-12146
- ↑ http://hdl.handle.net/10042/to-12147
- ↑ http://hdl.handle.net/10042/to-12148
- ↑ http://hdl.handle.net/10042/to-12149
- ↑ F. A. Cotton, D. J. Darensbourg, S. Klein, B. W. S. Kolthammer, Inorg. Chem., 1982, 21 (1), 299 DOI:10.1021/ic00131a055
- ↑ 4.0 4.1 4.2 G. Hogarth, T. Norman, Inorganica Chimica Acta, 1997, 254 (1), 167 DOI:10.1016/S0020-1693(96)05133-X
- ↑ E. C. Alyea, G. Ferguson, J. F. Gallagher, S. Song, Acta. Cryst., 1994, C50, 1084-1087
- ↑ N. R. Champness, A. M. Hopkins, G. Reid, Acta. Cryst., 1996, C52, 797-799
- ↑ http://hdl.handle.net/10042/to-12150
- ↑ http://hdl.handle.net/10042/to-12151
- ↑ http://hdl.handle.net/10042/to-12150
- ↑ ↑ E. C. Alyea, S. Song, Inorg. Chem., 1995, 34 (15), 3873 DOI:10.1021/ic00119a006
- ↑ http://hdl.handle.net/10042/to-12162
- ↑ E. C. Alyea, S. Song, Inorg. Chem. 1995, 34 (15), 3864–3873 DOI:10.1021/ic00119a006
- ↑ CRC Handbook of Chemistry and Physics, 91st Edition, ed. W.M.Haynes, 2011, 9-69 [1]
- ↑ Density functional study of the equilibrium geometry and Si-0-Si potential energy curve of disiloxane GBbor I. Csonka, J6zsef R6ffyReceived 23 May i994; in final form 22 August 1994[Online] http://dx.doi.org/10.1016/0009-2614(94)01029-3
- ↑ Study of Bond Angles and Bond Lengths in Disiloxane and Related Molecules in Terms of the Topology of the Electron Density and Its LaplacianRonald J. Gillespie* and Samuel A. Johnson Department of Chemistry, McMaster University, Hamilton, Ontario, L8S 4M1 Canada
- ↑ An ab Initio Study on the Potential Energy Surface of Large-Amplitude Motions for Disiloxane Jacek Koput Department of Chemistry, Adam Mickiewicz University, 60-780 Poznan, Poland, and Institute of Physical Chemistry, Justus Liebig University, 35392 Giessen, Germany
- ↑ http://hdl.handle.net/10042/to-12161
- ↑ Density functional study of the equilibrium geometryand Si-0-Si potential energy curve of disiloxane GBbor I. Csonka, J6zsef R6ffy Received 23 May i994; in final form 22 August 1994
- ↑ http://hdl.handle.net/10042/to-12156
- ↑ http://hdl.handle.net/10042/to-12159
- ↑ http://hdl.handle.net/10042/to-12155
- ↑ http://hdl.handle.net/10042/to-12158
- ↑ http://hdl.handle.net/10042/to-12160
- ↑ J. Phys. Chem. 1995,99, 15874-15880 An ab Initio Study on the Potential Energy Surface of Large-Amplitude Motions for Disiloxane Jacek Koput Department of Chemistry, Adam Mickiewicz University, 60-780 Poznan, Poland, and Institute of Physical Chemistry, Justus Liebig University, 35392 Giessen, Germany
- ↑ http://hdl.handle.net/10042/to-12152
- ↑ http://hdl.handle.net/10042/to-12153
- ↑ http://hdl.handle.net/10042/to-12157
- ↑ http://hdl.handle.net/10042/to-12154
- ↑ BOND ANGLES INDISILOXANE: A PSEUDO-POTENTIAL ELECTRONIC STRUCTURE STUDY, Volume 81, number 3 C.A. ERNST, A.L. ALLRED, Mark A. RATNER Department of Chemistry, Northwestern University, Evanston, lllinois 60201, USA Received in final form 26 April 1981
- ↑ BOND ANGLES INDISILOXANE: A PSEUDO-POTENTIAL ELECTRONIC STRUCTURE STUDY, Volume 81, number 3 C.A. ERNST, A.L. ALLRED, Mark A. RATNER Department of Chemistry, Northwestern University, Evanston, lllinois 60201, USA Received in final form 26 April 1981
