Carolynmodule1
Module 1: Organic
The Hydration of Cyclopentadiene Dimer
 |
 |
 |
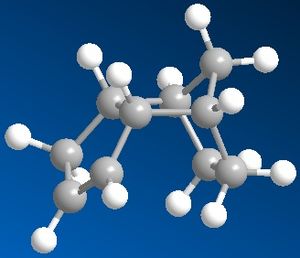 |
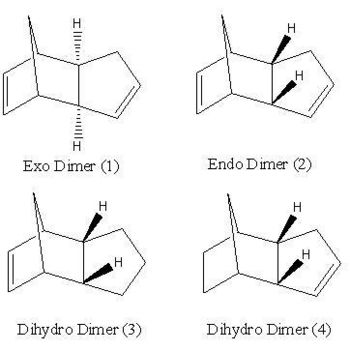
Clopentatiede dimerises to give a pair of isomeric products; the endo and the exo product (shown). It has been found that cyclopentadiene dimerises to give the endo dimer as the exclusive product. The relative stabilities of the exo and endo dimers indicate which of the two products is the most strained and/or hindered in a thermodynamic sense. Using Chem3D the geometries of the endo and the exo dimer were optimised using the MM2 force field option. The corresponding energies of the two dimers together with those of the two dihydro products are given in the table below.
Analysis of the Exo and Endo Products
The total energies of the exo dimer and of the endo dimer were calculated to be 133.4 and 142.3 kJ/mol respectively. This indicates that the exo product is the most stable and hence is the thermodynamic product. The endo product, the one that is formed exclusively, is therefore the kinetic product as it is the least stable of the two dimers. This result can be rationalised through the consideration of the mechanism for the formation of the two dimers. If the reaction was in equilibrium, then the thermodynamic product, the exo product, would be formed exclusively as it is the most stable/has the lowest energy. An irreversible reaction is therefore under kinetic control as the reaction pathway goes via the most stable transition state (the lowest activation energy)to form the kinetic product. There is not enough subsequent energy left in the system for the products to equilibrate back to the reactants and allow for any formation of the thermodynamic product. As cyclopentadiene dimerises rapidly through an irreversible diels-alder reaction, it can be concluded that cyclodimerisation reaction is under kinetic control.
From the table below, the largest contribution to the total energy of both the endo and exo product in the 'bend' contribution. This indicates a there is a large amount of strain inherent in the conformation of the two products. The difference in stability of the two products arises from the steric clash experienced between the two hydrogens, shown, and the bridgehead of the two cyclopentadiene rings. In the case of the exo product, the two hydrogens are on the opposite side of the molecule compared to the bridgehead thereby minimising the steric cash between them. Hence this is the more stable of the two dimers with the lowest overall energy. However, in the case of the endo product the two hydrogens are on the same side as the bridgehead and therefore the steric clash experienced increases the energy of the molecule and hence the endo product is the least stable of the to dimers.
Analysis of the Two Dihydro Derivatives; Molecule 12 and 13
Hydrogenation the endo dimer (2) results in the formation of two possible dihydro derivatives, molecule 3 or 4. Using molecular mechanics, it is possible to predict which of the two double bonds in molecule 2 is hydrogenated more easily through the calculation of the relative energies of the products formed. From this a prediction can be made as to which of the two dihydro products is formed based on thermodynamics. The energies of the two dihydro products were calculated using the same method as described above. It was calculated the products 3 and 4 have an overall energy of 149.3 kJ/mol and 130.4 kJ/mol respectively. This indicates that dihydro product 4 is the most stable as it has the lowest overall energy and hence is the thermodynamic product. The individual energies displayed in the table give an indication why product 3 is less stable than product 4. The largest difference in energy comes from the 'bend' contribution to the total energy. The energy associated with a 'bend' is that arising from stretching or compressing the bond angles, within a molecule, from their optimum sizes. The result is an increased amount of strain associated with the molecule when it adopts that particular conformation and hence causes the overall energy of the molecule to increase and it's stability to decrease.
| Energies | Exo Dimer | Endo Dimer | Dihydro Product 3 | Dihydro Product 4 |
|---|---|---|---|---|
| Stretch | 5.4 | 5.3 | 5.4 | 4.2 |
| Bend | 86.1 | 87.4 | 83.6 | 60.8 |
| Stretch-Bend | -3.5 | -3.5 | -3.5 | -2.3 |
| Torsion | 32.1 | 39.8 | 44.8 | 52.3 |
| Non-1,4 VDW | -5.922 | -6.5 | -5.2 | -4.5 |
| 1,4 VDW | 17.7 | 17.9 | 23.5 | 18.8 |
| Dipole/Dipole | 1.6 | 1.9 | 0.7 | 0.6 |
| Total Energy | 133.4 | 142.3 | 149.3 | 130.4 |
Stereochemistry of Nucleophillic Additions to a Pyridinium Ring
Using ChemBio 3D a model of molecule 5 and molecule 7 was created and their energies minimised using the MMFF94 force field. The geometries of these two staring materials were altered and different energy minima were obtained. In my search for the global minima for these two molecules, the geometry of the carbonyl oxygen in particular was altered and also any groups that may interact with the oxygen's new orientation were altered. The calculations were then re-submitted until a global minima of the total energy of the molecule could be found. The total energies stated below are, in my opinion, the global minima energies for the two molecules because even slight manual alterations in their geometries always produced a higher energy than what is stated.
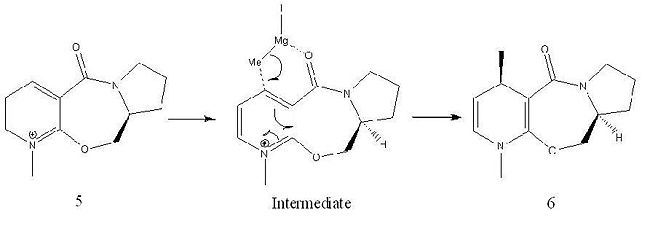
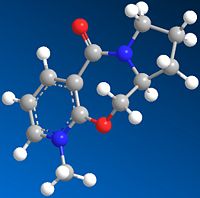
The conformation of "Molecule 5", shown, gave the lowest total energy of 240.6 kJ/mol. As the picture shows, the most stable geometry is when the carbonyl oxygen is orientated above the plane of the pyridial ring. The reaction scheme below rationalises the stereochemistry shown in product molecule 6 from the methylation of molecule 5, using methyl magnesium iodide, in the 4-position. Magnesium is electropositive and hard, the carbonyl oxygen is electronegative and also hard. Therefore it is favourable for the Grignard magnesium to coordinate to the carbonyl oxygen as depicted in the intermediate species, shown above. Methylation of the aromatic ring in the 4-position therefore occurs through an intramolecular reaction via a 6-membered transition state and the metlyl group is delivered on the same face as the carbonyl oxygen (above the plane of the pyridial ring). The selectivity of the above reaction is relatively high using methyl magnesium iodide and is stated to be 19:1 in the literature. However, if the methyl group was to be replaced with a group of increased steric bulk the regio-selectivity of the reaction can be increased up to 99:1[1].
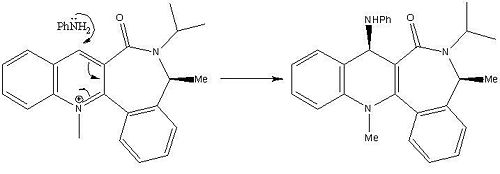
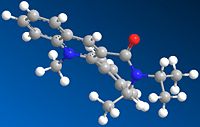
The stereochemistry of "molecule 7" depicted in the picture is that of the lowest energy conformation with a total energy of 411.3 kJ/mol. The picture shows molecule 7 with the carbonyl group pointing down below the plane of the pyridie ring, the isopropyl group in the plane of the molecule, the methyl group (on the 7-membered ring) pointing up and the pyridial methyl group in the plane of the molecule.
The absolute stereochemistry observed is due to streic effects rather than electronic effects (observed for molecules 5 and 6). As the conformation with the global minimal energy depicts the carbonyl pointing down below the plane of the pyridine ring, this allows for an unhindered nucleophilic attack on the carbon in the 4-position from above the plane of the molecule. As a result the NHPh group is delivered to the top face of the molecule, anti to the carbonyl group. The high stereoselectivity is achieved due to the NHPh group being bulky and so is forced to attack from the opposite side of the molecule to where the carbonyl group is located so to avoid steric clash between them which will destabilise the molecule.
The Grignard reagent was not incorporated into the structure of molecule 5 when running the MMFF94 calculations because ChemBio 3D has not been programmed to identify metals. Additionally, as the structure would require a representation of a chelating bond (not a full bond) the MM2 and MMFF94 methods would not recognise these bonds and so would not be able to minimise the energy of the structure. The MM2 and MMFF94 calculations do not take into account bonds breaking (or partial bonds) and so are not the best models to use for the analysis of these reactions. A better representation of the energies of the molecules would be achieved if better models were used e.g. Gaussian or MOPAC.
Stereochemistry and Reactivity of an Intermediate in the Synthesis of Taxol
Molecules 9 and 10 are possible intermediates in the total synthesis of taxol an important drug used in the treatment of ovarian cancer [2]. The two intermediates depict the carbonyl group pointing up (intermediate 9) or down (intermediate 10). Intermediates 9 and 10 were analysed using ChemBio 3D and their energies were minimised using the MM2 force field. The example of intermediates 9 and 10 are cases of atropisomerism as both these intermediates isomerise to give an alternate isomer. Atropisomers are stereoisomers that result from the hindered rotation about single bonds where the inherent barrier to rotation is so high it allows for the two conformations to be isolated[3].
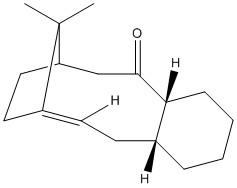
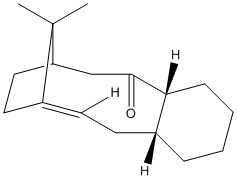
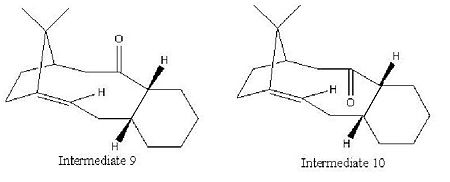
The corresponding total energies for intermediate 9 and intermediate 10 are 227 kJ/mol and 180 kJ/mol respectively. Therefore intermediate 10 has the most stable conformation. Obtaining the global minimal energy for the two intermediates took manual manipulation of the geometry of the cyclohexane ring. Intermediate 10 adopted its most stable configuration with minimal manual manipulation of its geometry. It was found that the most stable configuration of intermediate 10 is when the cyclohexane ring in the chair conformation. Obtaining the global minimal energy of intermediate 9 was however more difficult. On minimising its energy, using the MM2 force field, the conformation automatically changed to be like that of molecule 10. It took several attempts at changing the geometry of the molecule to find the most stable configuration of molecule 9 with the carbonyl group still pointing up. It was found that the most stable conformation of the cyclohexane ring within intermediate 9 is that of the twist boat. This is a more strained and therefore less stable configuration compared to that of intermediate 10 in which the cyclohexane ring adopts a chair conformation. Additionally, as intermediate 9 has the carbonyl group pointing up, it will experience steric clash with the bulky bridgehead, which is on the same side of the molecule, and also transannular strain with the adjacent hydrogens located on the same face of the ring. Intermediate 10, in contrast, adopts a conformation with the carbonyl group pointing down, i.e. on the opposite side of the molecule to the bulky bridgehead. As a result, although the relative transannular strain will be present, the steric clash with the bridgehead is significantly reduced and hence the overall energy of the intermediate is reduced.
It has been noted that subsequent functionalisation of the alkene is an abnormally slow reaction. This is because the alkene can be described as a 'hyperstable olefin'. From the literature[4], it was first noted by Bredt that double bonds tend to avoid the ring junctions within camphane and pinane cyclic systems. However, it was later observed by Maier and Schleyer that in medium sized cyclic systems the presence of a bridge head double bond may in fact be favourable. This observation can be rationalised through the comparison of the energy of the hyperstable olefin and its parent hydrocarbon. 'Hyperstable olefins' have negative olefin strain energies (OS), in other words the associated strain energy of the olefin is less than that of its parent hydrocarbon thus the olefin is the more stable. When the alkene is hydrogenated, the total energy of the molecule increases. This increase in energy is due to changing the hybridisation of the carbon atoms in the associated C=C double bond from sp2 hybridisation to sp3 to form a C-C single bond. In doing so the bond angles change from 120o to 109o respectively. This decrease in bond angle is directly related to the increase in the total energy of the molecule as it causes an increase in the torsional strain within the molecule and hence decreases in its stability.
When the energies of intermediates 9 and 10 are minimised using the MMFF94 force field they were calculated to be 295 kJ/mol and 277 kJ/mol respectively. Although, this method gives them same result as the MM2 method in terms of which is the more stable intermediate, it does however calculate the energies of 9 and 10 to be considerably higher than those calculated by the MM2 method.
Modelling Using Semi-Empirical Molecular Orbital Theory
For the previous exercises (above) a purely classical mechanical molecular model was being used (MM2 and MMFF94). However, weaknesses in these methods were under covered. For example, in the section entitled 'stereochemistry of nucleophilic additions to a pyridinium ring' it was found that the MMFF94 method used did not provide an adequate representation of the energy of molecules 5 and 7 as the method cannot handle electronic aspects of reactions and how electrons affect bonds. This section illustrates moving away from a classical mechanical method and towards a quantum mechanical method as methods such as MOPAC can take into account the electronic aspects of a reaction and so can describe reactions in terms of molecular orbitals.
Regioselective Addition of Dichlorocarbene
Part 1
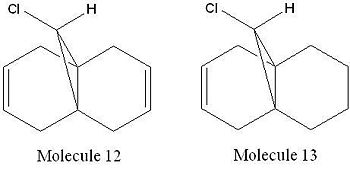
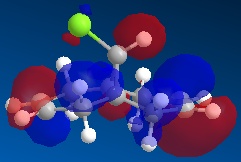
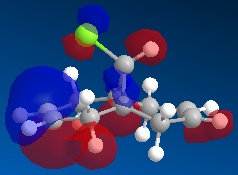
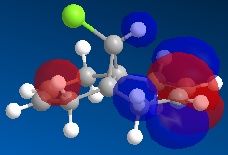
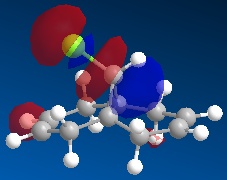
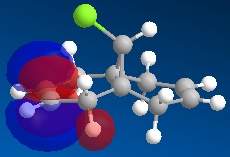
Using ChemBio 3D to model molecule 12, its energy and geometry was minimised and calculated using the MM2 force field. The MM2 force field calculated the total energy of molecule 12 to be 74.9 kJ/mol. Then using the MOPAC/PM6 method, which provides an approximate representation of the valence-electron molecular wavefunction, representations of the molecular orbitals could be visualised. The resulting HOMO, HOMO-1, LUMO, LUMO+1 and LUMO+2 molecular orbitals and are shown below (the images also show molecule 12 in its lowest energy conformation).
 |
 |
 |
 |
 |
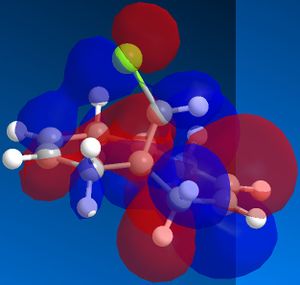
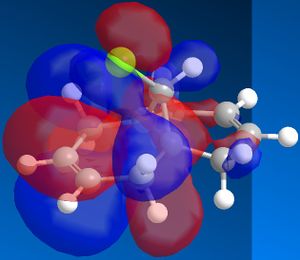
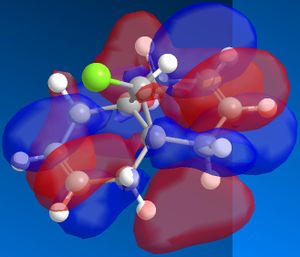
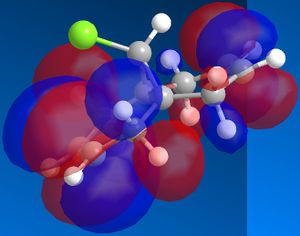
In order to achieve a better representation of the molecular orbitals that need to be considered, they were re-calculated using the DFT-based molecular orbital method The resulting molecular orbitals are notably different in appearance but show more clearly where the electron density is located within the molecule.
 |
 |
 |
 |
 |
From comparing the molecular orbitals calculated using the two different methods, it is clear they give notably different representations of the molecular orbitals on molecule 12. For example, the LUMO+1 (calculated using MOPAC methods) shows a similar representation as the LUMO+2 (calculated using DFT methods) i.e. they both show an antibonding interaction between the C and the Cl. As the DFT method gives a clearer representation of where the electron density is located within molecule 12, I have decided to use these MOs when further analysing the molecule.
Concentrating on the two C=C double bonds and the C-Cl bond, the main features displayed in the molecular orbitals (calculated using DFT methods) shown above are as follows;
- HOMO-1: This molecular orbital displays a bonding interation for both C=C double bonds, however there is much more electron density located on the anti C=C doulble bond. Additionally, there is a distinct bonding/stabilising interaction between the Cl antibonding orbital and the syn C=C bonding orbital.
- HOMO: This molecular orbital displays a strong bonding interaction for the syn C=C double bond.
- LUMO: This molecular orbital displays the antibonding orbitals for both the syn and anti C=C double bonds.
- LUMO+1: Agian this shows the antibonding MOs for the two C=C double bonds
- LUMO+2: This molecular orbital displays the antibonding orbital for the C-Cl bond with a larger amount of electron density being located on the Cl atom as it is more electronegative.
As can be seen from looking at the molecular orbital representation of the HOMO, there is a large amount of electron density located on the C=C double bond that is syn to the C-Cl bond. As it is presumed that the molecular orbital of the HOMO is the most susceptible towards electrophilic attack and as the syn C=C double bond displays the highest amount of electron density, it is the therefore the most nucleophilic part of the molecule. Therefore, if molecule 12 was to react with an electrophile, such as dichlorocarbene, it would be the syn C=C double bond that would be attacked as it is the most nucleophilic. As can be seen from looking at the molecular orbital representation of the HOMO-1, these is much more electron density located on the anti C=C double bond compared to the syn C=C double bond. This indicates that the anti C=C double bond is a poor nucleophile and as a result will not react very readily with the diclorocarbene electrophile.
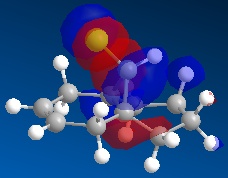
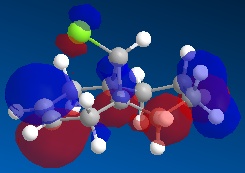
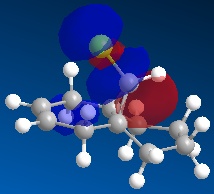
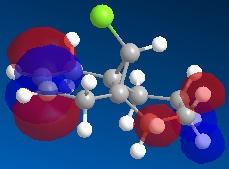
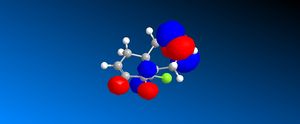
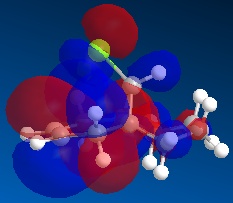
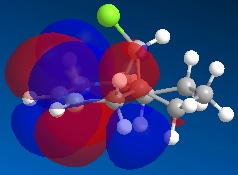
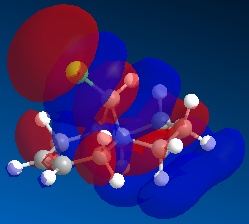
Molecule 13 is the hydrogenated version of molecule 12, i.e. the C=C double bond anti to the C-Cl bond had been replaced with a C-C single bond. The same procedure as for molecule 12 was carried out on molecule 13 and the resulting HOMO, HOMO-1, LUMO, LUMO+1 and LUMO+2 molecular orbitals obtained are shown below.
 |
 |
 |
 |
 |
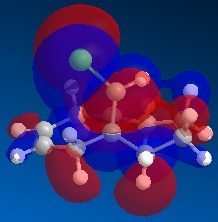
In order to achieve a better representation of the molecular orbitals that need to be considered, they were re-calculated using the DFT-based molecular orbital method The resulting molecular orbitals are notably different in appearance but show more clearly where the electron density is located within the molecule.
 |
 |
 |
 |
 |
Again, the representations of the molecular orbitals (shown above) calculated using the two different methods are notably different in appearance. For the same reasons as stated above I have decided to use the molecular orbitals calculated using the DFT method when analysing molecule 13 further.
Concentrating on the two C=C double bonds and the C-Cl bond, the main features displayed in the molecular orbitals (calculated using DFT methods) shown above are as follows;
- HOMO-1:This molecular orbital depicts an antibonding interaction along the C-Cl bond
- HOMO: This molecular orbital shows the syn C=C double bond bonding interaction, there is a lot of electron density located around the bond.
- LUMO:This molecular orbital shows the antibonding interaction of the syn C=C double bond.
- LUMO+1: This molecular orbital is showing an antibonding interaction of the C and Cl with more electron density located on the Cl as it the more electronegative of the two atoms.
Part 2
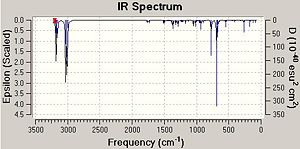
The influence of the C-Cl bond on the vibrational frequencies of the rest of the molecule is to be investigated, in particular the influence on the C=C double bonds. To do this molecule 12, a dialkene, and molecule 13, the hydrogenated derivative, will be compared. In the hydrogenation of Molecule 12, it is the C=C double bond that is anti to the C-Cl bond that has been replaced with a C-C single bond. The IR spectra and subsequent vibrational frequencies for the di- and mono-alkenes were obtained through submitting the appropriate job/calculation to the SCAN method.
The table below shows the resulting vibrational frequencies of the C=C double bonds and C-Cl bond for both molecule 12 and 13.
| Stretch | Dichlorocarbene (12) | Monoalkene (11) |
|---|---|---|
| C-Cl | 772 | 779 |
| C=C (anti to Cl) | 1740 | - |
| C=C (syn to Cl) | 1760 | 1753 |
 |
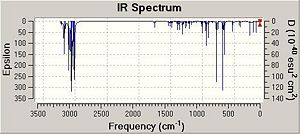 |
As can be seen from the table above, the stretching frequencies of C-Cl bond for molecules 12 and 13 are 772 and 779 cm-1 respectively. These values correspond with those stated in the literature of 600 - 800 cm-1 [5]. The IR spectrum obtained for molecule 12 depicted two peaks at 1740 and 1760 cm-2 these peaks are due to the anti and the syn C=C double bonds respectively. A peak at a lower frequency corresponds to a weaker bond and therefore it can be concluded that the anti C=C double bond is weaker that of the syn C=C double bond. These observations are opposite to those found in Part 1 where the syn C=C double bond was found to be the more reactive and therefore the weaker of the two double bonds. The literature states that the stretching frequency for a typical C=C double bond is 1630 - 1680 cm -1 [6]. Therefore, the stretching frequencies obtained for the C=C double bonds in molecules 12 and 13 are considerably higher than those stated in the literature. This stabilisation must be due to the presence of the electronegative Cl atom which is close proximity to the alkenes. Alternatively, it is possible that the anti C=C double bond is being destabilised in some way. From looking at the representation of the HOMO of molecule 12 (calculated using the DFT method), there appears to be an interaction between the bonding C=C orbital and the antibonding C-Cl orbital. Therefore, as the C=C bonding orbital is donating electron density into the unoccupied C-Cl antibonding orbital, the C=C bond is weakened.
Structure based Mini Project using DFT-based Molecular Orbital Methods
Regiochemistry in 1,3-Dipolar Cyloadditions of Azomethine Ylide Formed from Diethyl Aminomalonate and Paraformaldehyde[7]

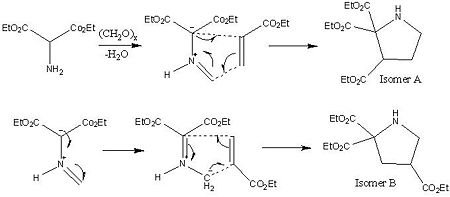
Many organic synthetic reactions give rise to a mixture of isomeric product. Therefore, it is very important to be able to separate these isomers, be able to distinguish between them and to identify which isomer has been formed. One of the best spectroscopic techniques used to distinguish between a pair of isomers is NMR as it provides information about molecular environments and connectivity. Other possible spectroscopic techniques are x-ray diffraction and optical rotation. You could also look at their melting points. For this project I will be investing whether, using DFT-based molecular orbitals method, the 13C NMR can be predicted to a high degree of accuracy for a pair of synthetically prepared isomers. I have chosen to investigate Isomers A and B (shown in the reaction scheme opposite) formed in a 1,3-dipolar cyloaddition of azomethine ylide, formed from diethyl aminomalonate and paraformaldehyde. Isomer A and B are regioisomers and so 13C NMR is a good analytical technique to distinguish between them.
NMR Analysis
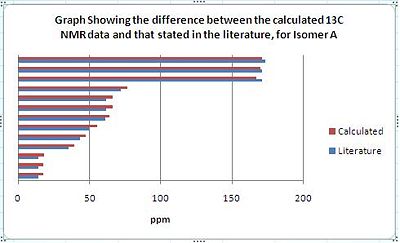
The predicted 13C NMR spectra for isomers A and B were calculated using the GIAO method and the results were then compared with the data stated in the literature[7]. The table below summarises the data obtained along with a list of the values stated in the literature[7] and the difference between the two. The difference between the two sets of data gives an indication of how accurately the 13C NMR spectra of isomers A and B can be predicted.
| Isomer A | Isomer B | ||||
|---|---|---|---|---|---|
| Literature | Calculated | ppm error | Literature | Calculated | ppm error |
| 13.9 | 17.0 | 3.1 | 14.0 | 17.5 | 3.5 |
| 13.9 | 17.0 | 3.1 | 14.0 | 17.5 | 3.5 |
| 14.0 | 17.5 | 3.5 | 14.1 | 18.2 | 4.1 |
| 30.6 | 35.7 | 5.1 | 35.7 | 39.6 | 3.9 |
| 45.8 | 47.8 | 2.0 | 43.7 | 47.2 | 3.5 |
| 49.6 | 49.8 | 0.2 | 50.0 | 55.3 | 5.3 |
| 69.9 | 59.4 | 1.5 | 60.9 | 64.3 | 3.4 |
| 62.0 | 60.9 | 1.1 | 62.0 | 66.2 | 4.2 |
| 62.1 | 61.9 | 0.2 | 62.0 | 66.2 | 4.2 |
| 75.1 | 79.5 | 4.4 | 72.2 | 76.4 | 4.2 |
| 169.5 | 170.8 | 1.3 | 170.8 | 167.2 | 3.6 |
| 170.0 | 172.8 | 2.8 | 171.0 | 169.6 | 1.4 |
| 172.6 | 173.8 | 1.2 | 173.1 | 170.7 | 2.4 |
 |
 |
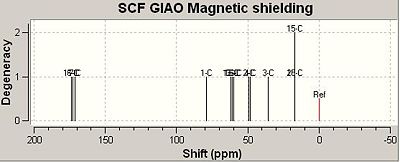
Using the GIAO method, the calculated IR spectrum for Isomers A and B are shown below;
 |
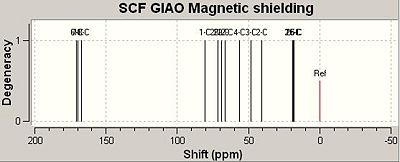 |
The two charts, shown above, graphically depict how the calculated NMR values compare to the literature values. It should be noted that the calculated values for isomer A correlate to the literature data better than the calculated data for isomer B. From comparing the calculated IR data with that stated in the literature it can be concluded that the GIAO method, although predicts fairly well the IR spectrum of a single molecule, does not distinguish between two pairs of isomers very well. As can be seen from the differences column in the table above, the calculated IR data was usually a few ppm numbers away from the value obtained empirically. As IR data obtained empirical for isomers are always very similar, as can be seen for Isomers A and B, the GIAO method cannot calculate an accurate enough prediction of the spectra to be able to distinguish with much certainty as to which isomer is which. Therefore, I would suggest the method be used to predict the IR spectra for molecules that are clearly defined and do not form isomers only. That been said, it should be noted that the predicted spectrum of isomer A was more accurate than that of isomer B. Additionally, the predicted spectrum of A correlates better to the empirical data for A than to the empirical data for B. Also, the predicted spectrum of B correlates better with the empirical data for B than with the empirical data for A. Therefore, on this basis the GIAO method could be used to make a weak prediction as to which isomer is which. However, it should be stressed that this predication is made with a large degree of uncertainty.
Analysis of the Mechanism for the Formation of Isomer A and B and their Energies
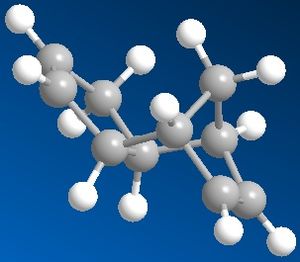
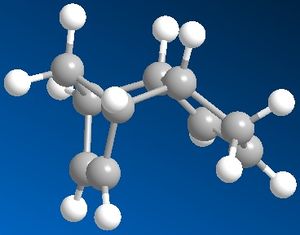
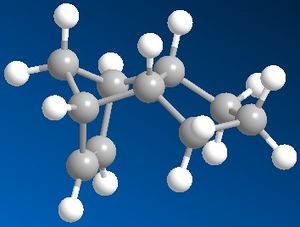
Isomers A and B were modelled using ChemBio 3D and their energies minimised using the MM2 MOPAC methods. The Optimised geometries of the two isomers are shown below.
 |
 |
 |
 |
Using the MM2 force-field, the calculated energies of isomer A and B are 270 and 205 kJ/mol respectively. Therefore, Isomer B is the more stable of the two. This is to be expected as there is less steric clash between the two ethylester substituents in the 2 position and the third ethyl ester when it is in the 4 position compared to being in the 3 position. However, it is reported in the literature that Isomer A is in fact the major isomer. This can be rationalised through the consideration of the mechanism its formation. The two resonance structures of the azomethine ylide are shown below. The first structure, leading to isomer A, is clearly the more stable of the two as the negative charge is located on a tertiary carbon with two adjacent ester stabilising groups. The second structure, although it leads to the more stable isomer B, has a negative charge located on a primary carbon with no stabilisation of this charge through hyperconjugation or ester stabilising groups. Therefore, the second resonance structure will make an extremely small contribution to the total structure of the azomethine ylide and hence Isomer A is the major isomer.
IR Analysis
The energies of Isomer A and B were first minimised using the MM2 force-field then their IR spectra and subsequent vibrational frequencies were obtained through submitting the appropriate job/calculation to the SCAN method. The tables below compare the differences between the calculated IR data with that stated in the literature[7].
| Stretch | Calculated frequency | Literature value | Frequency error |
|---|---|---|---|
| C=O (1) | 1809 | 1736 | 73 |
| C=O (2) | 1818 | 1736 | 82 |
| C=O (3) | 1826 | 1736 | 90 |
| N-H | 3544 | 3356 | 188 |
| Stretch | Calculated Frequency | Literature Value | Frequency error |
|---|---|---|---|
| C=O (1) | 1807 | 1735 | 72 |
| C=O (2) | 1810 | 1735 | 75 |
| C=O (3) | 1820 | 1735 | 85 |
| N-H | 3511 | 3356 | 155 |
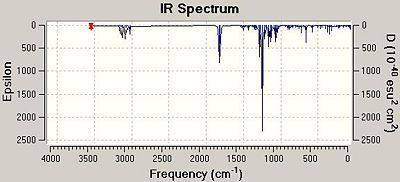
As can be seen from the two tables, the calculated IR data is quite different to that obtained empirically. Firstly, the SCAN calculated three individual stretching frequencies for the three different C=O bonds where as the literature only stated one single stretching frequency for the C=O bonds. Additionally, the calculated frequencies are all notably larger than those stated in the literature, between 72 and 188 cm-1. From this it can be concluded that the SCAN method for the calculation of IR data results in a poor representation for what is found empirically. In all cases it was found that the calculated value was a lot higher than the empirical value, this is due to the fact that the SCAN method runs a calculation based on the prediction that the molecule is in the gas phase. As a result an over prediction of the frequencies is made as when IR data is collected empirically the molecule is usually in solution or sometimes in the solid phase. Secondly, although the calculated NMR data does not correlate well with the empirical data it should be noted that the data for isomer A and for isomer B is relatively different and so could in theory be used to distinguish between them. This is not the case for the data stated in the literature, as can be seen in the tables; there is practically no difference between the two sets of data for isomer A and B. Therefore IR is not a good empirical technique to use to distinguish between two sets of isomers, where as computational techniques are potentially better methods.
 |
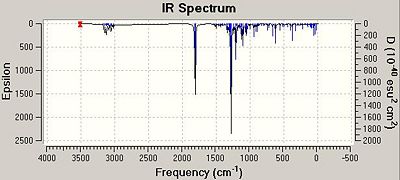 |
The adjacent images show the calculated IR spectra for Isomers A and B. On inspecting the spectra, there are 3 distinct peaks at around 1810-1820 cm-1 which correlate to the three C=O bonds within the two molecules. It can also be seen that all the C=O stretches and the N-H stretch are at a higher frequency value for isomer A compared to Isomer B suggesting that these bonds are slightly stronger within that isomer. This observation, however, is opposite to those made when analysing the energies of the two isomers as it was found that isomer B was the more stable of the two.
References
- A. G. Shultz, L. Flood and J. P. Springer, J. Org. Chemistry, 1986, 51, 838. DOI:Error: Bad DOI specified!
- http://www.ch.ic.ac.uk/wiki/index.php/Mod:organic#Stereochemistry_and_Reactivity_of_an_Intermediate_in_the_Synthesis_of_Taxol.
- S. W. Elmore and L. Paquette, Tetrahedron Letters, 1991, 319; DOI:Error: Bad DOI specified!
- A. B. McEwen, P. R. Schleyer, J. Am. Chem. Soc,.1986,108 (14), pp 3951-3960
- http://www2.ups.edu/faculty/hanson/Spectroscopy/IR/IRfrequencies.html
- http://www.cem.msu.edu/~reusch/VirtualText/Spectrpy/InfraRed/infrared.htm
- C.M. Blazey, C.H. Heathcock, J. Org. Chem, 2002, 67, 298-300.
