CP3MD MTP16
(This report has been plagiarised)
Introduction
In this lab, triatomic systems were explored using potential energy surfaces of the respective systems. The initial conditions were changed so that the theory of transition states could be explored.
EXERCISE 1: H + H2 system
What value do the different components of the gradient of the potential energy surface have at a minimum and at a transition structure? Briefly explain how minima and transition structures can be distinguished using the curvature of the potential energy surface.
The gradients of the different components of the potential energy surface at a minimum and transition state structure are 0. The minimum represents the equilibrium bond distance in the PES whereas the maximum represents the transition state. The transition state can be elucidated by finding a saddle point in the surface. Saddle points originate when one partial second derivative is positive and one is negative.
Report your best estimate of the transition state position (rts) and explain your reasoning illustrating it with a “Internuclear Distances vs Time” plot for a relevant trajectory.
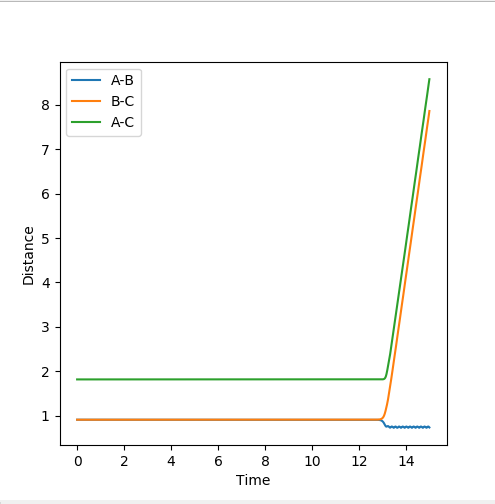
The best estimate of the transition state position is found to be r_1=r_2 = 0.90777Å using 3000 steps. The evidence for this is in the figure below.
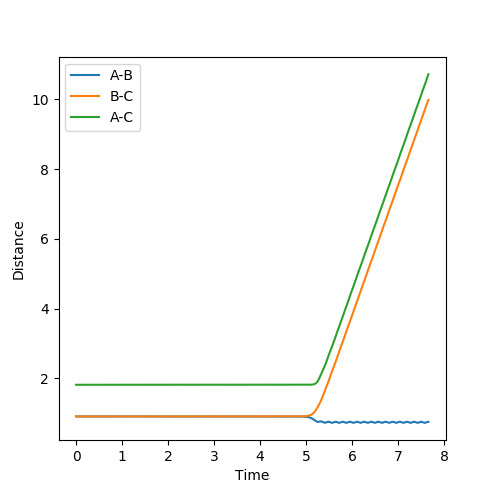
At this distance, the transition state is the longest lived (13 time periods) before forming AB. A trial and error approach using figures very close to 0.90777Å concluded that the position of 0.90777Å was the closest to the transition state position. Below shows a graph of r_1=r_2 = 0.90778Å using 3000 steps. It can be seen that the transition state only lasts for 5 time periods as opposed to 13 time periods.
Comment on how the mep and the trajectory you just calculated differ.
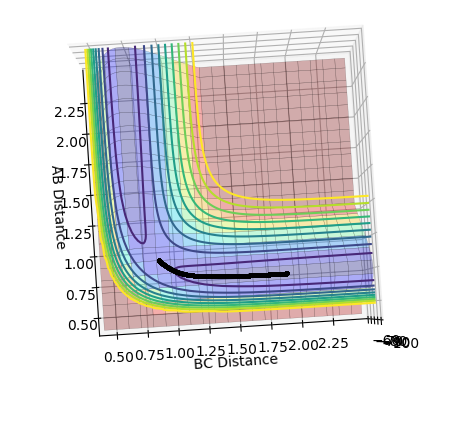
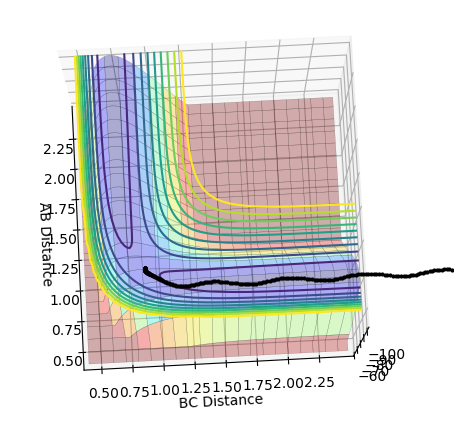
The MEP calculation shows a picture that does not take into account the vibrations of the molecule and therefore just follows the minima on the potential energy surface which means it does not have oscillations which appear in the dynamic picture as the bond forms. Therefore, the dynamics calculation shows a more realistic picture.
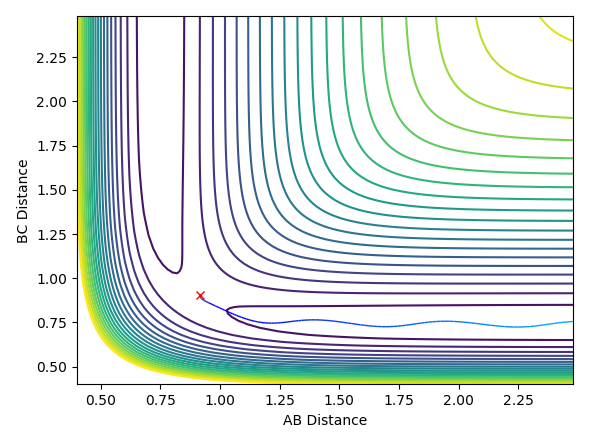
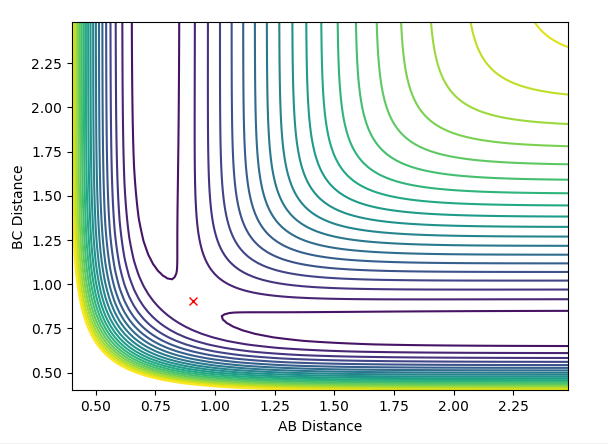
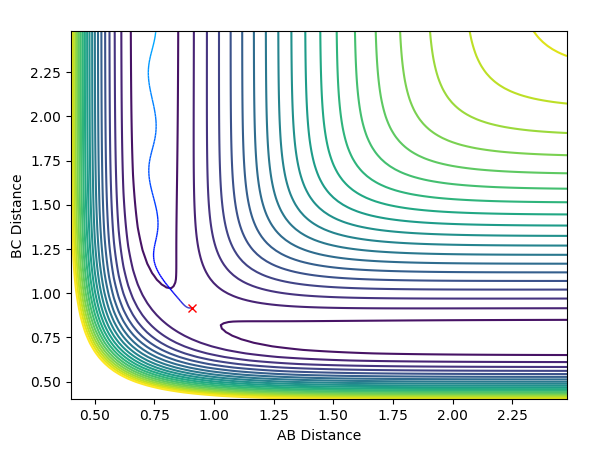
Look at the “Internuclear Distances vs Time” and “Internuclear Momenta vs Time”. Take note of the final values of the positions r1(t) r2(t) and the average momenta p1(t) p2(t) at large t. What would change if we used the initial conditions r1 = rts and r2 = rts+0.01 instead?
| Deviation of A-B distance to 0.9177 | Transition state AB=0.9077,BC=0.9077,AB/BC momentum=0 | Deviation of B-C distance to 0.9177 |
|---|---|---|
 |
 |
|
The middle graph shows the transition state because it is stationary and does not move. As the transition state is the highest point on the reaction coordinate, slight perturbations of the A-B and B-C distance by 0.01 mean that the reaction returns back to the products or the reactions depending on the perspective of the pathway
State what are the main assumptions of Transition State Theory. Given the results you have obtained, how will Transition State Theory predictions for reaction rate values compare with experimental values?
Transition State Theory uses the following assumptions
• Molecular systems which have crossed the transition state in direction of the products do not return back to reform the reactants
• The transition state is based on classical mechaniscs
• The complex passes through the lowest energy transition state on the PES
During the course of this exercise, the assumption that the products do not re-cross does not hold true as in some instances, with the correct conditions, there is enough energy in the system to overcome the energy barrier and then reform the reactant molecule which produces an unsuccessful reaction.
Although transition state theory is a good model for high energy barriers, with smaller energy barriers tunelling is also seen where the probability of a particle being present beyond the energy barrier is not forbidden, despite not having enough energy to overcome the activation barrier.
EXERCISE 2: F - H - H system
Classify the F + H2 and H + HF reactions according to their energetics (endothermic or exothermic). How does this relate to the bond strength of the chemical species involved?
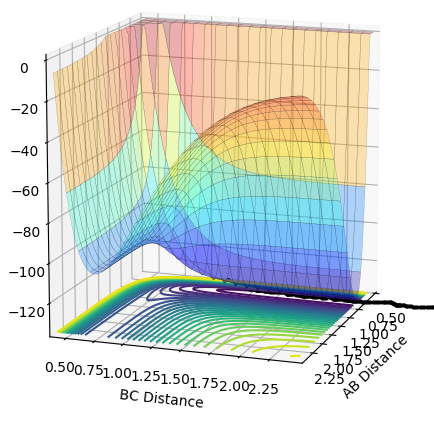
The PES above shows that the formation of the H-H bond is endothermic. By defining the AB distance as F-H and the BC distance as H-H, it can be seen that the relative energy of AB is lower than BC which corresponds to an endothermic reaction as stated previously. In contrast, formation of the F-H bond is exothermic as the relative energy of BC is higher than AB. These conclusions are supported by the fact that the H-H bond enthalpy is 413 kJ/mol and the H-F bond enthalpy is 569 kJ/mol.
Locate the approximate position of the transition state.
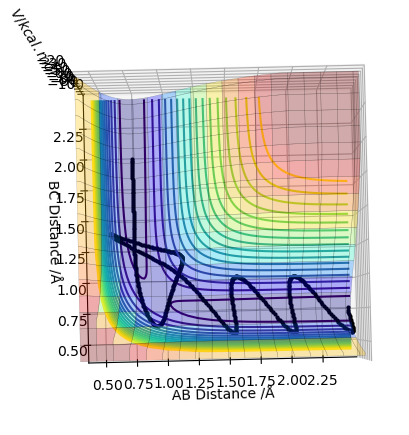
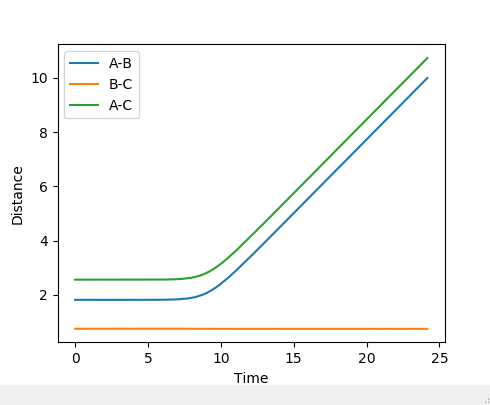
Hammond's postulate was applied to determine a reasonable location for the transition state, following the trajectory for an exothermic reaction by formation of HF, the TS will resemble the reactants and therefore the F-H distance will be much larger at the TS. Using dynamics calculation, The conditions are as follows: A-B = 1.8112, B-C = 0.7440, A-B momentum = B-C momentum = 0, Energy = -103.752 kjmol-1. The above figure shows no change in nuclear distance with time with 10 time periods before a deviation. Trial and error confirmed this was the closest structure because there were no oscillations with time for the longest period of time compared to other configurations. Therefore the current positions are close to the transition state but further optimization is required to obtain the exact coordinate in this system. After 10 time periods a deviation causes H-H to form which is not what is expected as the H-F bond is stronger, so looking at the PES from a downward view of HF formation should be energetically more favoured.
Report the activation energy for both reactions.
Activation energy of HH + F process ː -103.75 - (-104.02) = 0.27 kcalmol-1
Activation energy of HF + F process ː -103.75 - (-133.90) = 30.15 kcalmol-1
Reaction Dynamics
In light of the fact that energy is conserved, discuss the mechanism of release of the reaction energy. How could this be confirmed experimentally ?
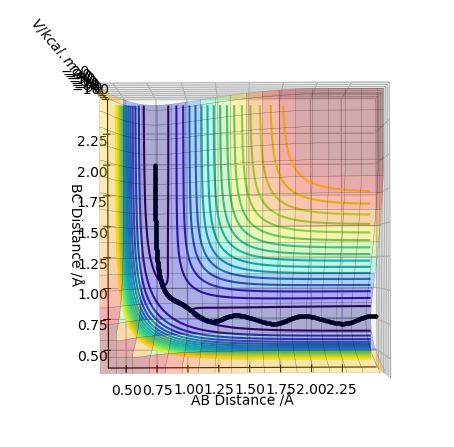
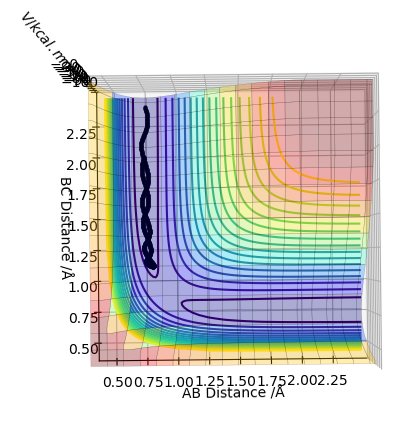
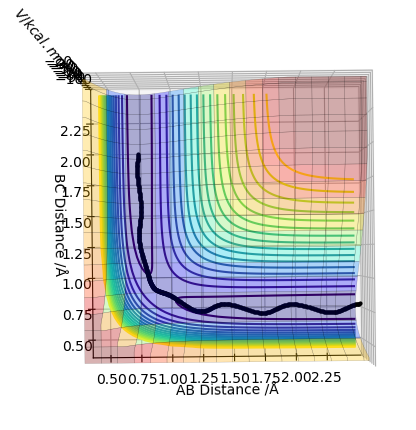
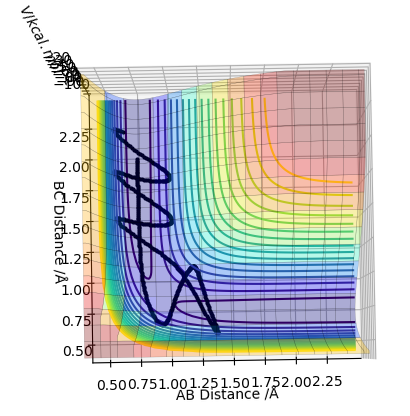
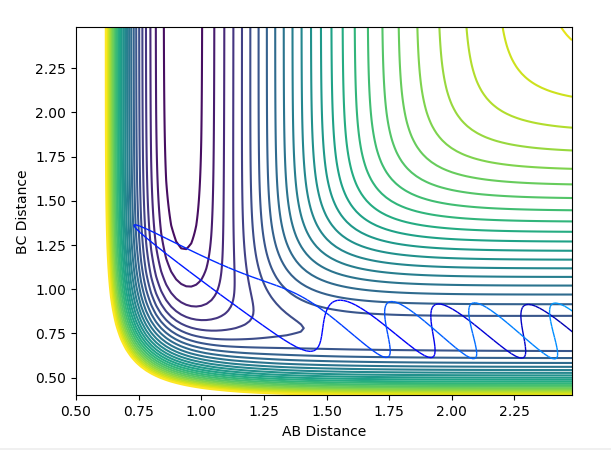
Discuss how the distribution of energy between different modes (translation and vibration) affect the efficiency of the reaction, and how this is influenced by the position of the transition state.
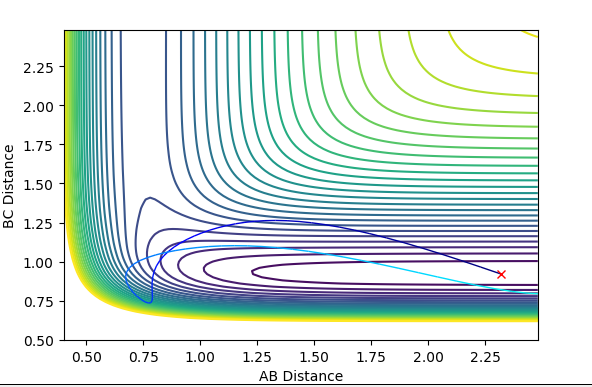
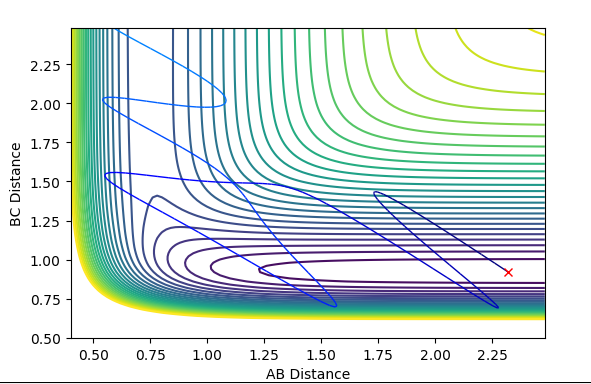
Initial Conditions: FH = 3.0, HH = 0.74
| P(HF) | P(HH) | Reaction Trajectory | Interatomic Distance vs Time | Dynamics contour plot | |
|---|---|---|---|---|---|
| 0 | -9 | not successful | 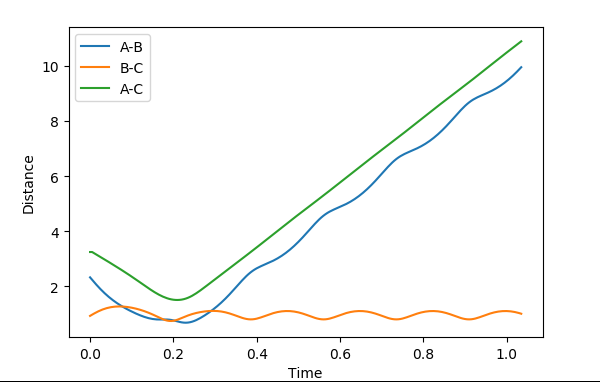 |
 |
|
| 10 | -1 | successful | 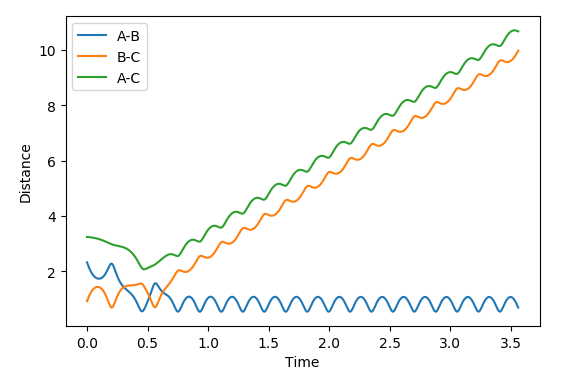 |
 |
|
| -4 | -5 | not successful | 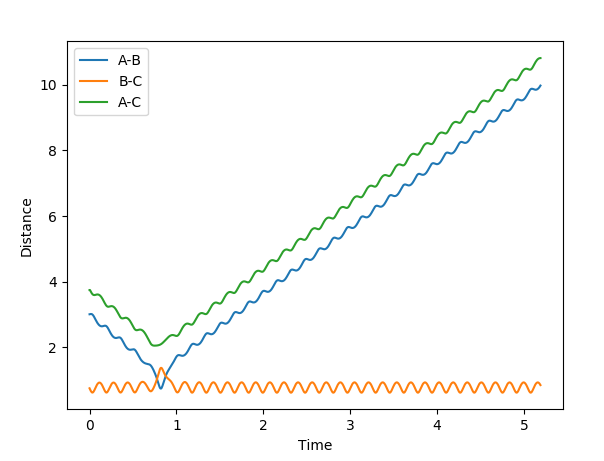 |
 |
|
| -12 | -3 | successful | 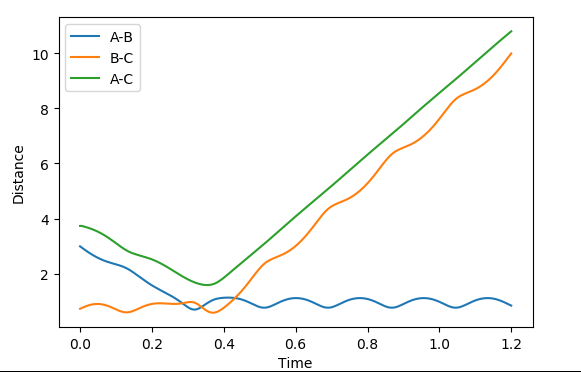 |
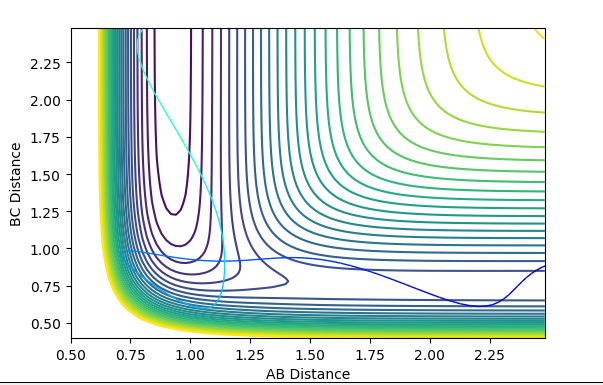 |
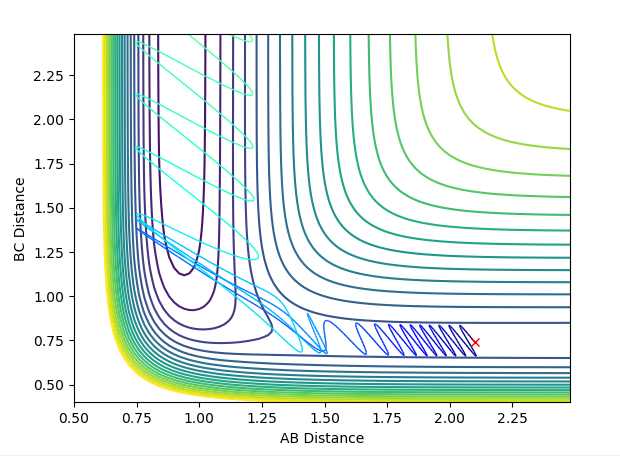
Polanyi's empirical rules state that vibrational energy promotes a late transition state compared to translational energy. In contrast translational energy is better at promoting an early transition state compared to vibrational energy. In the above table, I am demonstrating that the first two rows resemble an endothermic reaction of H + HF. The successful reaction trajectory highlights the large amount of vibrational energy needed thus Polanyi's rules are illustrated here. Whereas, the last two rows show the exothermic reaction of F + H2. In this case, the successful reaction trajectory highlights the large amount of translational energy to proceed to a successful reaction.

