Title:MRD:01199241
Molecular reaction dynamics lab
Two triatomic systems were explored in this wiki page. It was assumed that the atoms collide linearly with each other, using potential energy surface the energy of the systems were explored in order to locate the transition state in a reactive trajectory.In the first system, the transition state consisted of three Hydrogen atoms equally spaced, whereas for the second case a fluorine atom was exchanged for one of the hydrogens on the outside meaning that in the transition state the H--F distance was much larger than the H--H distance as the F atom is much more electronegative.
Mm10114 (talk) 17:47, 25 May 2018 (BST) Nice work with giving an introduction to the exercises. It helps the reader understand what is the purpose of the workshop and to show your commitment.
H-H-H Excercise 1
1) What value do the different components of the gradient of the potential energy surface have at a minimum and at a transition structure? Briefly explain how minima and transition structures can be distinguished using the curvature of the potential energy surface.
The gradient of the potential energy with respect to either axis of atomic distance is 0 at a minima or maxima in the potential energy surface.For the minima it represents an equilibrium bond distance in the potential energy surface, whereas for the maxima it represents a transition state. A small perturbation from the minima will cause it to oscillate around the equilibrium position whereas for a small pertubation around the maxima it will cause the system to rill down to a lower energy.
The transition state can be determined by finding a saddle point in the surface, which exists when one second derivative is positive and the other is negative
| ∂V(ri)/dɾi | ∂2V(ri)/∂i2 | |
|---|---|---|
| r1 | 0 | +ve |
| r2 | 0 | -ve |
2)Report your best estimate of the transition state position (rts) and explain your reasoning illustrating it with a “Internuclear Distances vs Time” plot for a relevant trajectory.
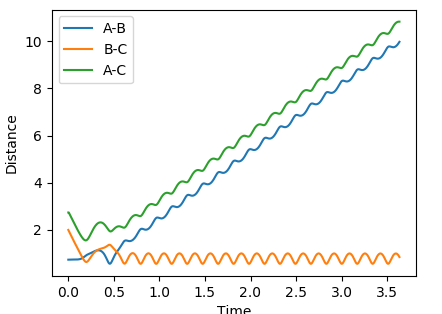
Using dynamics calculation and evaluating different distances the transition state distance was optimised as r_1 = r_2 = 0.90777Å. The figure below shows no change in atomic distance with time, for around 13 time periods before shooting of forming AB. After trial and error this was the closest structure showing no oscillations with time for the longest period of time. This shows that the current position of 0.90777Å is close enough to the transition state but further optimization is required to obtain the exact coordinate in this concerted type mechanism.

Mm10114 (talk) 17:50, 25 May 2018 (BST) Very good discussion and observations.
3) Comment on how the mep and the trajectory you just calculated differ.
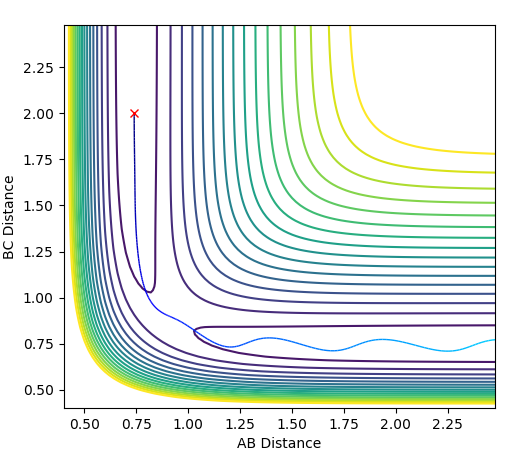
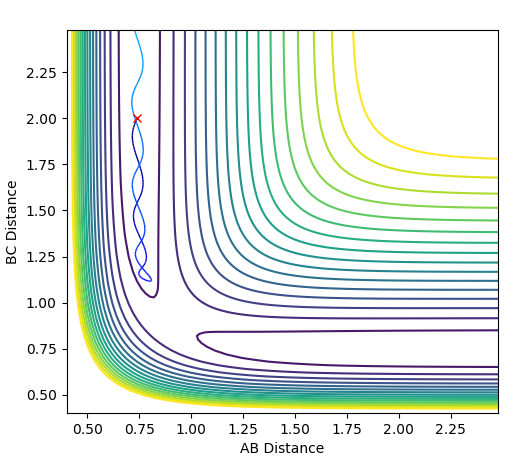
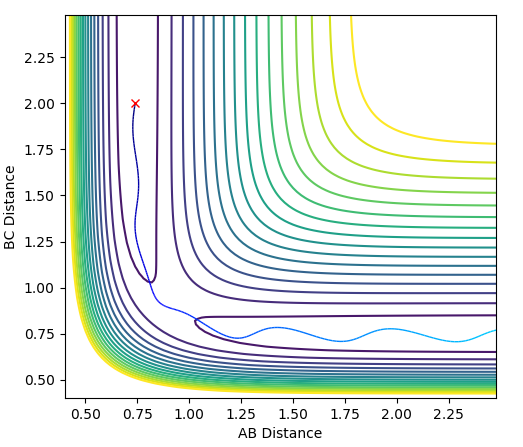
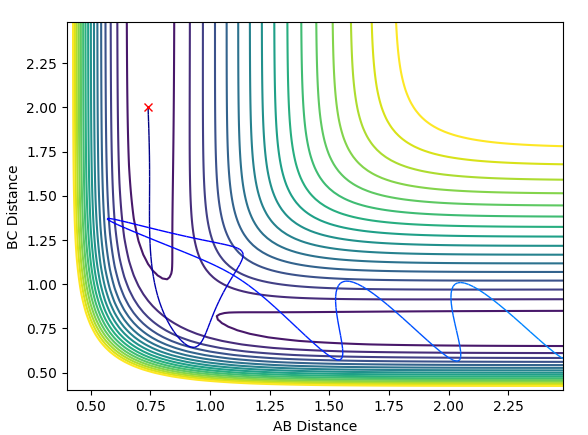
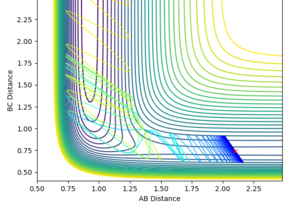
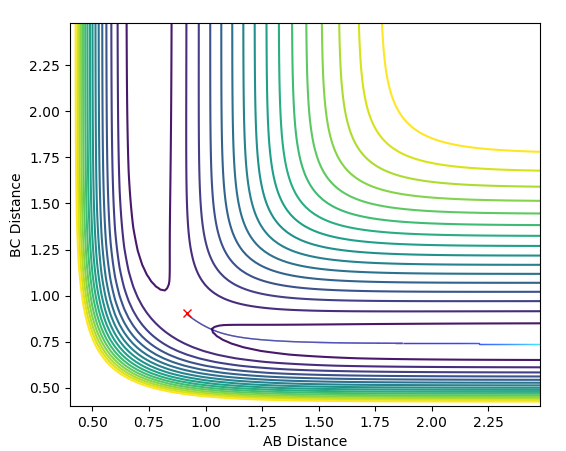
The MEP is useful because it shows an indication for what path the system prefers to follow, however it doesn't include vibrational energy such that in MEP the system just follows the minima of the surface whereas in the dynamics calculation there's an oscillation along the bond formed (in this case BC) and so it is a more realistic picture of the process that happens.The MEP resets the velocity to zero with each infinitesimal path along the minima of the surface, whereas in the dynamics calculation there are oscillations of the bond formed as a result of the accumulation of momenta.The figures below show the described phenomena.
| Method | Dynamics | MEP |
|---|---|---|
| image | 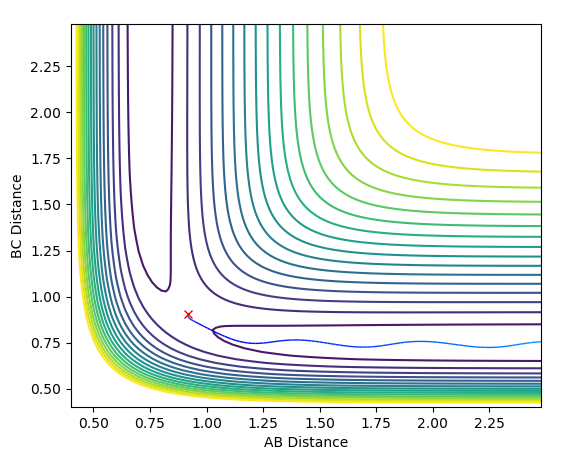 |
|
4) Look at the "Internuclear distance vs Time" and "Internuclear Momenta vs Time". Take not of the final values of the positions r1(t)r2(t) and the avergae momenta p1(t)p2(t)at large t.
What would change if we used the initial conditions r1 =rts and r2 = rts ̹̹+ 0.01 instead ?
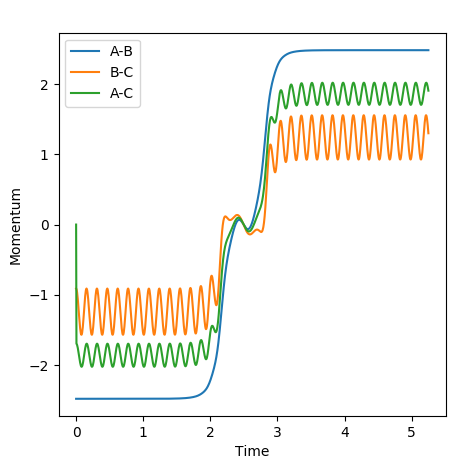
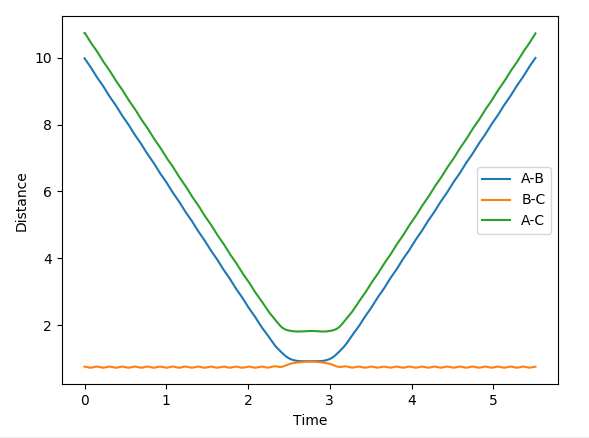
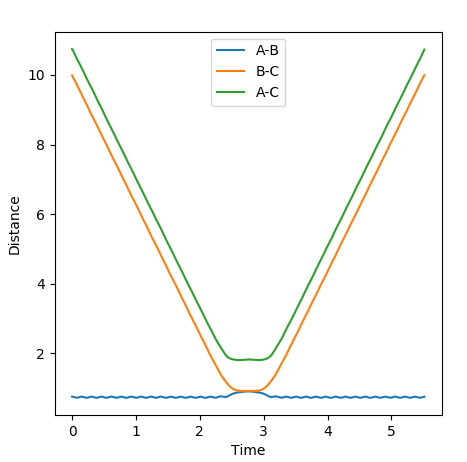
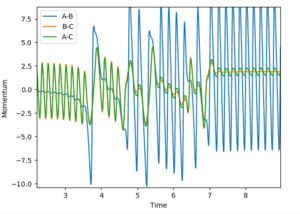
In this evaluation we start at the last geometry AB distance = 9.9831723Å and BC distance = 0.7561648Å and reverse the momenta such that the state goes back to the transition state as shown in the image below of Internuclear distance vs Time, the momenta approaches zero because the kinetic energy is converted to potential energy
Clearly the image on the right illustrates how by reversing the momenta the system goes back to the transition state, whereas the image on the left shows kinetic energy due to the momentum of the system is converted to potential and then it oscillates back to the starting geometry but the momenta is positive as its's going back in the opposite direction from where it started. The figure furthest to the right shows what would if the small change from the transition state is inverted, this leads to the formation of bond AB instead of BC, but follows the same process of inverting momenta as described above.
Reactive and unreactive trajectories
Complete the table by adding a column with the total energy, and another column reporting if the trajectory is reactive or unreactive. For each set of initial conditions, provide a plot of the trajectory and a small description for what happens along the trajectory
Mm10114 (talk) 17:57, 25 May 2018 (BST) Very good comments on the trajectories show that you have a good feeling what is going on. You forgot to report the total energies.
State what are the main assumptions of Transition State Theory. Given the results you have obtained, how will Transition State Theory predictions for reaction rate values compare with experimental values?
Transition State Theory uses the following assumptions
• Molecular systems which have crossed the transition state in direction of products will not return back to reform the reactants
• Classical Mechanics applies at the Transition State
• The system passes through the lowest energy transition state on the potential energy surface.[1]
From the modelling seen above, the assumption that the products do not re-cross doesn't apply because in more than one occasion there's enough energy in the system to overcome the energy barrier repeatedly, it is seen that after crossing the transition state on one occasion the system can cross back and reform the reactants.
Although transition state theory is a good modelling for high energy barriers, with smaller energy barriers tunelling is also seen where the probability of a particle being present beyond the energy barrier is not forbidden, despite not having enough energy to overcome the activation barrier.
H-F-H Excercise 2
1) Classify the F + H2 and H + HF reactions according to their energetics (endothermic or exothermic). How does this relate to the bond strength of the chemical species involved?
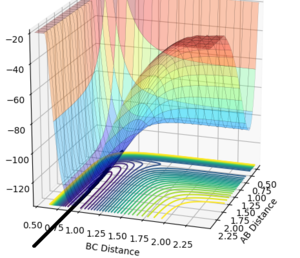
Examination of this potential surface shows formation of H-H bond is an endothermic reaction(note BC corresponds to HF distance). The bond enthalpies for H-H and H-F are 435 kJ/mol and 569 kJ/mol respectively [2][3].The potential surface shows that the products are of lower energy than the reactants when the trajectory F + H2 --> HF ̟+ H is followed, hence we get an exothermic reaction. But going in the oppposite direction for the trajectory an endothermic reaction is observed. This supports the fact that the H-F bond is stronger than the H-H bond.
2) Locate the approximate position of the transition state.
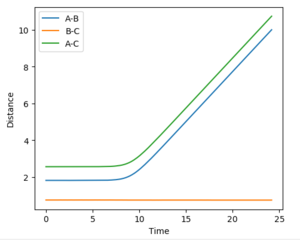
Hammond's postulate was applied as determine an approximation for the location of the transition state, following the trajectory for an exothermic reaction by formation of HF, the TS will resemble the reactants and therefore the F-H distance will be much larger at the TS. Using dynamics calculation and evaluating different distances the transition state distance was optimised as AB = 1.8112, BC = 0.7440, momentun AB = momentum BC = 0, energy = -99.119 kjmol-1. The figure above shows no change in atomic distance with time, for around 10 time periods before deviation. After trial and error this was the closest structure showing no oscillations with time for the longest period of time. This shows that the current positions are close to the transition state but further optimization is required to obtain the exact coordinate in this system. In this case, after 10 time periods a small deviation causes the formation of HH which is opposite to what is expected as the HF bond is stronger,so going down potential slope of HF formation should be energetically more favoured.
Mm10114 (talk) 18:00, 25 May 2018 (BST) Good job, especially in explaining why the distances start increase at some time.
3) Report the activation energy for both reactions.
The activation energy for a process is simply taken as the difference in energy between the minima of the reactants and the maxima of the transition state. The energy of the transition state is in kcalmol-1. The energies were obtained by slightly displacing the equilibrium of the transition state so the initial and final energies can be obtained from which the activation energies can be calculated. ̹̹̹̹̹̹̹
Ea = ETS - Ereactant
Activation energy of HH + F process ː -103.75 - (-104.02) = 0.27 kcalmol-1
Activation energy of HF + F process ː -103.75 - (-133.90) = 30.15 kcalmol-1

Reaction Dynamics
4) In light of the fact that energy is conserved, discuss the mechanism of release of the reaction energy. How could this be confirmed experimentally ?
reactive trajectory used for the first two cases
•rHF = 2.10
•rHH = 0.74
•pFH = -0.5
• -3 < pHH < 3
In the third case
•rHF = 2.10
•rHH = 0.74
•pFH = -0.8
•pHH = 0.1
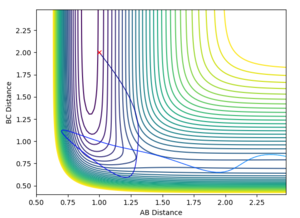
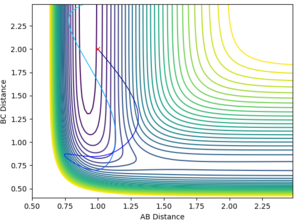
5) Discuss how the ditribution of energy between different modes(translation and vibration) affect the efficiency of the reaction, and how this is influenced by the position of the transition state
Initial Conditions
•rHF = 1.00
•rHH = 2.00
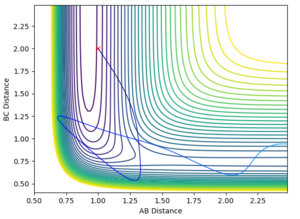
| pHF | pHH | reactive trajectory | Interatomic distance vs Time | Contour plot | |
|---|---|---|---|---|---|
| 0 | -9 | yes | 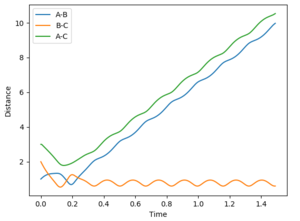 |
 | |
| 1.5 | -7.5 | yes | 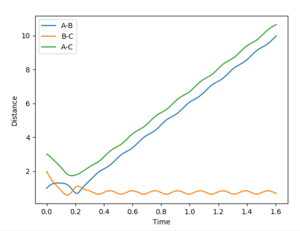 |
 | |
| 3 | -6 | no | 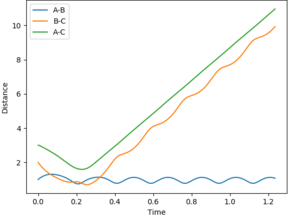 |
 | |
| 4.5 | -4.5 | no | 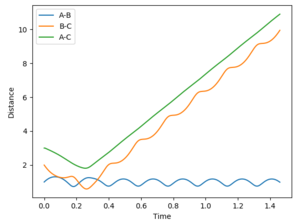 |
 |
Polanyi's empirical rules state that vibrational energy is better at promoting a late barrier reaction than translational energy. Vice versa translational energy is better at promoting an earlier barrier reaction than vibrational energy. [4]
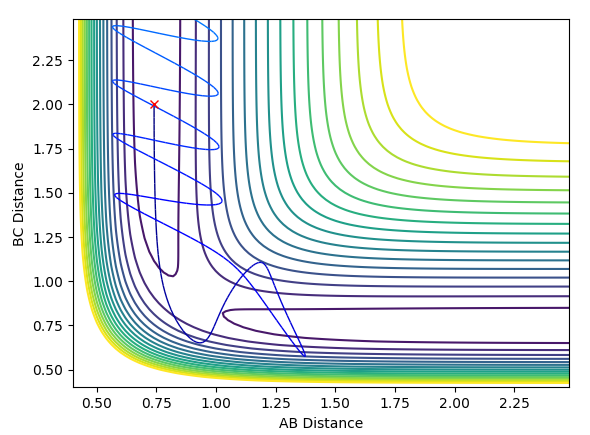
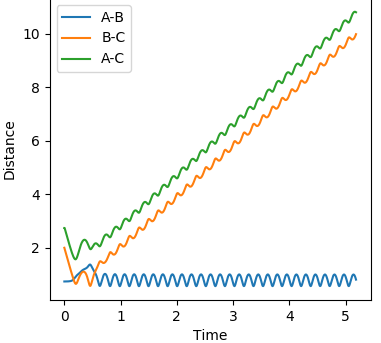
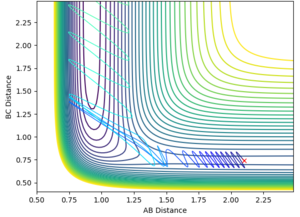
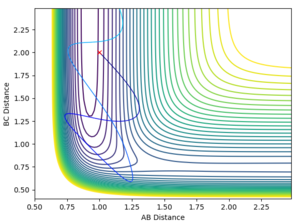
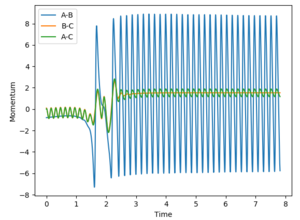
In the systems studied, it is seen that in the case where the F atom approaches the H2, the reaction is exothermic indicative of an early transition state.The figure below shows the criteria rHF = 2.10, rHH = 0.74, pFH = -0.8, pHH = 0.1. A small amount of vibrational energy is required initially to overcome the activation barrier and form HF. The later high amplitude oscillations in AB cause the release of heat showing the reaction is exothermic.
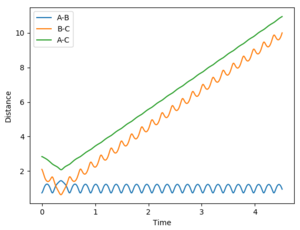
The HF + H reaction is endothermic, so applying Hammond's postualte a late transition state is expected. A much larger potential energy gap is seen between reactants and the activation barrier so to climb the activation barrier a high amount of vibrational energy is required, such that the system obeys Polyani's rules. In a further example with lower vibrational energy,the AB momentum = 0.1 and BC momentum =-2, as expected it is seen that this isn't a reactive trajectory, despite crossing the transition state on more than one occasion.

References
1 P. Atkins and de J. Paula, J. Chem. Inf. Model., 2013, 53, 1689–1699.
2 S. & Atkins, Compr. Inorg. Chem. Vol. 5, 1956, 475.
3 CRC Handbook of Chemistry and Physics, CRC Handb. Chem. Phys., 2011, 1, 90–91.
4 Z. Zhang, Y. Zhou, D. H. Zhang, G. Czako and J. M. Bowman, , DOI:10.1021/jz301649w.

