Zl7710
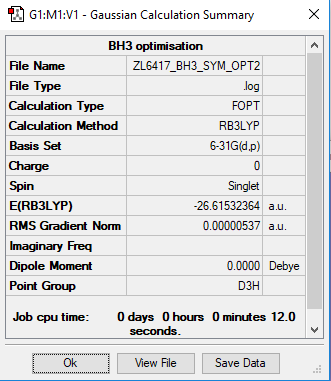
BH3
B3LYP/6-31G(d,p)
         Item               Value     Threshold  Converged?
 Maximum Force            0.000012     0.000450     YES
 RMS     Force            0.000008     0.000300     YES
 Maximum Displacement     0.000064     0.001800     YES
 RMS     Displacement     0.000039     0.001200     YES
Frequency file: ZL6417_BH3_FREQ.log
Low frequencies ---   -7.5936   -1.5614   -0.0055    0.6514    6.9319    7.1055
Low frequencies --- 1162.9677 1213.1634 1213.1661
Optimised BH3 molecule |
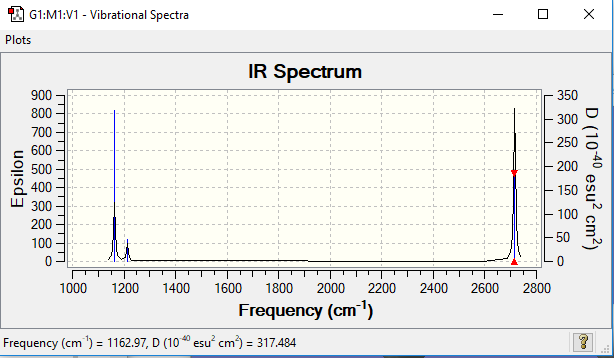
Vibrational spectrum of BH3
| wavenumber (cm-1) | Intensity (arbitrary units) | symmetry | IR active? | type |
| 1163 | 93 | A2" | yes | out-of-plane bend |
| 1213 | 14 | E' | very slight | bend |
| 1213 | 14 | E' | very slight | bend |
| 2582 | 0 | A1' | no | symmetric stretch |
| 2716 | 126 | E' | yes | asymmetric stretch |
| 2716 | 126 | E' | yes | asymmetric stretch |
Although there are six vibrations shown in the table above, in the spectrum there are only three peaks, which can be explained by two reasons:
1. There are two doubly degenerate sets of vibrations being 1213 and 2716 cm-1 respectively
2. The vibration at 2581 cm-1 is a symmetric stretch which involves no dipole change. Hence this vibration is not IR active and doesn't appear in the spectrum.
Hence there are only three peaks in the spectrum being 1163, 1213 and 2716 cm-1.
Molecular Orbitals of BH3
MO. Figure 1 BH3. 1
Comparing the real MOs with the LCAOs, they have similar shapes but there are some differences.
1. For the occupied orbitals 2a1' and 1e', the real orbitals are perfectly predicted by the MO theory, but the real orbitals are more delocalized than the LCAO ones.
2. For the unoccupied orbitals, the non-bonding orbital 1a2" is perfectly predicted. Whereas 3a1' has an 'odd' p-like orbital on the centre boron atom, and the lobes of 2e' are more distorted or delocalised.
Ng611 (talk) 19:40, 29 May 2019 (BST) I don't see a p-like orbital? Are you talking about the fact that the red lobe is narrower around the boron atom? This doesn't make it p-like, as the lobes of a p-orbital will have opposite parities.
To sum up, qualitative MO theory can better predict the bonding or non-bonding orbitals with a good accuracy, and it is useful for qualitative analysis of frontier orbitals (HOMO and LUMO). On the other hand, it is less accurate or useful for predictions of antibonding orbitals
Association energies: Ammonia-Borane
Ng611 (talk) 19:41, 29 May 2019 (BST) Where are your jmols?
Method and Basis set: B3LYP/6-31G(d,p)
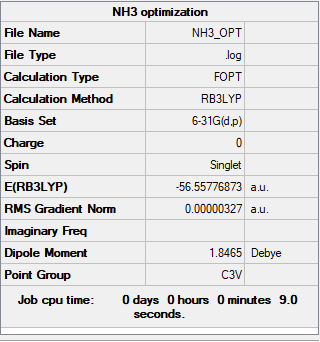
NH3
         Item               Value     Threshold  Converged?
 Maximum Force            0.000006     0.000450     YES
 RMS     Force            0.000003     0.000300     YES
 Maximum Displacement     0.000013     0.001800     YES
 RMS     Displacement     0.000007     0.001200     YES
Low frequencies ---   -0.0138   -0.0032   -0.0015    7.0783    8.0932    8.0937
Low frequencies ---    1089.3840 1693.9368 1693.9368
Frequency file: zl6417_NH3_FREQ.LOG.log
NH3BH3
         Item               Value     Threshold  Converged?
 Maximum Force            0.000228     0.000450     YES
 RMS     Force            0.000114     0.000300     YES
 Maximum Displacement     0.000849     0.001800     YES
 RMS     Displacement     0.000493     0.001200     YES
Low frequencies ---   -0.0139   -0.0049   -0.0030   20.4189   20.4428   48.1383
Low frequencies ---    267.4176  632.7852  640.1442
Frequency file: zl6417_NH3BH3_FREQ.LOG
E(NH3)= -56.55776873	 a.u.
E(BH3)=-26.61532360	 a.u.
E(NH3BH3)= -83.22468864	 a.u.

ΔE=E(NH3BH3)-[E(NH3)+E(BH3)]
  =-0.05159631 a.u.
  =-135.4660523 kJ/mol
  = ca. -135.4660 kJ/mol
Based on the calculated bond energy, this dative bond (ca. 135 kJ/mol) between BH3 and NH3 is relatively weak compared to a covalent bond between B and N (ca. 378 kJ/mol) or a B-H covalent bond (ca.345 kJ/mol) 3
Ng611 (talk) 19:42, 29 May 2019 (BST) Try to use a paper/textbook/databook rather than a web source as a reference. Otherwise, good calculation!
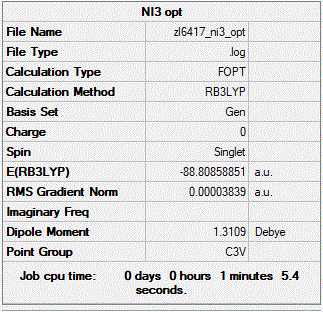
NI3 Using a mixture of basis-sets and psuedo-potentials
B3LYP/6-31G(d,p) LANL2DZ
Frequency file: ZL_NI3_FREQ_3.LOG
  Item                      Value     Threshold  Converged?
 Maximum Force            0.000064     0.000450     YES
 RMS     Force            0.000038     0.000300     YES
 Maximum Displacement     0.000488     0.001800     YES
 RMS     Displacement     0.000278     0.001200     YES
Optimised NI3 molecule |
 Low frequencies ---  -12.7380  -12.7319   -6.2907   -0.0040    0.0188    0.0633
 Low frequencies ---  101.0326  101.0333  147.4124
Optimised N-I distance: 2.184 Å
Ng611 (talk) 19:43, 29 May 2019 (BST) Good!
Metal Carbonyls
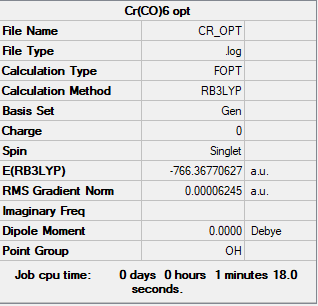
In this mini investigation project, the three metal carbonyl compounds were computated and analysed: Cr(CO)6, [Mn(CO)6]+ and [Fe(CO)6]2+. These are all isostructural and isoelectronic d6 with low spin due the strong field ligand CO.
Computation
B3LYP/6-31G(d,p)LANL2DZ
Cr(CO)6
Frequency file: zl6417_CR_FREQ.LOG
         Item               Value     Threshold  Converged?
 Maximum Force            0.000155     0.000450     YES
 RMS     Force            0.000063     0.000300     YES
 Maximum Displacement     0.000705     0.001800     YES
 RMS     Displacement     0.000378     0.001200     YES
Low frequencies ---    0.0016    0.0017    0.0017   11.7424   11.7424   11.7424
Low frequencies ---    66.6546   66.6546   66.6546
Optimised Cr(CO)6 molecule |
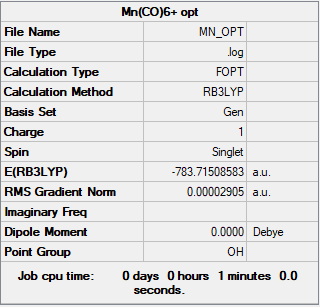
[Mn(CO)6]+
Frequency file: zl6417_MN_FREQ.LOG
         Item               Value     Threshold  Converged?
 Maximum Force            0.000070     0.000450     YES
 RMS     Force            0.000029     0.000300     YES
 Maximum Displacement     0.000345     0.001800     YES
 RMS     Displacement     0.000185     0.001200     YES
Low frequencies ---   -0.0009   -0.0007    0.0006    6.1493    6.1493    6.1493
Low frequencies ---   76.3727   76.3727   76.3727
Optimised [Mn(CO)6]+ molecule |
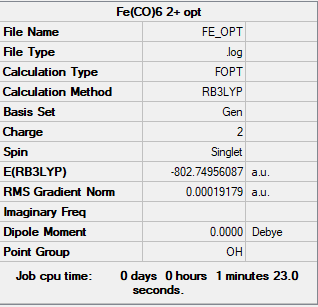
[Fe(CO)6]2+
Frequency file: zl6417_FE_FREQ.LOG
Item               Value     Threshold  Converged?
 Maximum Force            0.000377     0.000450     YES
 RMS     Force            0.000193     0.000300     YES
 Maximum Displacement     0.000880     0.001800     YES
 RMS     Displacement     0.000420     0.001200     YES
Low frequencies ---  -12.1458  -12.1458  -12.1458   -0.0009   -0.0006    0.0003
Low frequencies ---   81.4550   81.4550   81.4550
Optimised [Fe(CO)6]2+ molecule |
Ng611 (talk) 19:45, 29 May 2019 (BST) Good calculations!
Predictions
Bond lengths
The complexes are all d6 low spin octahedral with 6 CO ligands; The metal centres are of similar sizes but different oxidation states. Hence the bond lengths mainly depend on the degree of back-donation from the metal to the ligands.
A more electro-positive or positively-charged metal centre has stronger attractions to the d electrons and is less inclined to back-donate the e- density onto CO ligands. Hence the M-C bond will be longer and weaker compared to those with more back-donation. In addition, donation of d electrons onto π* of CO weakens and enlongates the C-O bond. Therefore,
• Electro-positivity of the metal centre: Fe2+ > Mn+ > Cr
• Degree of back-donation: [Fe(CO)6]2+ < [Mn(CO)6]+ < Cr(CO)6
Assume the three metal centres are of the same size.
• M-C bond length: Fe-C > Mn-C > Cr-C
• C≡O bond length: Fe-C < Mn-C < Cr-C
Atomic charges
CO ligand is both a σ-donor and π-donor which donates electron density to the metal center; Besides, it is also a π-acceptor which can accept electron densities from the metal center and this phenomenon is called back-donation. The three metals are similar except for the oxidation states which determine the degree of back-donation.
The higher the oxidation state of the metal is, the more donation of electron density from ligands (consider electrostatic forces) and less back-donation from the metal are.
Hence the sum of the absolute value of atomic charge and oxidation state:
[Fe(CO)6]2+ > [Mn(CO)6]+ > Cr(CO)6
Overall charges on the CO ligands:
[Fe(CO)6]2+ < [Mn(CO)6]+ < Cr(CO)6
Vibrational frequencies
The more the back-donation from the metal center to the π* is, the weaker the C≡O bond is. Hence back-donation decreases the vibrational frequency of C≡O bond.
• Degree of back-donation: [Fe(CO)6]2+ < [Mn(CO)6]+ < Cr(CO)6
• Vibrational frequency of Carbonyl: [Fe(CO)6]2+ > [Mn(CO)6]+ > Cr(CO)6
Results and Discussion
Bond lengths
| Complex | M-C / Å | C≡O / Å |
| Cr(CO)6 | 1.915 | 1.149 |
| [Mn(CO)6]+ | 1.908 | 1.136 |
| [Fe(CO)6]2+ | 1.942 | 1.125 |
• M-C bond length: Fe-C > Cr-C > Mn-C
• C≡O bond lengthe: Fe-C < Mn-C < Cr-C
According to the results, the C≡O bond lengths are consistent with theoretical predictions.
However, there is a discrepancy for the M-C bond lengths: Cr-C > Mn-C , which may be attributed to the fact that Cr has a larger radius than Mn2+ and that outweighs the effect of back-donation.
Atomic Charges
| Metal Complexes | Metal | Carbon | Oxygen | CO |
| Cr(CO)6 | ( -2.450 ) | ( 0.827 ) | (-0.419 ) | ( 0.408 ) |
| [Mn(CO)6]+ | ( -2.048 ) | ( 0.834 ) | ( -0.326 ) | ( 0.508 ) |
| [Fe(CO)6]2+ | ( -1.504 ) | ( 0.815 ) | (-0.231 ) | ( 0.584 ) |
The sum of the absolute value of metal charge and oxidation state:
[Fe(CO)6]2+ (3.504) > [Mn(CO)6]+ (3.048) > Cr(CO)6 (2.450)
Besides the overall charge on the CO ligands:
[Fe(CO)6]2+ (0.408) < [Mn(CO)6]+ (0.508) < Cr(CO)6 (0.584)
These results are in consistent with the predictions.
Vibrational frequencies
CO frequency:
| Complex | v(CO)/ cm-1 |
| Cr(CO)6 | 2086 |
| [Mn(CO)6]+ | 2198 |
| [Fe(CO)6]2+ | 2298 |
Based on the data, Fe(CO)62+ has the largest v(CO) value while Cr(CO)6 has the lowest frequency. Hence the results are consistent with the predictions.
Analysis of C-O vibrations
Take Cr(CO)6 as an example to analyse the C-O vibrations of metal complexes of Oh point group.
| wavenumber (cm-1) | Intensity (arbitrary units) | symmetry | IR active? | type |
| 2199 | 879 | T1u | yes | assymetric stretch |
| 2199 | 879 | T1u | yes | assymetric stretch |
| 2199 | 879 | T1u | yes | assymetric stretch |
| 2212 | 0 | Eg | no | symmetric stretch |
| 2212 | 0 | Eg | no | symmetric stretch |
| 2264 | 0 | A1 | no | symmetric stretch |
Based on Group Theory, the irreducible representation of Cr(CO)6 is A1+Eg+T1u. A1 and Eg induce no change in dipole moment therefore not IR active. T1u is anti-symmetric stretch of the apical carbonyl ligands so IR active. Hence there is only one CO peak visible on the IR spectrum
And although the totally symmetric CO vibration A1 cannot be analysed by IR, it can be analysed computationally which gives the wavelength 2264 cm -1 with 0 intensity
Selected Valence Molecular orbitals of Cr(CO)6
Take the MOs of Cr(CO)6 as an example.
MO diagram of the ligand CO 2
 |
Note:
• 1π is the π-donor MO;
• 5σ is the σ-donor FO and HOMO of CO;
• 2π* is the π-acceptor FO and LUMO of CO.
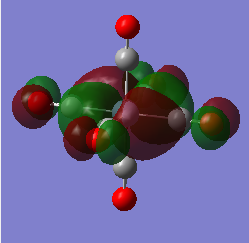
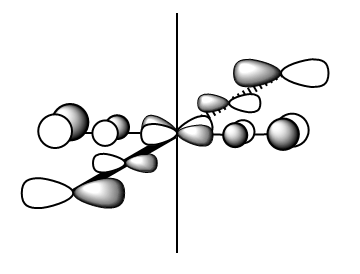
| t2g | LCAO |
|

|
MO Energy: -0.25746 a.u. Overall bonding.
This is the HOMO t2g and can be drawn as a LCAO of metal dxy and 2π* of ligands. (Shown in MO.Figure 2 above)
It is the highest-energy valence orbital due to anti-bonding characters within the CO ligands, and relatively weak π interactions between metal and ligands. It is also one of the triply-degenerate t2g orbitals for Oh complexes in crystal field theory.
| t2g | LCAO |

|
|
MO Energy: -0. 48463 a.u. Overall bonding.
This t2g orbital can be explained as a LCAO of dxy and 1π orbitals on CO. (Shown in MO.Figure 2 above)
This is relatively deeper in energy but higher than the eg orbital shown below due to weaker side-side π interactions compared to head-head σ interactions.
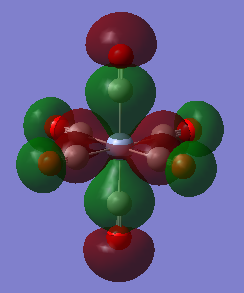
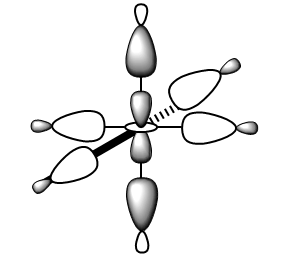
| eg | LCAO |
|
|
MO Energy: -0.57300 a.u. Overall bonding.
This eg orbital can be drawn as a LCAO of dz2 orbital of metal and six 5σ of CO. (Shown in MO.Figure 2 above)
This interaction is bonding because there is constructive overlap and no node between the metal centre and ligands. This orbital is deep energy due to strong σ-σ interactions and relative low energy of 5σ orbitals.
Ng611 (talk) 20:19, 29 May 2019 (BST) Excellent! Try labelling your interactions on your MO diagram though rather than writing them below.
References
1. Hunt Research Group, http://www.huntresearchgroup.org.uk/teaching/teaching_comp_lab_year2a/Tut_MO_diagram_BH3.pdf, (accessed May 19th 2019)
2. Hunt Research Group, http://www.huntresearchgroup.org.uk/teaching/teaching_MOs_year2/L7_Notes_web_printing.pdf, (accessed May 19th 2019)
3. https://notendur.hi.is/agust/rannsoknir/papers/2010-91-CRC-BDEs-Tables.pdf, (accessed May 19th 2019)

