ZQR01333824
Small molecules
BH3 Molecule
Basic Information
Calculation method:RB3LYP
Basis set:6-31G(d.p)
Summary table
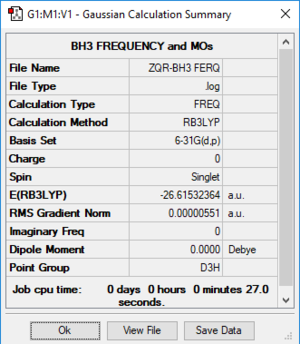
Item table
        Item               Value     Threshold  Converged?
Maximum Force            0.000011     0.000450     YES
RMS     Force            0.000006     0.000300     YES
Maximum Displacement     0.000043     0.001800     YES
RMS     Displacement     0.000022     0.001200     YES
Frequency log file
Low frequency table
Low frequencies ---  -14.6858  -14.6818  -11.0436   -0.0009    0.0165    0.3415

Low frequencies --- 1162.9492 1213.1220 1213.1222
J mol file
BH Molecule |
Vibrational spectrum for BH3
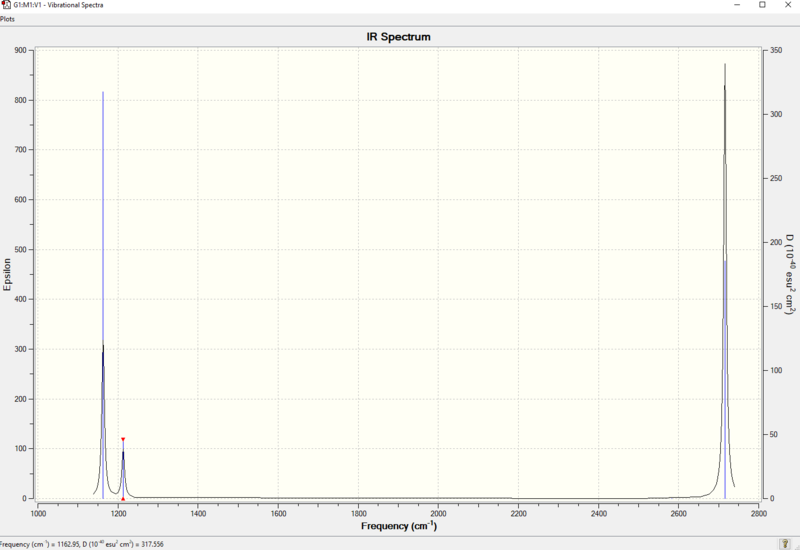
| wavenumber (cm-1) | Intensity (arbitrary units) | symmetry | IR active? | type |
| 1163 | 92 | A2 | Yes | out-of-plane bend |
| 1213 | 14 | E' | Yes | bend |
| 1213 | 14 | E' | Yes | bend |
| 2583 | 0 | A1 | no | symmetric stretch |
| 2716 | 126 | E' | Yes | asymmetric stretch |
| 2716 | 126 | E' | Yes | asymmetric stretch |
IR spectrum of BH3
Question
A: There are only three peaks on IR spectrum, which represents mode 1, mode 2 & 3 and mode 5 & 6. Mode 1 is IR active because there is change in dipole moment. Mode 2 and mode 3 are degenerate so they show as one peak. Same for mode 5 and 6 since they are also degenerate. Mode 4 is IR inactive because there is no net change in dipole moment.
MO diagram of BH3
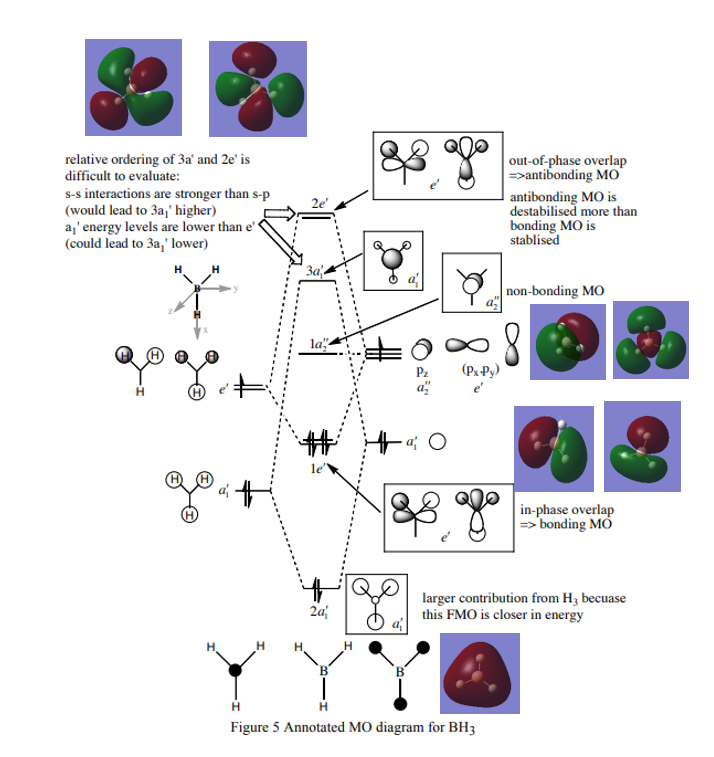
Reference: Hunt P. Lecture_4_Tut_MO_diagram_BH3. Inorganic Lecture Course; 2019.
Question
Q1 A: The real Mo is calculated by computer, it shows the real size, fragmentation of orbitals and the exact way they mix. LCAO is formed by combination of atomic orbitals, the exact size cannot be predicted accurately.
Q2 A: Qualitative Mos are only useful to predict the size and shape orbitals for small molecules, For more complex Mos, calculation is needed to get the accurate prediction.
Correct inclusion of the calculated MOs on to the MO diagram. Your evaluation of the usefulness of the LCAO approach is ok but to improve, you could have discussed the similarities and differences in more detail, for example, consider the differences in orbital contributions in the 3a1' or 2e' MOs. Smf115 (talk) 14:46, 2 June 2019 (BST)
NH3 Molecule
Basic Information
Calculation method:RB3LYP
Basis set:6-31G(d.p)
Summary table
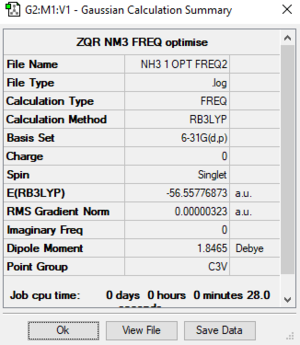
Item table
         Item               Value     Threshold  Converged?
 Maximum Force            0.000006     0.000450     YES
 RMS     Force            0.000003     0.000300     YES
 Maximum Displacement     0.000013     0.001800     YES
 RMS     Displacement     0.000007     0.001200     YES
Frequency log file
Low frequency table
Low frequencies ---   -0.0129   -0.0018    0.0001    7.0724    8.1020    8.1023
Low frequencies --- 1089.3849 1693.9369 1693.9369
J mol file
NH Molecule |
NH3BH3 Molecule
Basic Information
Calculation method:RB3LYP
Basis set:6-31G(d.p)
Summary table

Item table
         Item               Value     Threshold  Converged?
 Maximum Force            0.000350     0.000450     YES
 RMS     Force            0.000112     0.000300     YES
 Maximum Displacement     0.001347     0.001800     YES
 RMS     Displacement     0.000450     0.001200     YES
frequency log file
Low frequency table
Low frequencies ---   -0.0265   -0.0066   -0.0053   10.4126   10.4592   38.3629
Low frequencies ---  265.3603  634.4262  639.2330
J mol file
BH Molecule |
Association energy
E of BH3 = -26.61532 a.u.
E of NH3 = -56.55777 a.u.
E of NH3BH3 = -83.22469 a.u.
ΔE= -83.22469-(-26.61532-56.55777) = -0.05160 a.u. = -135 kJ/mol
B-N dative bond is relatively weak compared to C-C bond which is equal to 346 KJ/mol
Correct calculation, good consideration given to the accuracy of the final reported energy values and ok comparison made. To improve, you could have considered why the C-C bond is a good comparison and always include a reference for literature values! Smf115 (talk) 14:48, 2 June 2019 (BST)
NI3 Molecule
Basic Information
Calculation method:RB3LYP
Basis set:Gen
Summary table
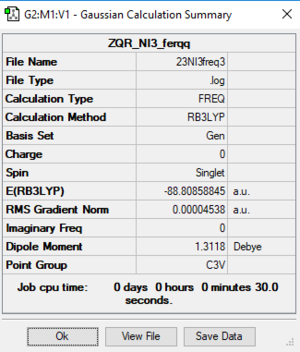
Item table
Item               Value     Threshold  Converged?
 Maximum Force            0.000096     0.000450     YES
 RMS     Force            0.000075     0.000300     YES
 Maximum Displacement     0.000860     0.001800     YES
 RMS     Displacement     0.000613     0.001200     YES
frequency log file
Low frequency table
Low frequencies ---  -12.7408  -12.7347   -6.4001   -0.0039    0.0188    0.0622
Low frequencies ---  101.0654  101.0662  147.4490
J mol file
NH Molecule |
Correct implementation of the pseudopotential and good structure information, however, you are missing the bond length for the molecule. Smf115 (talk) 14:51, 2 June 2019 (BST)
Mini Projects: Ionic liquids
[N(CH3)4]+ Molecule
Basic Information
Calculation method:RB3LYP
Basis set:6-31G(d.p)
Summary table
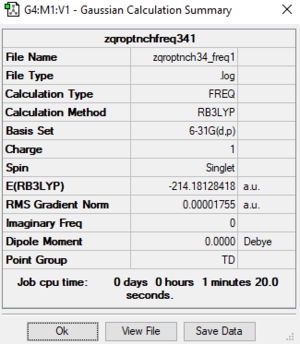
Item table
         Item               Value     Threshold  Converged?
 Maximum Force            0.000030     0.000450     YES
 RMS     Force            0.000018     0.000300     YES
 Maximum Displacement     0.000201     0.001800     YES
 RMS     Displacement     0.000116     0.001200     YES
Frequency log file
Low frequency table
Low frequencies ---   -0.0013   -0.0011   -0.0008   21.4310   21.4310   21.4310
 Low frequencies ---  188.2136  292.4076  292.4076
J mol file
BH Molecule |
[P(CH3)4]+ Molecule
Basic Information
Calculation method:RB3LYP
Basis set:6-31G(d.p)
Summary table
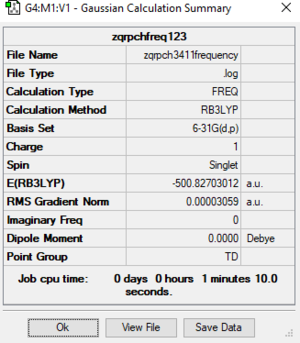
Item table
         Item               Value     Threshold  Converged?
 Maximum Force            0.000046     0.000450     YES
 RMS     Force            0.000031     0.000300     YES
 Maximum Displacement     0.000507     0.001800     YES
 RMS     Displacement     0.000448     0.001200     YES
Frequency log file
Low frequency table
Low frequencies ---   -0.0022    0.0013    0.0025   26.7152   26.7152   26.7152
 Low frequencies ---  161.3609  195.7728  195.7728
J mol file
NH Jmol |
Charge distribution
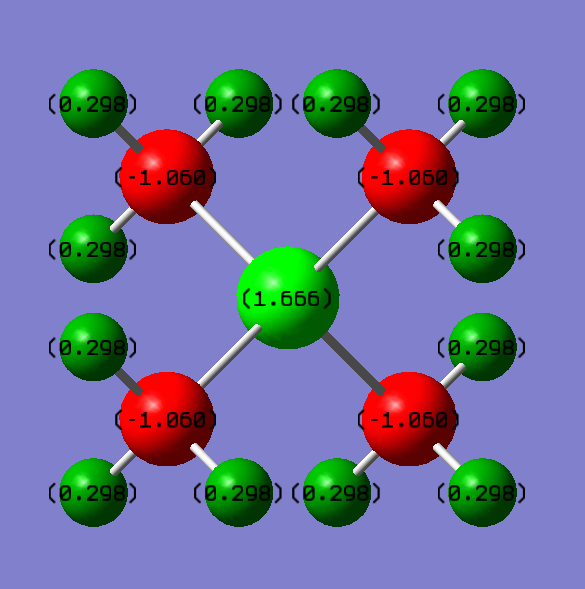

Charge on [P(CH3)4]+: P=+1.666, C=-1.050, H=+0.298.
Charge on [N(CH3)4]+: N=-0.295, C=-0.483, H=+0.269.
For [P(CH3)4]+, phosphorous is more electropositive than carbon hence most of the positive charges are concentrated on phosphorous.Therefore, the negative charges are concentrated on carbon atoms.
For [N(CH3)4]+, nitrogen is more electronegative than carbon. Therefore, the negative charge density is concentrated around nitrogen. Since carbon is also electron negative than hydrogen, the positive charge is concentrated on hydrogen atoms.
Correct NBO charges calculated and good use of a uniform colour range across both ILs, however, it should have been larger to properly show the differences between the charges. Your analysis of the charge distributions is minimal and you haven't considered the question about the +1 formal charge on the N in the traditional picture. Smf115 (talk) 20:49, 4 June 2019 (BST)
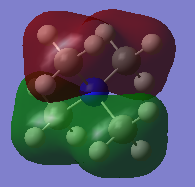
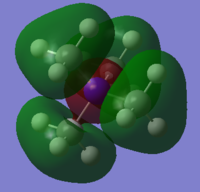
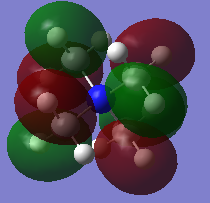
MO diagrams
Good construction of the FOs and the corresponding LCAOs, however, the last LCAO could have been drawn consistently with the other two. To improve, you could have made some attempt to consider the character of each of the MOs chosen to illustrate the range chosen. Smf115 (talk) 20:53, 4 June 2019 (BST) Overall, an ok report which could be improved by more analysis in the project section. Smf115 (talk) 20:53, 4 June 2019 (BST)| Real MO | LCAO |
 |
 |
 |
 |
 |
 |
