Yh1817
Introduction
This page contains some general information on optimising BH3, NH3, NH3BH3, NI3 and two more complex cations. It lists the basis set, summary, item table and frequency data for each substance, and the data were obtained as proceeding through the optimisation steps. For the two cations, the descriptions are more theoretically based and the usefulness on LCAO approach in Inorganic Molecular Orbital Chemistry is strengthened.
Part 1. Small Molecules
BH3
B3LYP/3-21G level

        Item               Value     Threshold  Converged?
Maximum Force            0.000217     0.000450     YES
RMS     Force            0.000105     0.000300     YES
Maximum Displacement     0.000919     0.001800     YES
RMS     Displacement     0.000441     0.001200     YES
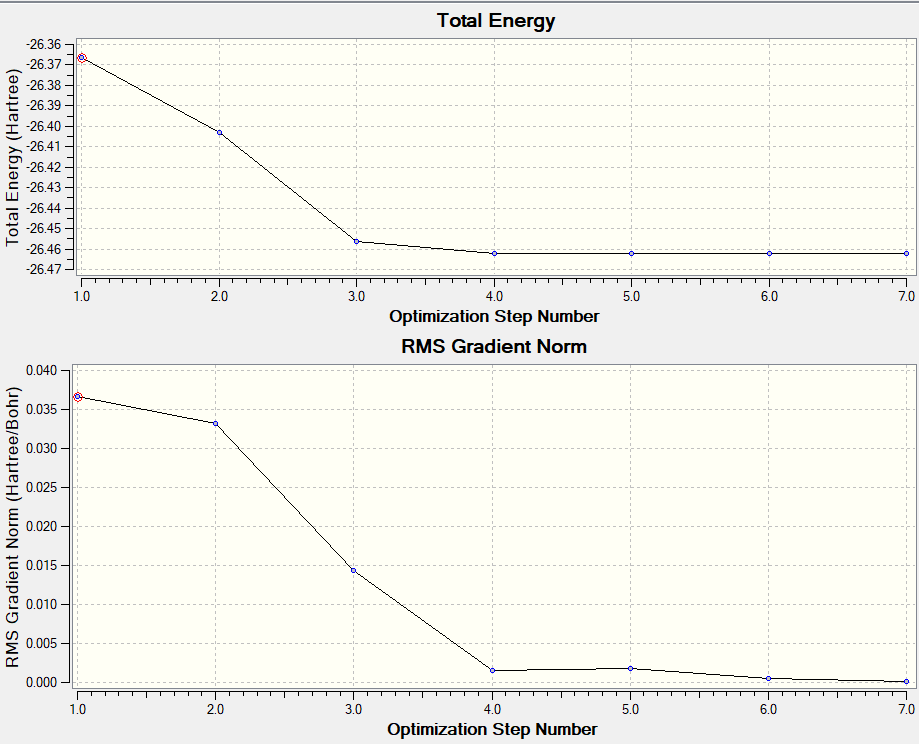
BH3 (better basis set)
B3LYP/6-31G(d,p) level

        Item               Value     Threshold  Converged?
Maximum Force            0.000203     0.000450     YES
RMS     Force            0.000098     0.000300     YES
Maximum Displacement     0.000867     0.001800     YES
RMS     Displacement     0.000415     0.001200     YES
Frequency analysis log file:
YH17 BH3 FREQ.LOG
Low frequencies ---   -0.2260   -0.1035   -0.0054   48.0278   49.0875   49.0880
Low frequencies --- 1163.7224 1213.6715 1213.6741
test molecule |
Mode    Freq(1/cm)      Intensity    IR active?     Type          stretch/bend modes     symmetry
 1      1164              92           yes         bending          out-of-plane           A2
 2      1214              14           slight      bending           in-plane              E'
 3      1214              14           slight      bending           in-plane              E'
 4      2580               0            no        stretching         symmetric             A1
 5      2713             126           yes        stretching         asymmetric            E'
 6      2713             126           yes        stretching         asymmetric            E'
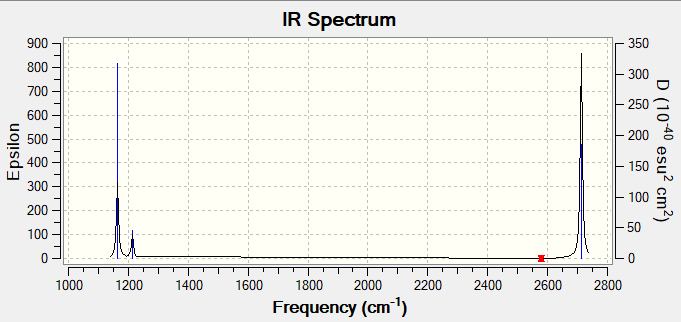
There are only three peaks in the IR spectrum rather than six. This is because modes 2,3 are degenerate and modes 5,6 are degenerate, so only two peaks are shown for these four modes. Mode 1 is also IR active due to change in dipole moment so it shows up as a peak. The remaining mode 4 is not IR active as the symmetric stretch makes no overall change in dipole moment of the molecule, so it is not seen in the spectrum.
Molecular Orbital Diagram of BH3
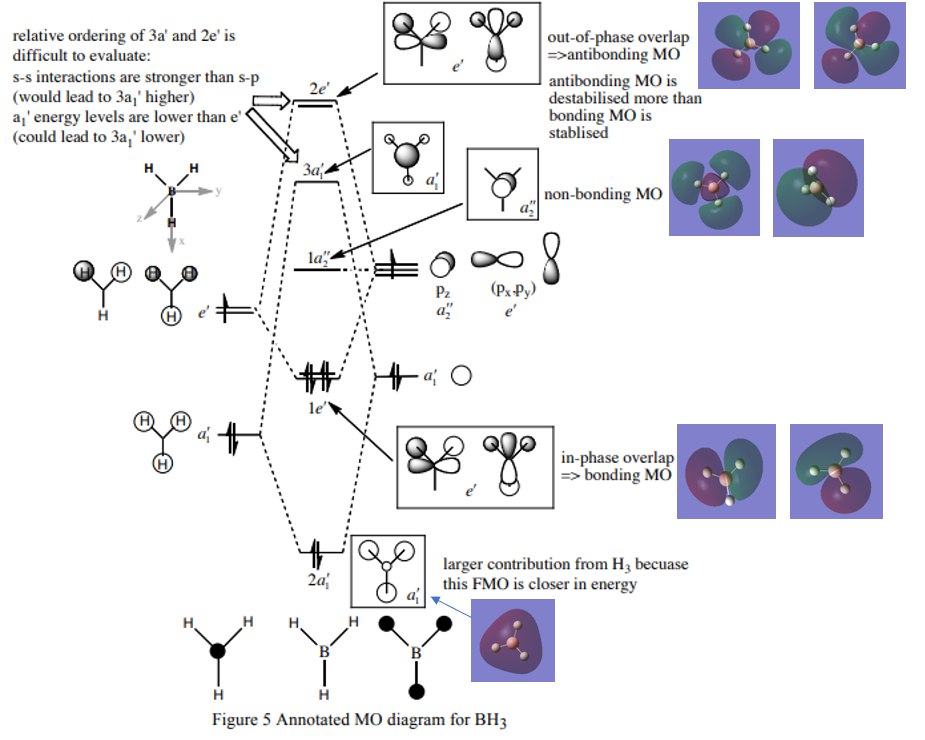
Ng611 (talk) 19:31, 27 May 2019 (BST) Good MOs. I'm a bit confused regarding whether you mean to say that your 2x orbitals in second row are both nonbonding, although I gave you the benefit of the doubt.
Figure 3.[1]
- ↑ Hunt P. Lecture_4_Tut_MO_diagram_BH3. Inorganic Lecture Course. London: Imperial College London; 2019.
Q1. Are there any significant differences between the real and LCAO MOs?
A1. The real MOs are obtained from calculation and hence more accurate in terms of relative sizes of orbitals and shapes etc. The atomic orbitals are 'mixed' in shape and characteristics of individual AO lobes and spheres disappear. The LCAO MOs are from simply combining atomic orbitals (AO lobes and spheres still identifiable) and the orbital sizes are varied based on extent of energy match, and are therefore less accurate. However, LCAO MOs resemble well with the approximate shape and phase of real MOs, which indicates that LCAO MOs are adequate for qualitative analysis of orbital interaction.
Q2. What does this say about the accuracy and usefulness of qualitative MO theory?
A2. Qualitative MO theory is generally useful in predicting the forms and phases (hence the relative energies) and works well for simple MOs. It is not accurate enough for more complex MOs or MOs of higher energy. To understand shapes (orbital overlap) and sizes of more complex MOs, calculations should be performed instead of simply drawing LCAOs.
NH3
B3LYP/6-31G(d,p) level
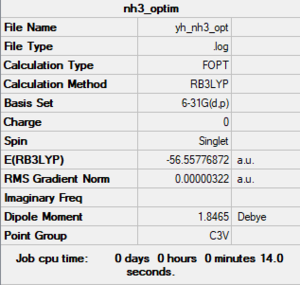
        Item               Value     Threshold  Converged?
Maximum Force            0.000006     0.000450     YES
RMS     Force            0.000004     0.000300     YES
Maximum Displacement     0.000016     0.001800     YES
RMS     Displacement     0.000011     0.001200     YES
Frequency analysis log file: YH17 NH3 FREQ.LOG
 Low frequencies ---  -8.5646  -8.5588  -0.0044    0.0454    0.1784    26.4183
 Low frequencies ---  1089.7603 1694.1865 1694.1865
test molecule |
NH3BH3
B3LYP/6-31G(d,p) level
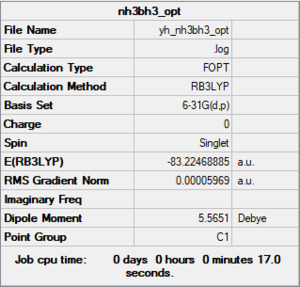
        Item               Value     Threshold  Converged?
Maximum Force            0.000123     0.000450     YES
RMS     Force            0.000058     0.000300     YES
Maximum Displacement     0.000535     0.001800     YES
RMS     Displacement     0.000296     0.001200     YES
Frequency analysis log file: YH17 NH3BH3 FREQ.LOG
Low frequencies ---   -0.0013   -0.0010   -0.0006    14.9014    21.5976   37.1828
Low frequencies --- 265.7882 632.1719 639.5776
test molecule |
Association Energies: Ammonia-Borane
E(NH3) = -26.6153 a.u.
E(BH3) = -56.5577 a.u.
E(NH3BH3) = -83.2246 a.u.
ΔE=E(NH3BH3)-[E(NH3)+E(BH3)] = -0.0516 a.u. = -135 kJ/mol
From the calculation it can be seen that B-N dative bond is relatively weak compared to B-N covalent bond (389 kJ/mol), which is nearly three times strength of the dative bond with the same species.
Ng611 (talk) 19:34, 27 May 2019 (BST) Cite your bond enthalpies!
NI3
B3LYP/6-31G(d,p)LANL2DZ
Frequency analysis log file:
Yh17 NI3 FREQ NEW C3V.LOG

         Item               Value     Threshold  Converged?
 Maximum Force            0.000002     0.000450     YES
 RMS     Force            0.000002     0.000300     YES
 Maximum Displacement     0.000022     0.001800     YES
 RMS     Displacement     0.000014     0.001200     YES
 Low frequencies ---  -22.5765  -22.5730  -19.6620    0.0038    0.0043    0.0250
 Low frequencies ---  101.5687 101.5689 153.1297
test molecule |
Optimized N-I distance: 2.185 Å
Ng611 (talk) 19:36, 27 May 2019 (BST) You're very slightly off the correct value here.
Part 2. Mini Project
[N(CH3)4]+
B3LYP/6-31G(d,p)
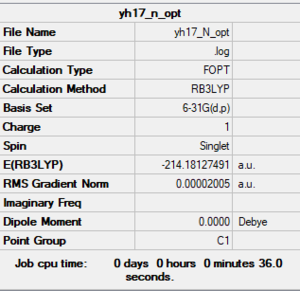
         Item               Value     Threshold  Converged?
 Maximum Force            0.000075     0.000450     YES
 RMS     Force            0.000017     0.000300     YES
 Maximum Displacement     0.001657     0.001800     YES
 RMS     Displacement     0.000429     0.001200     YES
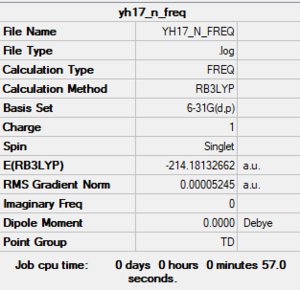
Frequency analysis log file:
YH17 N FREQ.LOG
Low frequencies ---    0.0007    0.0007    0.0008   35.6280   35.6280   35.6280
Low frequencies ---  217.6926  316.6598  316.6598
test molecule |
[P(CH3)4]+
B3LYP/6-31G(d,p)
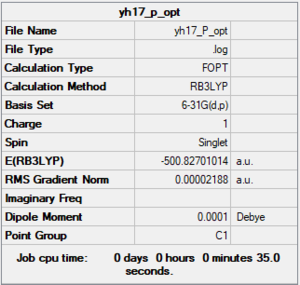
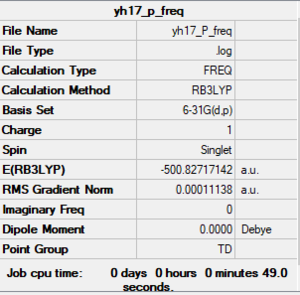
         Item               Value     Threshold  Converged?
 Maximum Force            0.000135     0.000450     YES
 RMS     Force            0.000032     0.000300     YES
 Maximum Displacement     0.000862     0.001800     YES
 RMS     Displacement     0.000343     0.001200     YES
Frequency analysis log file:
YH17 P FREQ.LOG
Low frequencies ---   -0.0037   -0.0034   -0.0014   51.3389   51.3389   51.3389
Low frequencies ---  186.8906  211.6326  211.6326
test molecule |
Charge Distribution
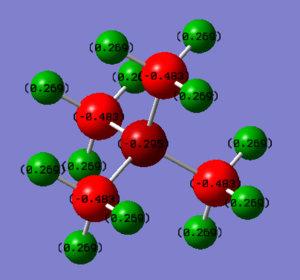
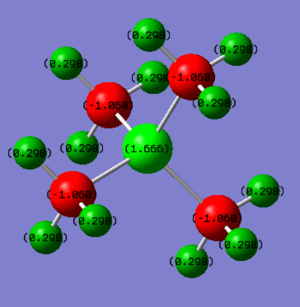
| [N(CH3)4]+ | [P(CH3)4]+ |
|---|---|
| charge on N: -0.295 | charge on P: +1.666 |
| charge on C: -0.483 | charge on C: -1.060 |
| charge on H: +0.269 | charge on H: +0.298 |
| N is quite electronegative hence it bears high electron density. The carbon atoms also bear negative charges while the H atoms are positive. | P is more electropositive than both N and C since it is much larger (so nucleus more shielded). It bears positive charge while all the negative charges are on the carbon atoms. |
[N(CH3)4]+: Traditional Presentation
Q3. What does the "formal" positive charge on the N represent in the traditional picture?
A3. It should be representing the overall charge of the cation, since the charges on all H atoms add up to +3.228 and the charges on C and N atoms add up to -2.227, so the overall charge is +1. The charge is written on N might due to the fact that this is convenient (only need one notation rather than 12 notations on all the H!) and N is donating its lone pair to one C to form a dative bond, making it more electron deficient.
Ng611 (talk) 19:44, 27 May 2019 (BST) Do you think that the formal charge picture (lone pairs, dative bonds, etc.) are an accurate reflection of the quantum mechanical nature of real chemical bonds, or are they used for convenience?
Q4. On what atoms is the positive charge actually located for this cation?
A4. Only hydrogen atoms are bearing the positive charge in [N(CH3)4]+.
Three Valence MOs Chosen for [N(CH3)4]+
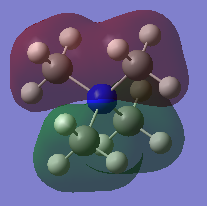
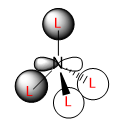
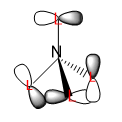
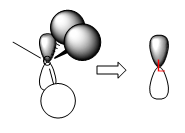
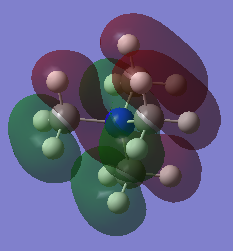
Three occupied MOs are chosen to draw their LCAO MO diagrams: MO number 9, 15 and 21. All these MOs shows bonding character.
| real MO | LCAO |
|---|---|
 |
 |

| real MO | LCAO |
|---|---|
 |
 |
| real MO | LCAO |
|---|---|
 |
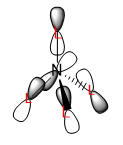 |
Ng611 (talk) 19:49, 27 May 2019 (BST) Some very good LCAO analyses. I'm a little dubious of the orientation of your p-orbital in your final MO however. Labelling some of the key orbital interactions in your MOs would be useful.
It might be interesting looking at the structure of real MOs and spotting that the number of 'layers' of orbitals resembles that of the phases predicted by the LCAO MOs.
For example, the real MO no.9 (Figure 6) has two 'layers' of orbital (one red layer and one green layer) while the phase of LCAO no.9 (Figure 7) is 'split' into two portions (white and black). MO no.15 (Figure 9) has three layers (red-green-red) while LCAO no.15 (Figure 10) has three portions of phases (black-white-black). The same trend applies to MO no.21. In general, more 'switching' between phases, higher the energy of MO will be-this is nicely agreed with the above visualisation of MOs.
End-piece
To conclude, this page summaries some software-generated (Gaussian & Gaussview) information and visualisation on simple molecules, and tries to apply the known information for problem solving, i.e. to calculate the dative bond energy of B-N. The mini project focuses on optimisation of the two cations provided and consideration regarding their charge distributions. The MOs of [N(CH3)4]+ are linked to corresponding LCAOs to get an idea on how well the LCAOs represent the real situation. In the future, more complex systems may be investigated based on similar approach, and therefore use information listed here as a reference of starting point.
