Y2s-spring-azulene
Second Year Synthesis Labs, Spring Term
Computational Exercise, Experiment 3S: Preparation of Azulene
The purpose of this computational exercise is to gain experience with the Gaussian system for molecular modelling and to show the relevance of modelling in a practical context within Chemistry.
You will have done some modelling exercises this year with Ghemical and ChemBio3D, however these programs have some limitations on what is possible. Gaussian is a much more powerful tool for molecular calculations, however it is correspondingly more complex to use. Through this exercise for experiment 3S you will gain a level of familiarity with Gaussian which will be of benefit to you throughout your career in practical Chemistry. This exercise should not take more than 3 hours, and each calculation should not take more than 5 minutes to run on the cluster computers. It is intended that this exercise can be done while your final reflux of the azulene preparation is in progress. ENSURE YOUR REACTION IS SAFE BEFORE LEAVING THE LAB
Gaussian is only available on cluster computers within the Chemistry department; the departmental site license does not cover installations on personal computers.
Facilities and support
The 2nd floor computer cluster has been booked on Thursday afternoons from 1pm to 4pm for this exercise. Second year students carrying out Experiment 3S have priority over other users at this time.
The demonstrator providing support for this exercise is Lee Thompson (email:
l.thompson09 @imperial.ac.uk). He will be 'on call' between 2 and 4pm on Thursday afternoons; if you are having difficulties or simply want to ask further questions, email Lee and he will come to the cluster to provide assistance.
Introduction to the Gaussian Workflow
Gaussian is a UNIX based system (though has been adapted to run on Microsoft Windows), and before a calculation can be run an input file must be created. This input file lays out the molecule, , the theory used to model the electrons and nuclei, the parameters under which the calculation will be run, whether to consider a solvent environment etc. The real power in Gaussian comes from its ability to nest calculations; that is to take the output of one calculation and carry it forward into another calculation, or combine the output of multiple calculations into a further calculation. This is useful for considerations of complex molecules or multiple molecules.
This process can be automated, however in this exercise you should set up each calculation to ensure you understand what is happening at each stage.
Preparation of the input file
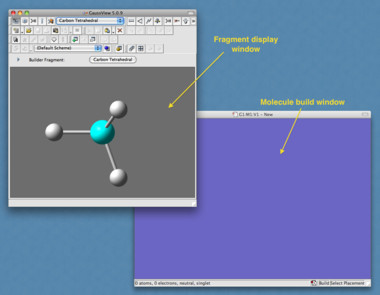
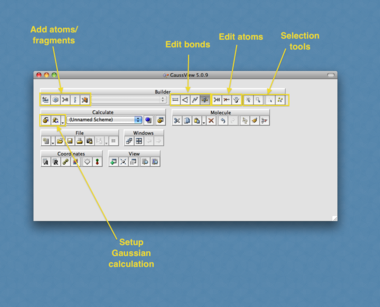
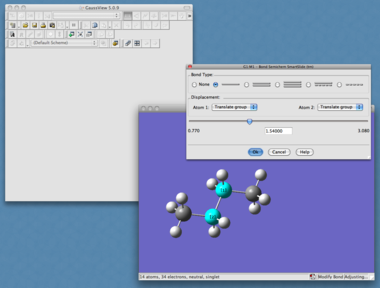
The first step is to build the molecule of interest. This involves defining the position of all atoms in the molecule and the manner in which they are connected to each other, using either cartesian or z-matrix coordinates - understandably this is not easy for us to enter by hand even for a simple molecule such as methane! To help generate the input file we use the program "GaussView". This will act as the front end for Gaussian and will completely build the input file and submit it to Gaussian for us.
Once you have built your molecule, you need to set up your calculation. The first step in this process is to optimise the structure of your molecule to the ground state minimum energy structure. If we calculate the molecules energy and plot this as a function of nuclear coordinates so that we obtain a Potential Energy Surface, this corresponds to a well in the surface (e.g. the minimum in the Morse Potential). It is of most interest as in an ensemble of molecules at room temperature and pressure, most of them lie in this region of the PES and the spectroscopic properties observed reflect this.
Setting up the calculation
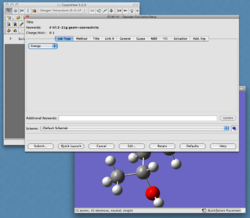
In the toolbar, select "Calculate -> Gaussian Calculation Setup" (or select the 'calculate' button from the toolbar). This will present you with the window shown in Figure 4.

This gives all the parameters available for your calculation. This can look quite daunting at first glance, but a summary of the various tabs is shown below.
- Job Type:
- Here you specify the calculation being run. Options available are:
- Energy: optimizes the electronic energy at a given set of nuclear coordinates
- Optimization: optimises the nuclear as well as electronic energy of a molecule
- Frequency
- Opt+Freq
- IRC
- Scan
- Stability
- NMR
- Here you specify the calculation being run. Options available are:
- Method
- This sets the theory and basis set for the job you are running (The basis set is a way to express the wavefunction in terms of simple mathematical functions called Gaussians)
- Title
- You can enter a title for your job here so you remember what it was
- Link [not needed in this exercise]
- Here you can start to link jobs together
- General [not needed in this exercise]
- This contains some general options for your calculations
- Guess
- This defines the initial guess for the wavefunction, i.e. the distribution of electrons. As the calculation of the wavefunction is iterative (i.e. there is no analytical solution for all but the simplest of systems so we have to keep changing our guess until the energy stops changing, called convergence) the closer the guess is to the final solution the faster our calculation is. For the first calculation you will use the "Default" setting, however after this you will want to use the output of previous calculations. To do this, select "Read Checkpoint File" (note the checkpoint file MUST have the same filename as your input file, e.g., calc1.chk if your input file name is calc1.com)
- NBO [not needed in this exercise]
- Helps the chemist visualize important features of the wavefunction by changing it to look more like orbitals found in atoms or diatoms.
- PBC [not needed in this exercise]
- Solvation
- Here you can specify the effect of having a solvation shell around the molecule. This can affect spectra so is worth experimenting with.
- Add. Input [not used in this exercise]
- You can specify additional input parameters, or use the results of other calculations in your new calculation.
Optimizing the structure
Set "Job Type" to "Optimize". In the "Method" tab, perform a "Ground State" "Semi-Empirical" calculation with "Default Spin", using the AM1 forcefield. Give your job a "Title" and ensure your "Guess" is set to 'default'. If you wish, specify a "Solvation" environment (it is worth specifying the solvent in which you are going to record a spectrum to ensure a sound basis for comparison). Once done, select "Submit". You will be prompted to save an input file; give your file an appropriate name, and submit the job to Gaussian. This is a basic calculation and will perform the first step in optimizing the structure.
Gaussian output: Two output files will result; a checkpoint file (calc1.chk) and a log file (calc1.log). Both can be displayed in GaussView, but each display different parameters about the molecule.
A more accurate model can be obtained by doing further optimizations using progressively more accurate basis sets and feeding the results of one calculation into the next. Set up a further optimization (job type: Optimize) to perform a "ground state" "DFT" calculation with "default spin" using the "B3LYP" function. This function needs a basis set; try first a calculation with the STO-3G basis set, then a further calculation with the 6-31Gd basis set. To use the previous checkpoint file (generated from the AM1 calculation above), select the "Guess" to "Read Checkpoint File". You must then save the Gaussian input file to the same filename as before for this to work. (This will overwrite your file - make sure you back up your original files first!)
BACKUP - It is good practice to backup your previous calculations, saving a copy of them to a different folder, or under a different filename. For example; if your working input filename is "calc1.com", you will obtain the output checkpoint of "calc1.chk". After doing one calculation, save a copy of this to a 'backup' directory and rename it to the conditions under which the calculation was performed; e.g., "calc1-input-AM1-optimize.chk", "calc1-input-AM1-optimize.com" etc.
Upon submitting the job to Gaussian, save your input file as "calc1.com" again, to match up with the checkpoint file from earlier calculations.
The reason for using several methods to optimize the structure is that at each stage we are using progressively more complex basis sets; by optimizing geometries with simpler basis sets first, we limit the number of trials required by the more complex calculations. Were we to use the most complex basis set to start with, a calculation would take much longer than the combined time of the preliminary stages.
After having optimized your structure with these operations, you can now determine some spectral characteristics of your molecule. For electronic spectra (UV/vis) we need to calculate orbital energies. Gaussian can predict an MO diagram for the molecule and a UV spectrum together with the MO transitions.
Predicting UV/Vis spectra
Having optimized the structure, we will use the checkpoint output from your final optimization to predict electronic spectra of your molecule.
Set "Job Type" to "Energy". The "Method" this time is a "TD-SCF" using "DFT" with a "B3LYP" function. Try using a STO-3G basis set. Remember to "Read Checkpoint File", and check the "Solvation" - this must be the same solvation shell on which the supporting calculations were based. Submit the file to Gaussian.
This may take up to 10 minutes to calculate depending on computer equipment.
Once run, load the log file into GaussView; this will then display your optimized molecule. You can now select Results -> UV/Vis spectrum to display a predicted UV/Vis spectrum. To identify the electronic transitions responsible for each peak, you will need to view the stream output file (Results -> View Stream Output File). This will look quite daunting, but scan through it; you will find a portion dedicated to "Excited states". This will tell you which MOs (molecular orbitals) electrons have been excited from/to for each peak in your UV/vis.
In order to make sense of this however, you will need to view the MO diagram. Click "Edit -> MOs", this will open a window with the MO diagram, within which you can display a graphic of each MO (select MO, click "Visualize", then "Update". You may need to reload the .chk file within the New MOs tab). You can then infer information about the change in electron density from the shapes of the MOs upon excitation of an electron, even predicting a qualitative change in dipoles. Images may be saved by right-clicking the graphics windows.
Azulene exercise
As part of the experiment, you will record a UV/vis spectrum of azulene. Use Gaussian to model azulene and to assign a transition for the three main peaks in the UV/vis spectrum. How would you expect the UV/Vis spectrum to change if one hydrogen atom around the bicyclic structure is substituted for a chlorine? Your analysis of the UV spectrum and correct identification of the main transitions will be assessed on Friday afternoon.
Compare the predicted UV/vis spectrum of Azulene with your experimentally recorded spectrum; if there are any differences, can you account for them?
It is worth bearing in mind that the output from your calculations (i.e., the excitation energy) will not exactly match with your experimental measurements (and may differ quite wildly, depending on your calculation input parameters) - why might this be?
Look on Blackboard for the "Criteria for Marking" to find out what to present to the marker.


