Y2inorg js2016
Example data set
BH3 molecule
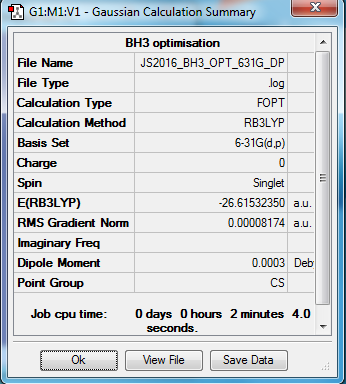
B3LYP/6-31G(d,p) level
        Item               Value     Threshold  Converged?
Maximum Force            0.000203     0.000450     YES
RMS     Force            0.000098     0.000300     YES
Maximum Displacement     0.000867     0.001800     YES
RMS     Displacement     0.000415     0.001200     YES
Frequency analysis log file Media:JS2016_BH3_FREQ.LOG
Low frequencies  ---   -0.2263   -0.1037   -0.0054   47.9770   49.0378   49.0383
Low frequencies  ---   1163.7209 1213.6704 1213.6731
optimised BH3 molecule |
| Mode # | Frequency (cm-1) | Infrared | IR active? | Vibration type |
|---|---|---|---|---|
| 1 | 1164 | 92 | Yes | Bond angle deformation |
| 2 | 1214 | 14 | Yes | Bond angle deformation |
| 3 | 1214 | 14 | Yes | Bond angle deformation |
| 4 | 2580 | 0 | No | Bond stretch |
| 5 | 2713 | 126 | Yes | Bond stretch |
| 6 | 2713 | 126 | Yes | Bond stretch |
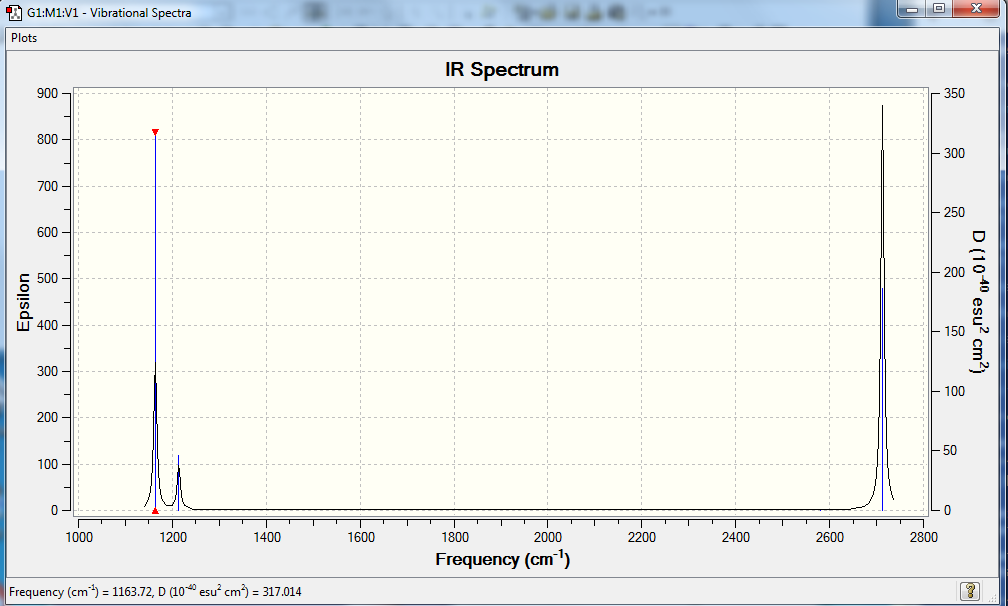
IR spectrum of BH3
Although the vibrational analysis clearly shows 6 modes of vibration, there are fewer peaks shown in the IR spectrum. This is because one mode (#4) has no intensity and there are two different degenerate pairs of vibrations, one set being a bond angle deformation (modes 2 and 3) and the other a bond stretching (modes 5 and 6). Hence there is no signal for mode 4 and one peak shown for modes 2 and 3, and one peak shown for modes 5 and 6. In total, only 3 peaks appear in the IR spectrum.
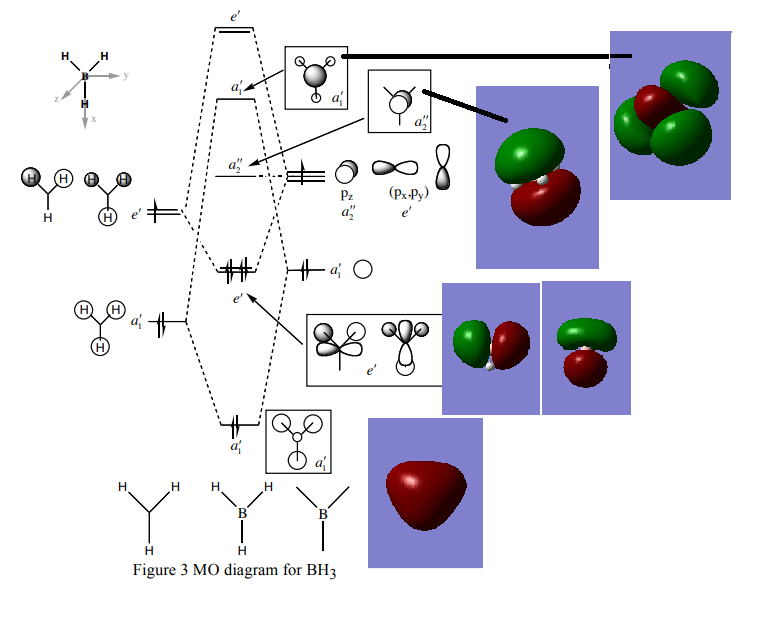
MO diagram of BH3
Ng611 (talk) What about the e' MOs?
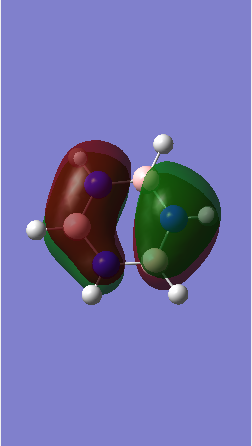
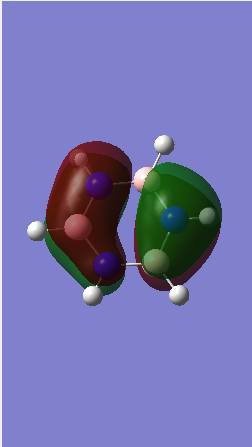
The LCAO of MOs show a great deal of similarity with the "real" MOs obtained from Gaussian as seen from the MO diagram.[1] There are slight differences i.e. with MOs a``2 and a`1. However, one can accurately predict the "real" MOs with good confidence using qualitative MO theory.
Ng611 (talk) 16:05, 29 May 2018 (BST) What are the "slight differences", be more specific in your answer. Good overall analysis though.
NH3 molecule
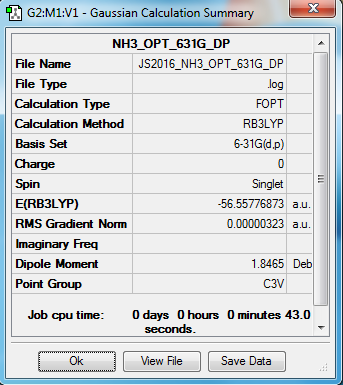
B3LYP/6-31G(d,p) level
       Item               Value     Threshold  Converged?
Maximum Force            0.000006     0.000450     YES
RMS     Force            0.000004     0.000300     YES
Maximum Displacement     0.000012     0.001800     YES
RMS     Displacement     0.000008     0.001200     YES
Frequency analysis log file Media:JS2016_NH3_FREQ_631G_DP.LOG
Low frequencies ---   -0.0138   -0.0032   -0.0015    7.0783    8.0932    8.0937
Low frequencies ---   1089.3840 1693.9368 1693.9368
optimised NH3 molecule |
BH3NH3 molecule
B3LYP/6-31G(d,p) level
        Item               Value     Threshold  Converged?
Maximum Force            0.000122     0.000450     YES
RMS     Force            0.000058     0.000300     YES
Maximum Displacement     0.000513     0.001800     YES
RMS     Displacement     0.000296     0.001200     YES
Frequency analysis log file Media:JS2016_NH3BH3_FREQ_631G_DP.LOG
Low frequencies ---   -0.0138   -0.0032   -0.0015    7.0783    8.0932    8.0937
Low frequencies ---   1089.3840 1693.9368 1693.9368
optimised NH3 molecule |
BH3-NH3 association energies
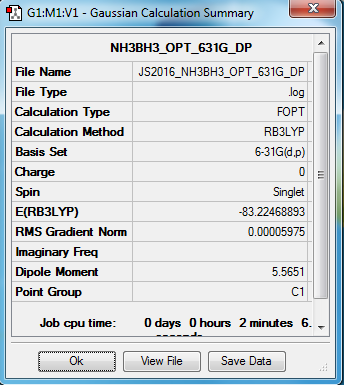
E(NH3) = -56.55776873 au
E(BH3) = -26.61532342 au
E(NH3BH3) = -83.22468888 au

ΔE = [E(NH3)+E(BH3)] + E(NH3BH3)
ΔE = 0.05159673 au = 135 kJ/mol
The B-N dative bond is weak with a dissociation energy of 135 kJ/mol, significantly lower than the C-I bond (213 kJ/mol) which is another comparatively weak bond.[2]
Ng611 (talk) 16:07, 29 May 2018 (BST) Remember to cite your bond values from a textbook, databook, or paper wherever possible.
BBr3 molecule
B3LYP/6-31G(d,p) level
        Item               Value     Threshold  Converged?
Maximum Force            0.000015     0.000450     YES
RMS     Force            0.000009     0.000300     YES
Maximum Displacement     0.000058     0.001800     YES
RMS     Displacement     0.000042     0.001200     YES
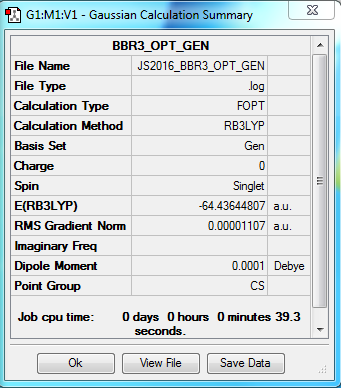
Frequency analysis log file Media:JS2016_BBR3_FREQ_GEN.log
Low frequencies ---   -4.3191   -2.7656   -2.2989   -0.0002   -0.0001    0.0002
Low frequencies ---  155.8708  155.9430  267.6975
optimised BBr3 molecule |
Link: http://hdl.handle.net/10042/202424
Aromaticity
Benzene
B3LYP/6-31G(d,p) level
        Item               Value     Threshold  Converged?
Maximum Force            0.000198     0.000450     YES
RMS     Force            0.000082     0.000300     YES
Maximum Displacement     0.000849     0.001800     YES
RMS     Displacement     0.000305     0.001200     YES
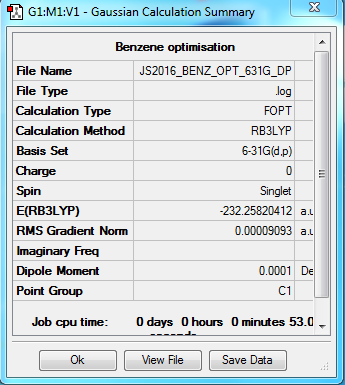
Frequency analysis log file Media:JS2016_BENZ_FREQ.LOG
Low frequencies ---  -11.6728   -0.0004    0.0007    0.0009    6.6686   15.6846
Low frequencies ---  414.0392   414.6031   621.0860
Optimised Benzene molecule |
Borazine
B3LYP/6-31G(d,p) level
       Item               Value     Threshold  Converged?
Maximum Force            0.000085     0.000450     YES
RMS     Force            0.000033     0.000300     YES
Maximum Displacement     0.000249     0.001800     YES
RMS     Displacement     0.000077     0.001200     YES
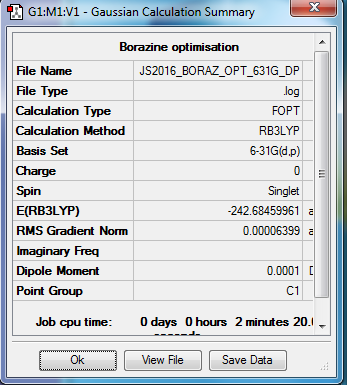
Frequency analysis log file Media:JS2016_BORAZ_FREQ.LOG
Low frequencies ---  -17.8308  -12.6833   -9.1489   -0.0008   -0.0006    0.0012
Low frequencies ---  289.0049  289.4700   404.2277
Optimised Borazine molecule |
NBO charge analysis
| Benzene | Borazine |
|---|---|
 |

|
| Benzene | Borazine | ||
|---|---|---|---|
| Carbon | -0.24 | Nitrogen | -1.102 |
| Hydrogen | 0.24 | Boron | 0.747 |
| Hydrogen (N-H) | 0.432 | ||
| Hydrogen (B-H) | -0.077 |
Ng611 (talk) 16:10, 29 May 2018 (BST) Good charge analysis.
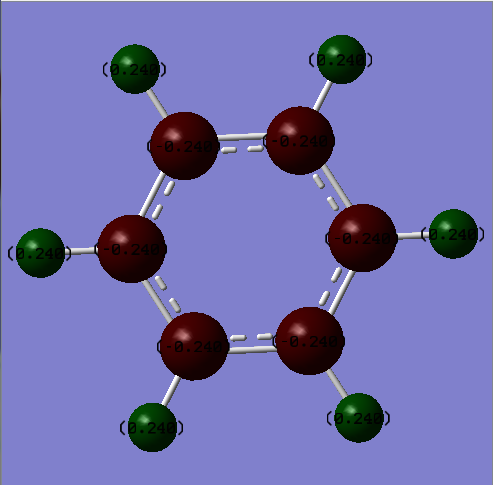
The charge distribution diagram of benzene illustrates that most of the electron density is localized on the pi ring system. The point group of benzene is D6h which corresponds to a charge of -0.24 on all the carbon atoms and a charge of 0.24 on all the hydrogen atoms as shown. Borazine, on the other hand, has a rather more complex charge distribution. The nitrogen atoms have the most negative charge (-1.102) so most of the electron density will be found at and very close to these nitrogen atoms. The neighbouring atoms to nitrogen as a result have positive charges, where boron has a charge of 0.747 and hydrogen (B-H) has a charge of 0.432. Lastly, the hydrogen atoms bonded to boron have a charge of -0.077. Albeit a small negative charge, these hydrogen atoms have retained electron density and are hydridic in character because of their distance from the electronegative nitrogen atoms.
Ng611 (talk) 16:10, 29 May 2018 (BST) What about the overall summation of charges? Good discussion of symmetry for benzene, but what about borazine -- how are the partial charges there related by symmetry?
MO comparison
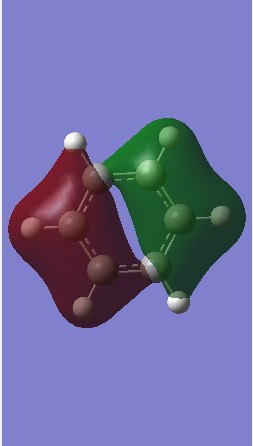
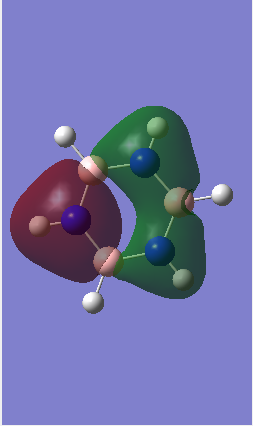
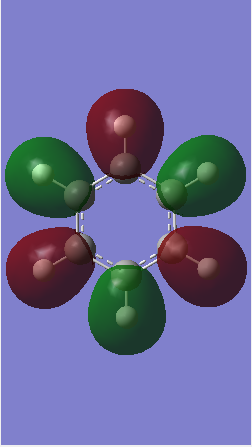
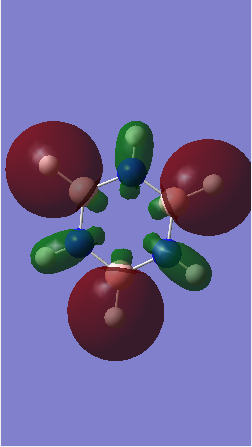
Ng611 (talk) 16:13, 29 May 2018 (BST) Well done for comparing the correct MOs by shape and not energtic ordering (which is not necessarily reliable). Perhaps consider discussing the constituent AOs that form the MOs and the overall symmetry of the MO (sigma, pi etc); you've done this for one of the MOs, but not the other.
Discussion
The concept of aromaticity is normally associated with a greater than expected stabilisation of a molecule's energy due to its adopted geometry. Hückel's rule is one way of predicting whether aromaticity can arise. The criteria for a molecule are:
1. It must have 4n + 2 electrons in a conjugated system of p orbitals.
2. It must be cyclic and planar.
3. It must have a contiguous ring of p orbitals.
Hückel's rule is quite a simple way of describing aromatic systems and is very heavily linked to the idea that overlapping pz orbitals are the main contributing factor to the stabilization of the overall molecule. However the criterion of planarity for an aromatic system does not need to be followed, for example Hirsch introduced the notion that the three dimensional aromaticity exhibited in fullerenes can only occur if there are 2(n+1)2 π-electrons.[3] The stabilisation of a 3-D structure coupled with this breaking of planarity illustrates that overlapping pz orbitals is an inadequate description of aromaticity. Note that the 4n + 2 condition is broken in this case. σ orbitals can also be involved in saturated inorganic rings and their aromatic properties.[4]
This traditional view of aromaticity involving Hückel's rule can only really be classed for monocyclic systems but for more complex molecules, we need to use MO theory and the visualizations of these orbitals. The MOs inspected above in benzene and borazine give orbitals that span the whole molecule, so clearly only considering pz orbitals overlapping with each other is insufficient in painting an accurate picture of our aromatic system. This holistic approach ties in well with certain properties such as bond lengths where no single or double bond lengths are found but rather intermediate values.[5]
Ng611 (talk) 16:17, 29 May 2018 (BST) Beginnings of a really good discussion here, but I'd include some more detail. What other experimental techniques may be used to determine aromaticity? Using, benzene and borazine as examples, what studies have other researchers performed to better understand differences between them?
Ng611 (talk) 16:17, 29 May 2018 (BST) A pretty good report here. Some additional discussion in your final sections was needed, but besides that, well done!
- ↑ MO diagram is from Lecture 4 tutorial problem sheet of MO Theory (Patricia Hunt).
- ↑ https://ch301.cm.utexas.edu/section2.php?target=thermo/thermochemistry/enthalpy-bonds.html
- ↑ P. Von Ragué Schleyer, Chem. Rev., 2001, 101, 1115–1117.
- ↑ Z. H. Li, D. Moran, K. N. Fan and P. Von Ragué Schleyer, J. Phys. Chem. A, 2005, 109, 3711–3716.
- ↑ M. Palusiak and T. M. Krygowski, Chem. - A Eur. J., 2007, 13, 7996–8006.

