Y2 Inorg Comp Lab:hmr17
Part 1
BH3
Method: B3LYP Basis Set: 6-31G (d p)
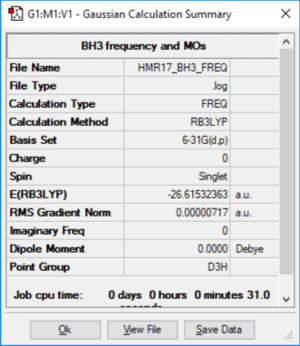
BH3 |
         Item               Value     Threshold  Converged?
 Maximum Force            0.000014     0.000450     YES
 RMS     Force            0.000007     0.000300     YES
 Maximum Displacement     0.000056     0.001800     YES
 RMS     Displacement     0.000028     0.001200     YES
 Low frequencies ---   -8.2092   -1.7273   -0.0055    0.6025    6.1863    6.4229
 Low frequencies --- 1162.9646 1213.1613 1213.1640

| Mode # | Freq. / cm-1 | Intensity | Symmetry | IR Active? | Type of Vibration |
|---|---|---|---|---|---|
| 1 | 1162 | 92.5515 | A2'' | Yes | Out-of-plane bend |
| 2 | 1213 | 14.0536 | E' | Yes (small, degenerate) | Bend |
| 3 | 1213 | 14.0573 | E' | Yes (small,degenerate) | Bend |
| 4 | 2582 | 0.0000 | A1' | No | Stretch (symmetric) |
| 5 | 2715 | 126.3263 | E' | Yes (degenerate) | Stretch |
| 6 | 2715 | 126.3168 | E' | Yes (degenerate) | Stretch |
Only three peaks are observed because in the six vibrational modes, there are two pairs of degenerate modes (removing 2 potential peaks), and one that is not IR active (removing the third missing peak).
Good structure and vibrational information but you are missing the associated log file and the IR spectrum. Smf115 (talk) 22:12, 16 May 2019 (BST)
The calculated MOs for BH3 are naturally not precisely the same as the LCAO prediction[1], but the combinations of atomic orbitals are still clearly visible. The order of the molecular orbitals in energy was also matched the predicted diagram, although this is not shown in the pictures. These two factors suggest that qualitative MO theory is still very useful for gaining a general idea of the order and shape of orbitals in a molecule.
Good inclusion of the calculated MOs on to the MO diagram although you should have added the LCAOs for the top e' orbitals on to the diagram too. Your evaluation of the usefulness of the LCAO approach is nice, to improve you could consider the smaller differences between the real and the LCAO MOs. Smf115 (talk) 22:12, 16 May 2019 (BST)
NH3
Method: B3LYP Basis Set: 6-31G (d p)
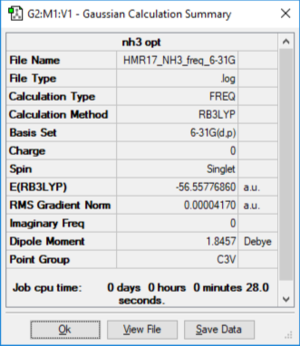
NH3 |
         Item               Value     Threshold  Converged?
 Maximum Force            0.000059     0.000450     YES
 RMS     Force            0.000040     0.000300     YES
 Maximum Displacement     0.000370     0.001800     YES
 RMS     Displacement     0.000163     0.001200     YES
 Low frequencies ---  -33.0887  -33.0760  -12.4730   -0.0037    0.0074    0.0508
 Low frequencies --- 1088.6672 1694.0137 1694.0141
BH3.NH3
Method: B3LYP Basis Set: 6-31G (d p)
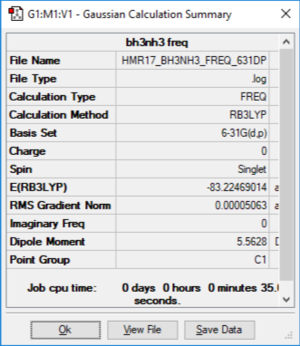
File:Y2ICL-hmr17-BH3NH3-freq-631dp.log
BH3NH3 |
          Item               Value     Threshold  Converged?
  Maximum Force            0.000123     0.000450     YES
  RMS     Force            0.000035     0.000300     YES
  Maximum Displacement     0.000888     0.001800     YES
  RMS     Displacement     0.000340     0.001200     YES

  Low frequencies ---    0.0007    0.0010    0.0013    7.4776   15.3858   20.3928
  Low frequencies ---  263.4212  631.4633  638.2239
Association Energy
Taken raw values output by Gaussian without rounding before calculation (rounded values shown in brackets):
E(NH3)= -56.55776860 a.u. (=-56.55777 a.u.)
E(BH3)= -26.61532363 a.u. (=-26.61532 a.u.)
E(NH3BH3)= -83.22469014 a.u. (=-83.22469 a.u.)
ΔE=E(NH3BH3)-[E(NH3)+E(BH3)]
= -83.22469014 - (-56.55776860 - 26.61532363)
= -0.05159791 a.u. (= -135.470 kJ mol-1)
Based on the strengths of a C-C single bond, 345 kJ mol-1[2], and a F-F single bond, 160 kJ mol-1[2] the B-N bond strength is relatively weak.
Correct calculation, great presentation of the energies and comparison to referenced literature values! Just remember to consider the accuracy of your final reported energy value. Smf115 (talk) 22:16, 16 May 2019 (BST)
NI3
Method: B3LYP Basis Set: 6-31G (d p), LanL2DZ
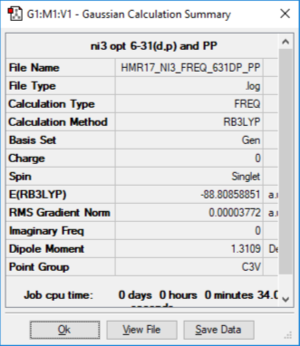
File:Y2ICL-HMR17 NI3 FREQ 631DP PP.LOG
NI3 |
          Item               Value     Threshold  Converged?
  Maximum Force            0.000063     0.000450     YES
  RMS     Force            0.000038     0.000300     YES
  Maximum Displacement     0.000476     0.001800     YES
  RMS     Displacement     0.000273     0.001200     YES

 Low frequencies ---  -12.7347  -12.7286   -6.2858   -0.0040    0.0188    0.0634
 Low frequencies ---  101.0320  101.0328  147.4111
Optimised N-I distance: 2.184 Å (raw output = 2.18363)
.
Project
N(CH4)3+

Method: B3LYP Basis Set: 6-31G (d p)
File:Y2ICL-HMR17 N(CH3)4 FREQ 631DP.LOG
N(CH3)4+ |
         Item               Value     Threshold  Converged?
 Maximum Force            0.000048     0.000450     YES
 RMS     Force            0.000018     0.000300     YES
 Maximum Displacement     0.000691     0.001800     YES
 RMS     Displacement     0.000201     0.001200     YES

 Low frequencies ---  -14.4299    0.0006    0.0008    0.0011    4.5438   21.4953
 Low frequencies ---  184.6284  286.5380  289.0924
P(CH4)3+

Method: B3LYP Basis Set: 6-31G (d p)
File:Y2ICL-HMR17 P(CH3)4 FREQ 631DP.LOG
P(CH3)4+ |
         Item               Value     Threshold  Converged?
 Maximum Force            0.000094     0.000450     YES
 RMS     Force            0.000025     0.000300     YES
 Maximum Displacement     0.001545     0.001800     YES
 RMS     Displacement     0.000460     0.001200     YES

Low frequencies ---  -23.6305   -3.4839   -0.0025   -0.0008    0.0006   21.0081
Low frequencies ---  154.9014  189.6090  191.7782
.
Analysis & Discussion
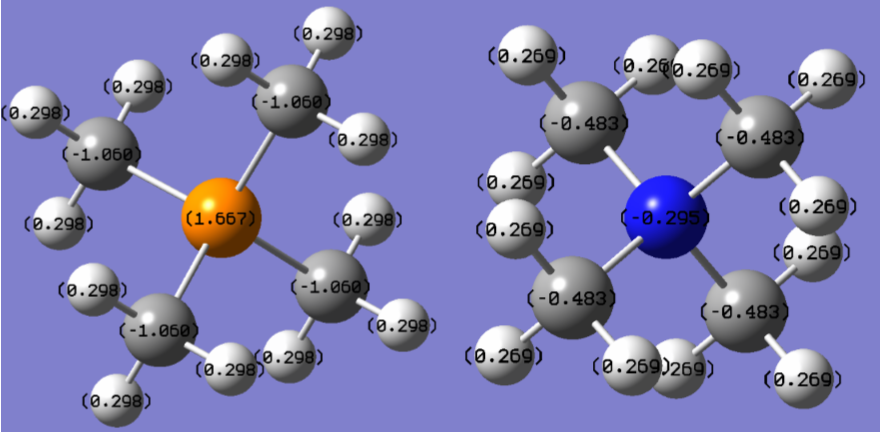
Tabulated Charge Data
| Atom (N(CH4)3+) | Charge/e | Atom (P(CH4)3+) | Charge/e |
|---|---|---|---|
| N | -0.295 | P | +1.667 |
| C | -0.483 | C | -1.060 |
| H | 0.269 | H | 0.298 |
In the two ions, nitrogen is calculated as having a negative charge and phosphorus a positive charge. This could be explained by the electronegativities of the two relative to carbon; nitrogen has a significantly higher electronegativity and phosphorus's is significantly lower.
Well presented NBO charges and the electronegativity argument is correct but too brief. However, you should have developed the discussion a lot further, considering other effects and the full range of atoms in the molecule. Your images also lack the colour scales highlighting the charge distributions across them which was required. Smf115 (talk) 21:44, 19 May 2019 (BST)
Comparing the calculated charges to the formal structure with the positive charge placed on the central atom reveals a significant discrepancy for the ammonium ion: the overall charge density on nitrogen (and carbon) is lower, and all the positive charge can only be described as distributed over the outer hydrogens. In the traditional picture, the formal positive charge on nitrogen comes from the Lewis structure, which does not intrinsically take account of any phenomena more complex than sharing pairs of electrons evenly between atoms, with simple electron counting producing a deficit on nitrogen.
Example valence orbitals from tetramethylammonium.
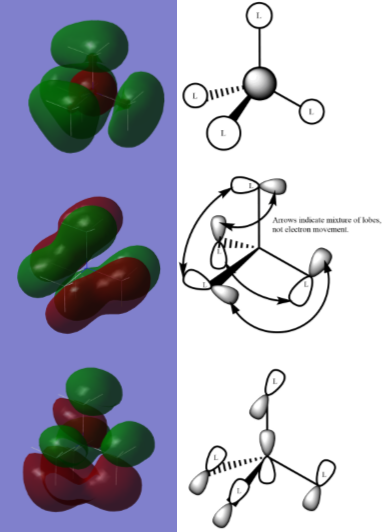
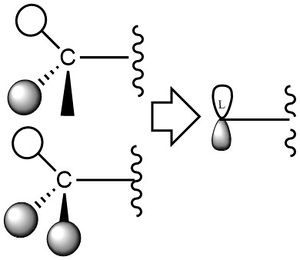
The calculated molecular orbitals of tetramethylammonium ion can be compared to LCAO diagrams to make observations about which of the atomic orbitals are involved in forming that particular molecular orbital to a significant degree. Left is an example, using the label L to signify that orbitals used are in fact methyl fragment orbitals with approximately the right shape to be used in the demonstrative diagrams, rather than true s or p orbitals.
In the first diagram, HOMO-11, the ligand fragment orbitals are represented similarly to s-orbitals, although the possible involvement of the carbon 2p orbital (as shown below), or out-of-phase s orbital, may explain the lengthening of the central lobe at bonds observed.

In the other diagrams, the ligand group orbitals are more complex, likely involving the two configurations of hydrogen 1s orbitals resulting in antibonding character and/or a non-bonding atomic orbital in each group, as well as influence from the atomic orbitals of carbon. The two relevent configuration of hydrogen orbital phases are shown below. The various arrangements of p-like orbitals are possible because of the number of configurations of the hydrogen and carbon atomic orbitals, but the approximation is useful for demonstrative purposes despite this.
An ok range of MOs chosen, however, you refer to them as HOMOs when each molecule will only have one HOMO and LUMO so I don't understand where these terms have come from. You've attempted to construct the ligand FOs but sadly they aren't correct and you should have considered the BH3 MO diagram and its application to CH3. Presentation wise, while your structures are neat, the comment on the image can't be read and when labelling 'mixing' think about the technical terms you could use to describe these interactions (e.g. antibonding or bonding interaction?). Smf115 (talk) 21:09, 21 May 2019 (BST)
Overall, a decent effort but the project section analysis parts needed a bit more consideration. Smf115 (talk) 21:09, 21 May 2019 (BST)
- ↑ 1.0 1.1 BH3 LCAO MO diagam, Patricia Hunt, taken from http://www.huntresearchgroup.org.uk/teaching/teaching_comp_lab_year2a/Tut_MO_diagram_BH3.pdf (accessed 09/05/19).
- ↑ 2.0 2.1 Openstax, Chemistry, 2012 Creative Commons. Accessed via https://opentextbc.ca/chemistry/, 9/5/19
