Y2T301339518
BH3
The optimisation finds the ground state of a given molecule. Mathematically, it’s the point at which , where V is the potential energy and r is the separation distance between a given set of atoms bound to each other.
Optimisation of BH3 via 3-21G
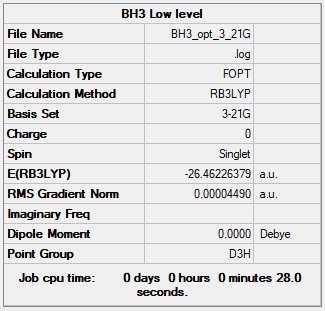
Item               Value     Threshold  Converged?
 Maximum Force            0.000090     0.000450     YES
 RMS     Force            0.000059     0.000300     YES
 Maximum Displacement     0.000350     0.001800     YES
 RMS     Displacement     0.000229     0.001200     YES
 Predicted change in Energy=-4.546985D-08
 Optimization completed.
    -- Stationary point found.
                           ----------------------------
                           !   Optimized Parameters   !
                           ! (Angstroms and Degrees)  !
 --------------------------                            --------------------------
 ! Name  Definition              Value          Derivative Info.                !
 --------------------------------------------------------------------------------
 ! R1    R(1,2)                  1.1945         -DE/DX =   -0.0001              !
 ! R2    R(1,3)                  1.1945         -DE/DX =   -0.0001              !
 ! R3    R(1,4)                  1.1945         -DE/DX =   -0.0001              !
 ! A1    A(2,1,3)              120.0            -DE/DX =    0.0                 !
 ! A2    A(2,1,4)              120.0            -DE/DX =    0.0                 !
 ! A3    A(3,1,4)              120.0            -DE/DX =    0.0                 !
 ! D1    D(2,1,4,3)            180.0            -DE/DX =    0.0                 !
 --------------------------------------------------------------------------------
The optimisation file is linked here
Optimisation of BH3 via 6-31G
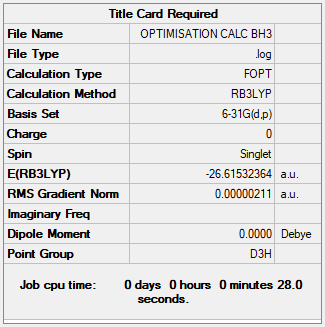
The 6-31G(d,p) basis set is regarded as more accurate, and it returns a more stable energy for BH3.
Item               Value     Threshold  Converged?
 Maximum Force            0.000004     0.000450     YES
 RMS     Force            0.000003     0.000300     YES
 Maximum Displacement     0.000017     0.001800     YES
 RMS     Displacement     0.000011     0.001200     YES
 Predicted change in Energy=-1.021830D-10
 Optimization completed.
    -- Stationary point found.
                           ----------------------------
                           !   Optimized Parameters   !
                           ! (Angstroms and Degrees)  !
 --------------------------                            --------------------------
 ! Name  Definition              Value          Derivative Info.                !
 --------------------------------------------------------------------------------
 ! R1    R(1,2)                  1.1923         -DE/DX =    0.0                 !
 ! R2    R(1,3)                  1.1923         -DE/DX =    0.0                 !
 ! R3    R(1,4)                  1.1923         -DE/DX =    0.0                 !
 ! A1    A(2,1,3)              120.0            -DE/DX =    0.0                 !
 ! A2    A(2,1,4)              120.0            -DE/DX =    0.0                 !
 ! A3    A(3,1,4)              120.0            -DE/DX =    0.0                 !
 ! D1    D(2,1,4,3)            180.0            -DE/DX =    0.0                 !
 --------------------------------------------------------------------------------
The optimisation file is linked here
Ng611 (talk) 12:12, 7 June 2019 (BST) We need your frequency log file here. In every calculation, you provided your .log file for your initial optimaisation, not your frequency analysis. We need your frequency summary tables and log files. Unfortunately, you didn't do this for the other two species (NH3 and BH3NH3).
IR activity of BH3
Low frequencies ---  -11.7009  -11.6930   -6.5683   -0.0008    0.0280    0.4286
 Low frequencies --- 1162.9745 1213.1389 1213.1392
 Diagonal vibrational polarizability:
        0.7179797       0.7179479       1.8418514
 Harmonic frequencies (cm**-1), IR intensities (KM/Mole), Raman scattering
 activities (A**4/AMU), depolarization ratios for plane and unpolarized
 incident light, reduced masses (AMU), force constants (mDyne/A),
 and normal coordinates:
                      1                      2                      3
                     A2"                    E'                     E'
 Frequencies --   1162.9745              1213.1389              1213.1392
 Red. masses --      1.2531                 1.1072                 1.1072
 Frc consts  --      0.9986                 0.9600                 0.9600
 IR Inten    --     92.5682                14.0550                14.0544
  Atom  AN      X      Y      Z        X      Y      Z        X      Y      Z
     1   5     0.00   0.00   0.16    -0.10   0.00   0.00     0.00   0.10   0.00
     2   1     0.00   0.00  -0.57     0.81   0.00   0.00     0.00   0.08   0.00
     3   1     0.00   0.00  -0.57     0.14   0.39   0.00    -0.39  -0.59   0.00
     4   1     0.00   0.00  -0.57     0.14  -0.39   0.00     0.39  -0.59   0.00
                      4                      5                      6
                     A1'                    E'                     E'
 Frequencies --   2582.5816              2715.7183              2715.7192
 Red. masses --      1.0078                 1.1273                 1.1273
 Frc consts  --      3.9604                 4.8987                 4.8987
 IR Inten    --      0.0000               126.3320               126.3260
  Atom  AN      X      Y      Z        X      Y      Z        X      Y      Z
     1   5     0.00   0.00   0.00     0.11   0.00   0.00     0.00   0.11   0.00
     2   1     0.00   0.58   0.00     0.02   0.00   0.00     0.00  -0.81   0.00
     3   1     0.50  -0.29   0.00    -0.60   0.36   0.00     0.36  -0.19   0.00
     4   1    -0.50  -0.29   0.00    -0.60  -0.36   0.00    -0.36  -0.19   0.00
The frequency file is linked here
BH optimised via 6-31G |
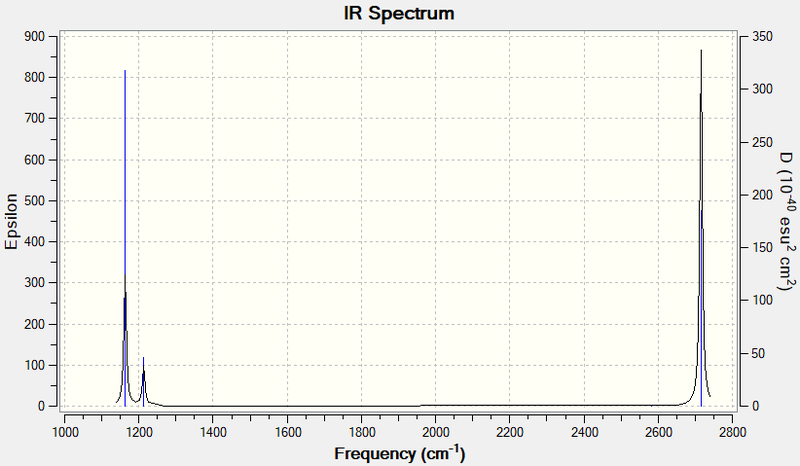
For BH3, as it's a non-linear molecule, the number of vibrational modes it has is , where is the number of atoms (4). Therefore, it has 6 vibrational modes. This does not consider the degeneracy of the vibrational modes, or whether the vibrational mode has a change in dipole moment. In the IR spectrum below, only 3 peaks which can be seen. One of the vibrational modes has no change in dipole moment, therefore it is not IR active. For the other 2 peaks, they're each composed of 2 modes which are degenerate in energy, so they overlap each other and cannot be distinguished.
| Wavenumber (cm-1 | Intensity (arbitrary units) | Symmetry label | IR active | Type |
| 1162.97 | 816.53 | A2" | Yes | sp2 out of plane bend |
| 1213.14 | 118.85 | E' | Yes | sp2 in plane bend |
| 1213.14 | 118.85 | E' | Yes | sp2 in plane bend |
| 2715.72 | 477.21 | E' | Yes | sp2 asymmetric stretch |
| 2715.72 | 477.19 | E' | Yes | sp2 asymmetric stretch |
Ng611 (talk) 12:13, 7 June 2019 (BST) What about the IR inactive mode?
BH3 MO diagram
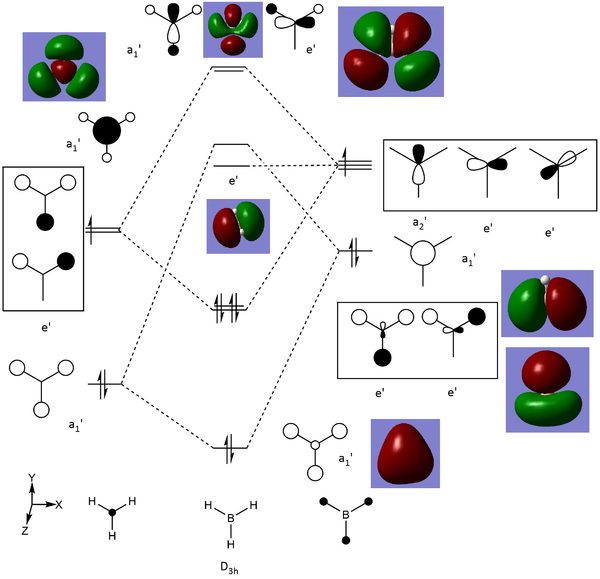
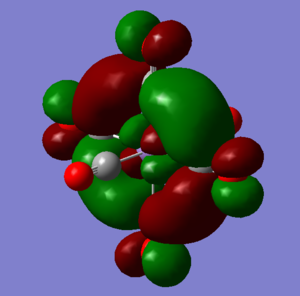
The use of a qualitative MO diagram (shown in Fig), gives a good representation of the shape of the orbitals and a moderate idea of the relative energy ordering of the orbital. The relative energy ordering is subjective and for any order to be confirmed, calculations are required. However, for the geometry of the orbitals, a qualitative MO diagram is adequate. The main features of each MO are still present in both the LCAO's and the computed MO's, such as the presence of nodes in the anti-bonding MOs (ABMOs) and the density of the MO's around given atoms.
Ng611 (talk) 12:14, 7 June 2019 (BST) Good.
NH3
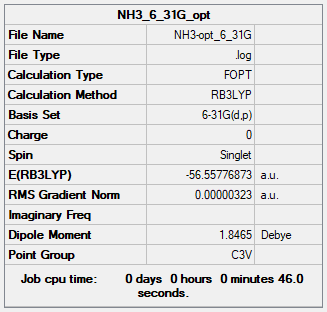
Optimisation of NH3
        Item               Value     Threshold  Converged?
 Maximum Force            0.000006     0.000450     YES
 RMS     Force            0.000004     0.000300     YES
 Maximum Displacement     0.000012     0.001800     YES
 RMS     Displacement     0.000008     0.001200     YES
 Predicted change in Energy=-9.844182D-11
 Optimization completed.
    -- Stationary point found.
                           ----------------------------
                           !   Optimized Parameters   !
                           ! (Angstroms and Degrees)  !
 --------------------------                            --------------------------
 ! Name  Definition              Value          Derivative Info.                !
 --------------------------------------------------------------------------------
 ! R1    R(1,2)                  1.018          -DE/DX =    0.0                 !
 ! R2    R(1,3)                  1.018          -DE/DX =    0.0                 !
 ! R3    R(1,4)                  1.018          -DE/DX =    0.0                 !
 ! A1    A(2,1,3)              105.7446         -DE/DX =    0.0                 !
 ! A2    A(2,1,4)              105.7446         -DE/DX =    0.0                 !
 ! A3    A(3,1,4)              105.7446         -DE/DX =    0.0                 !
 ! D1    D(2,1,4,3)           -111.8637         -DE/DX =    0.0                 !
 --------------------------------------------------------------------------------
The optimisation file is here
NI optimised via 6-31G |
Ammonia-Borane
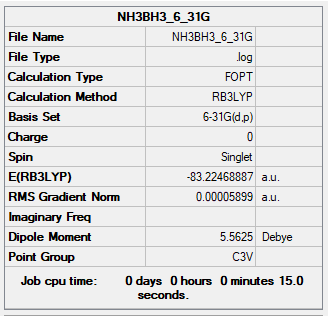
Item               Value     Threshold  Converged?
 Maximum Force            0.000137     0.000450     YES
 RMS     Force            0.000038     0.000300     YES
 Maximum Displacement     0.000766     0.001800     YES
 RMS     Displacement     0.000177     0.001200     YES
 Predicted change in Energy=-1.143978D-07
 Optimization completed.
    -- Stationary point found.
                           ----------------------------
                           !   Optimized Parameters   !
                           ! (Angstroms and Degrees)  !
 --------------------------                            --------------------------
 ! Name  Definition              Value          Derivative Info.                !
 --------------------------------------------------------------------------------
 ! R1    R(1,2)                  1.2097         -DE/DX =    0.0                 !
 ! R2    R(1,3)                  1.2097         -DE/DX =    0.0                 !
 ! R3    R(1,4)                  1.2097         -DE/DX =    0.0                 !
 ! R4    R(1,5)                  1.6686         -DE/DX =   -0.0001              !
 ! R5    R(5,6)                  1.0185         -DE/DX =    0.0                 !
 ! R6    R(5,7)                  1.0185         -DE/DX =    0.0                 !
 ! R7    R(5,8)                  1.0185         -DE/DX =    0.0                 !
 ! A1    A(2,1,3)              113.9013         -DE/DX =    0.0                 !
 ! A2    A(2,1,4)              113.9013         -DE/DX =    0.0                 !
 ! A3    A(2,1,5)              104.563          -DE/DX =    0.0001              !
 ! A4    A(3,1,4)              113.9013         -DE/DX =    0.0                 !
 ! A5    A(3,1,5)              104.563          -DE/DX =    0.0001              !
 ! A6    A(4,1,5)              104.563          -DE/DX =    0.0001              !
 ! A7    A(1,5,6)              111.0363         -DE/DX =    0.0                 !
 ! A8    A(1,5,7)              111.0363         -DE/DX =    0.0                 !
 ! A9    A(1,5,8)              111.0363         -DE/DX =    0.0                 !
 ! A10   A(6,5,7)              107.8618         -DE/DX =    0.0                 !
 ! A11   A(6,5,8)              107.8618         -DE/DX =    0.0                 !
 ! A12   A(7,5,8)              107.8618         -DE/DX =    0.0                 !
 ! D1    D(2,1,5,6)            -60.0            -DE/DX =    0.0                 !
 ! D2    D(2,1,5,7)            180.0            -DE/DX =    0.0                 !
 ! D3    D(2,1,5,8)             60.0            -DE/DX =    0.0                 !
 ! D4    D(3,1,5,6)            180.0            -DE/DX =    0.0                 !
 ! D5    D(3,1,5,7)             60.0            -DE/DX =    0.0                 !
 ! D6    D(3,1,5,8)            -60.0            -DE/DX =    0.0                 !
 ! D7    D(4,1,5,6)             60.0            -DE/DX =    0.0                 !
 ! D8    D(4,1,5,7)            -60.0            -DE/DX =    0.0                 !
 ! D9    D(4,1,5,8)            180.0            -DE/DX =    0.0                 !
 --------------------------------------------------------------------------------
The optimisation file is here
NI optimised via 6-31G |
With considerations for the energy of BH3 (-26.61532364 a.u), NH3 (-56.55776873 a.u) and H3B-NH3 (-83.22468887 a.u), the difference in energy between the 2 molecules and the single molecule is -0.0515965 a.u. For more contextual units, that's 135.5 kJmol-1. This corresponds to the energy of the B-N bond. A C-C bond is 346 kJmol-1 [1], which is moderate. A B-N bond in comparison is much weaker.
Ng611 (talk) 12:18, 7 June 2019 (BST) Think carefully about the accuracy to which you report your values.
NI3
Optimisation
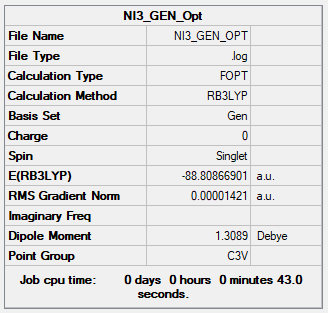
Item               Value     Threshold  Converged?
 Maximum Force            0.000027     0.000450     YES
 RMS     Force            0.000021     0.000300     YES
 Maximum Displacement     0.000192     0.001800     YES
 RMS     Displacement     0.000126     0.001200     YES
 Predicted change in Energy=-8.028147D-09
 Optimization completed.
    -- Stationary point found.
                           ----------------------------
                           !   Optimized Parameters   !
                           ! (Angstroms and Degrees)  !
 --------------------------                            --------------------------
 ! Name  Definition              Value          Derivative Info.                !
 --------------------------------------------------------------------------------
 ! R1    R(1,2)                  2.1836         -DE/DX =    0.0                 !
 ! R2    R(1,3)                  2.1836         -DE/DX =    0.0                 !
 ! R3    R(1,4)                  2.1836         -DE/DX =    0.0                 !
 ! A1    A(2,1,3)              110.8866         -DE/DX =    0.0                 !
 ! A2    A(2,1,4)              110.8866         -DE/DX =    0.0                 !
 ! A3    A(3,1,4)              110.8866         -DE/DX =    0.0                 !
 ! D1    D(2,1,4,3)            123.6452         -DE/DX =    0.0                 !
 --------------------------------------------------------------------------------
The optimisation file is here
Ng611 (talk) 12:19, 7 June 2019 (BST) Good calculation.
Frequency calculation
Low frequencies ---   -0.0576   -0.0292   -0.0031    1.9682    2.0035    2.2189
 Low frequencies ---  101.3080  101.3087  148.3159
 Diagonal vibrational polarizability:
       12.4608723      12.4575690       1.3046911
 Harmonic frequencies (cm**-1), IR intensities (KM/Mole), Raman scattering
 activities (A**4/AMU), depolarization ratios for plane and unpolarized
 incident light, reduced masses (AMU), force constants (mDyne/A),
 and normal coordinates:
                      1                      2                      3
                      E                      E                     A1
 Frequencies --    101.3080               101.3087               148.3159
 Red. masses --    115.8870               115.8871               104.7718
 Frc consts  --      0.7008                 0.7008                 1.3579
 IR Inten    --      1.0245                 1.0246                 0.8821
  Atom  AN      X      Y      Z        X      Y      Z        X      Y      Z
     1   7     0.00   0.31   0.00    -0.31   0.00   0.00     0.00   0.00  -0.44
     2  53     0.00   0.54   0.01     0.56   0.00   0.00     0.00   0.52   0.02
     3  53    -0.47  -0.29   0.00    -0.26   0.47  -0.01     0.45  -0.26   0.02
     4  53     0.47  -0.29   0.00    -0.26  -0.47   0.01    -0.45  -0.26   0.02
                      4                      5                      6
                     A1                      E                      E
 Frequencies --    361.2374               468.9935               469.0019
 Red. masses --     14.8160                14.7159                14.7159
 Frc consts  --      1.1391                 1.9071                 1.9072
 IR Inten    --      1.0935                79.8887                79.8677
  Atom  AN      X      Y      Z        X      Y      Z        X      Y      Z
     1   7     0.00   0.00   1.00     1.00   0.00   0.00     0.00   1.00   0.00
     2  53     0.00   0.03  -0.04    -0.01   0.00   0.00     0.00  -0.06   0.02
     3  53     0.03  -0.02  -0.04    -0.05   0.02   0.02     0.02  -0.03  -0.01
     4  53    -0.03  -0.02  -0.04    -0.05  -0.02  -0.02    -0.02  -0.03  -0.01
The frequency file is here
NI Nitrogen was optimised by 6-31G, whereas the iodine atoms were optimised via pseudo potential (LanL2DZ) |
The optimised N-I bond distance is 0.218 nm. Due to the unstable nature of the N-I bond, it is difficult to find literature regarding empirical evidence for the bond length.
Metal Carbonyls
Carbon monoxide, while toxic, has much use within the field of transition metal complex as a π acceptor ligand, especially for manipulating the Δ value within a complex. As well as that, they have shown much use for measuring the trans effects from other ligands. Here, calculations were made to understand the effects of changing the metal centre in hexacarbonyl complexes.
[V(CO)6]-
Optimisation of the anion
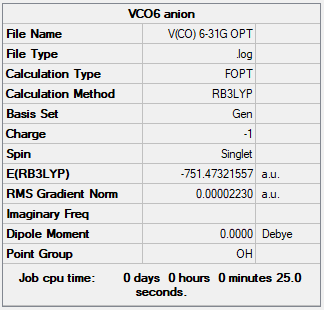
Item               Value     Threshold  Converged?
 Maximum Force            0.000080     0.000450     YES
 RMS     Force            0.000030     0.000300     YES
 Maximum Displacement     0.000532     0.001800     YES
 RMS     Displacement     0.000254     0.001200     YES
 Predicted change in Energy=-1.235706D-07
 Optimization completed.
    -- Stationary point found.
The file is here
Frequency Analysis
Low frequencies ---   -0.0012   -0.0011   -0.0010    5.5219    5.5220    5.5220
Low frequencies ---   50.4353   50.4353   50.4353
[V(CO)] |
The file is here
[Cr(CO)6]
Optimisation of the complex
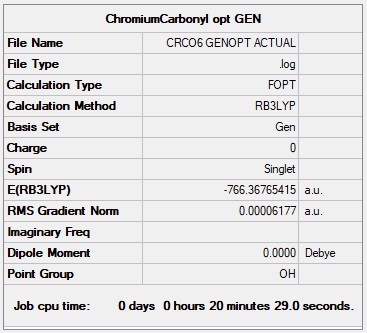
Item               Value     Threshold  Converged?
 Maximum Force            0.000109     0.000450     YES
 RMS     Force            0.000041     0.000300     YES
 Maximum Displacement     0.000703     0.001800     YES
 RMS     Displacement     0.000333     0.001200     YES
 Predicted change in Energy=-2.360252D-07
 Optimization completed.
    -- Stationary point found.
The file is here
Frequency Analysis
The file is here
Low frequencies ---    0.0009    0.0011    0.0012    5.2328    5.2329    5.2330
Low frequencies ---   65.2259   65.2260   65.2260
[Cr(CO)] |
[Mn(CO)6]+
Optimisation of the cation
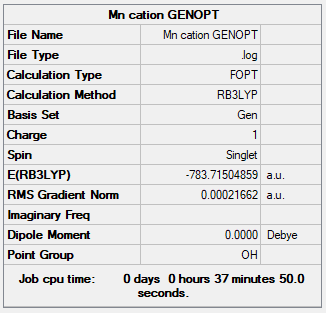
Item               Value     Threshold  Converged?
 Maximum Force            0.000382     0.000450     YES
 RMS     Force            0.000132     0.000300     YES
 Maximum Displacement     0.000237     0.001800     YES
 RMS     Displacement     0.000083     0.001200     YES
 Predicted change in Energy=-3.146435D-07
 Optimization completed.
    -- Stationary point found.
The file is here
Frequency Analysis
The file is here
Low frequencies ---    0.0010    0.0012    0.0013    5.9353    5.9353    5.9353
Low frequencies ---   76.1371   76.1371   76.1371
[Mn(CO)] |
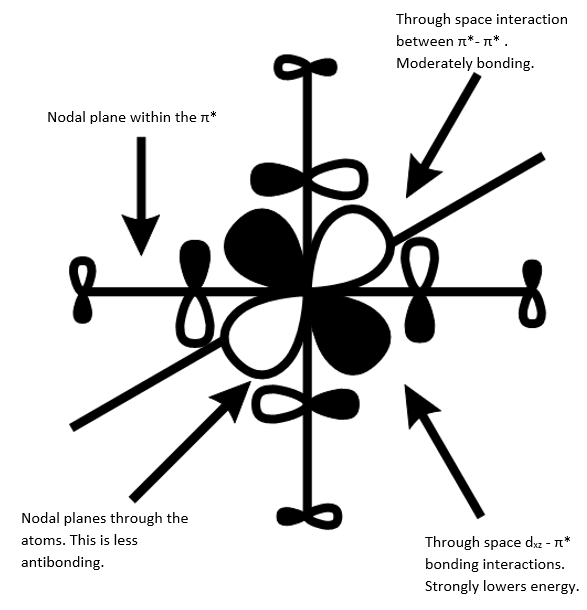
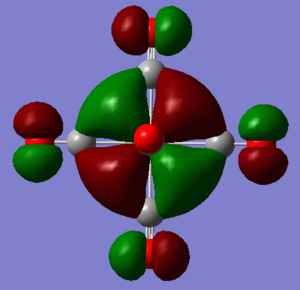
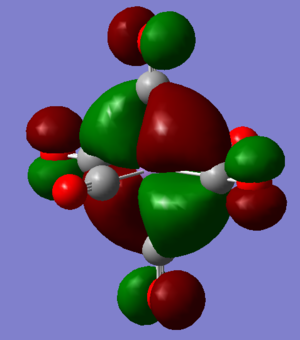
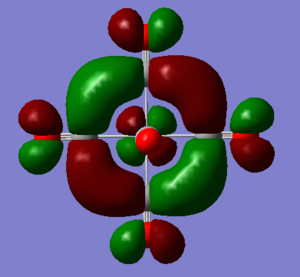
MO discussion of [Mn(CO)6]+
Ng611 (talk) 12:24, 7 June 2019 (BST) Interesting orbitals and good analysis, well done.
The trends
For the 3 transition metal complexes that have been optimised, they're each isoelectronic, they each have the same point group, and they have the same ligands. As you go along the row, the trend that would be expected is that the bonds between the metal and the carbon would decrease due to the increased effective nuclear charge on the transition metal. The trend is shown in the table below.
Ng611 (talk) 12:23, 7 June 2019 (BST) You need to provide some more rationale here. Why does the effective charge on the metal affect bonding?
| Species | M-C length / pm | CO length / pm |
| [V(CO)6]- | 195.4 | 116.6 |
| [Cr(CO)6] | 191.5 | 114.9 |
| [Mn(CO)6]+ | 190.8 | 113.6 |
As well as this, the increased bond length means that the strength of the bond is weaker. This would be seen in the decreased wavenumber of the vibrational modes that the complexes all experience. For all the complexes, they have 33 vibrational modes. Of these, only 12 are IR active. Of those 12, there is triple degeneracy across all of them resulting in 4 peaks.
| Species | C-O Stretch / cm-1 | M-C Stretch / cm-1 |
| [V(CO)6]- | 1968 | 457 |
| [Cr(CO)6] | 2086 | 429 |
| [Mn(CO)6]+ | 2198 | 389 |
While going across the row would cause the bond lengths to shorten thus leading to an increase in bond strength, the trends for the strengths of the bonds seen from IR is different. For the C-O bond stretch, there is an increase as you go along the row which is what we expect. However, for the M-C bond stretch, there is a decrease in bond strength. This is at odds with the shortening bond lengths calculated in the optimisations. This has been attributed to the inadequacy of the method used for the calculations.
Ng611 (talk) 12:23, 7 June 2019 (BST) Correct values and good trends, well done.
References
<references> [1]

