Wilee5534.2
Inorganic Module: Bonding (Ab intio and density functional molecular orbital)
Objectives
In the following project Gaussian Calculations will be used to investigate the structure and bonding of several relatively simple molecules including BH3 and TlBr3. The MOs, frequencies and dipole moments will be recorded. Furthermore, other more complex compounds will be looked at including cis/trans isomers of a Molybdenum complex and finally in a Mini-Project several optimisations and frequency calculations will be employed in order to investigate the bonding of a metal-halide complex.
Day 1 & 2
Creating and Optimising a Molecule of Borane [BH3]
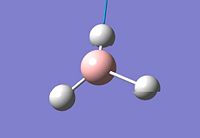
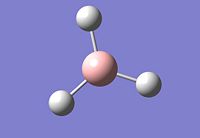
For this particular calculation, GaussView 5.0 was suitable as the molecule is small. The B-H bond lengths were manually set to 1.5Å. The optimisation was carried out using the method DFT [Density Function Theory] B3LYP and basis set 3-21G. After optimisation the B-H bond length is 1.19ű0.01 Å , the bond angle remains the same before and after optimisation at 120°±0.1° as expected from VSEPR along with the point group [D3h]. Using the summary file, information can be obtained about the calculation. In this case; the calculation type and method is FOPT and RB3LP with 3-21G basis set as previously mecuntntioned. Details of the final optimised molecule can be found e.g. the final energy -6.95x10⁴kJ/mol [-26.46a.u], dipole moment is 0.00 debye and the gradient is 0.00 a.u. The Total Energy curve and RMS [Root Mean Square] Gradient curve can be viewed after optimisation, the energy curve shows the program traversing the PES of BH3 and finding the minimum energy structure. The RMS (Root Mean Square or average) Gradient curve shows the gradient going to zero as minimum is approached.
 |
 |
 |
Molecular Orbitals of BH3
 |
 |
 |
 |
 |
 |
 |
 |
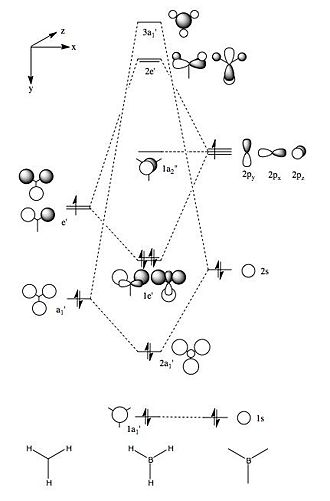
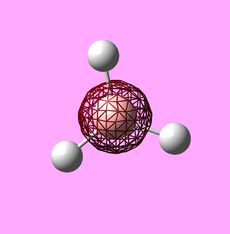
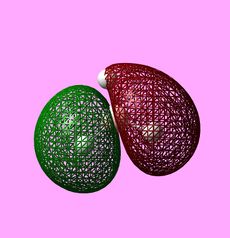
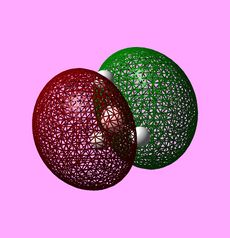
Using the .chk file from the BH3 optimisation a calculation could be run in order to compute the MOs. The method was set to "energy" with the additional key words "pop=full". The computed MOs were visualised using GaussView 5.0 and are shown above. Their corresponding LCAO representations can be seen in the MO Diagram for BH3, also shown above. At first, using MO Theory, the 3a1' orbital may be predicted to be at a lower energy, lower than 2e'. This is a good example of the limitations of MO Theory and shows why computational chemistry is necessary in order to get the relative energies of the orbitals.[1]
NBO Analysis of BH3
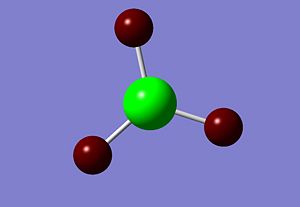
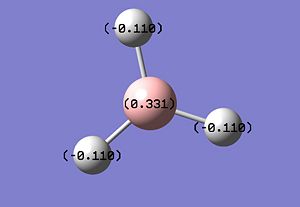
A Natural Bond Orbital [NBO] was carried out using the .log file generated from the population analysis of Borane. Using GaussView, a picture demonstrating the charge distribution throughout the molecule was generated. This could be done using colour or numerical values, e.g. red represents a highly negatively charged atom and green represents a highly positively charged atom. Given this, the results are as expected with the electron deficient B atom showing up green. The charge could also be depicted with numerical values Br: 0.331 and H: -0.11.
 |
 |
Frequency Analysis of BH3
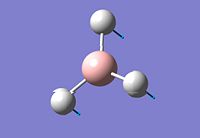
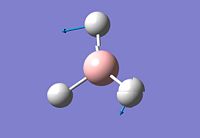
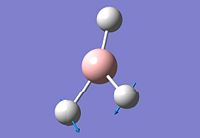
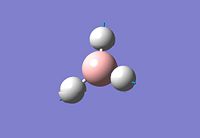
In order to confirm the struture was fully minimised, a frequency analysis was carried out using the output .log from the optimisation calculation, using method [frequency calculation, DFT-B3LYP], basis set 3-21G and additional keywords "pop=(full,nbo)". The vibrations of BH3 were generated and visualized using GaussView, the following table shows the 6 computed vibrations, intensities and symmetry groups.
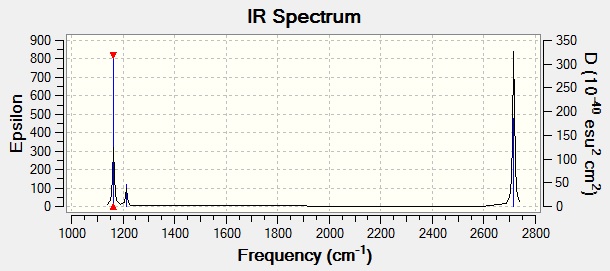
Shown above, is the complete IR Spectrum of BH3. Although there are 6 computed frequencies the spectrum only shows 3 peaks. This can be explained by looking at the symmetry of the vibrations e.g. vibration 4 is symmetric therefore vibrational movements cancel eachother and leaves the vibration IR inactive. Among the remaining peaks there are two pairs of degenerate vibrations [2 & 3/5 & 6]. The degenerate vibrations have the same frequencies leading to 2 peaks from 4 vibrations, including the previously mentioned peak this gives a total of 3 peaks.
In the literature, the experimental values for the IR frequencies of BH3 are 1125, 1640 and 2808cm-1[2] which do not correlate all that well with the computed values. However a low-level basis set has been used so accuracy is compromised.
Optimising a Molecule of TlBr3
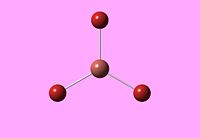
As was done for BH3, a molecule of TlBr3 was optimised. Again, the molecule is sufficiently small so GaussView was suitable for carrying out the optimisation calculation. The optimisation was carried out using the method DFT [Density Function Theory] B3LYP as before. However as opposed to the basis set 3-21G which was used for BH3, pseudo potentials and a larger basis set LANL2DZ were used for this molecule. Although much the same method as before, the symmetry will be restrained to D3h. The final output file was visualised in GaussView and using the summary file, various pieces of information regarding the optimised molecule could be recorded. The calculation type is FOPT, method = RB3LYP and basis set = LANL2DZ. The final energy is -2.42x10⁵kJ/mol [-91.22 a.u.] and the dipole moment is 0.00 debye, the gradient is 9x10⁻⁷ confirming the molecule has been optimised.The optimised [Tl-Br] bond length is 2.65Â [lit.2.51Â] and the optimised bond angle [Br-Tl-Br] is 120 degrees which is what is predicted by VSEPR.
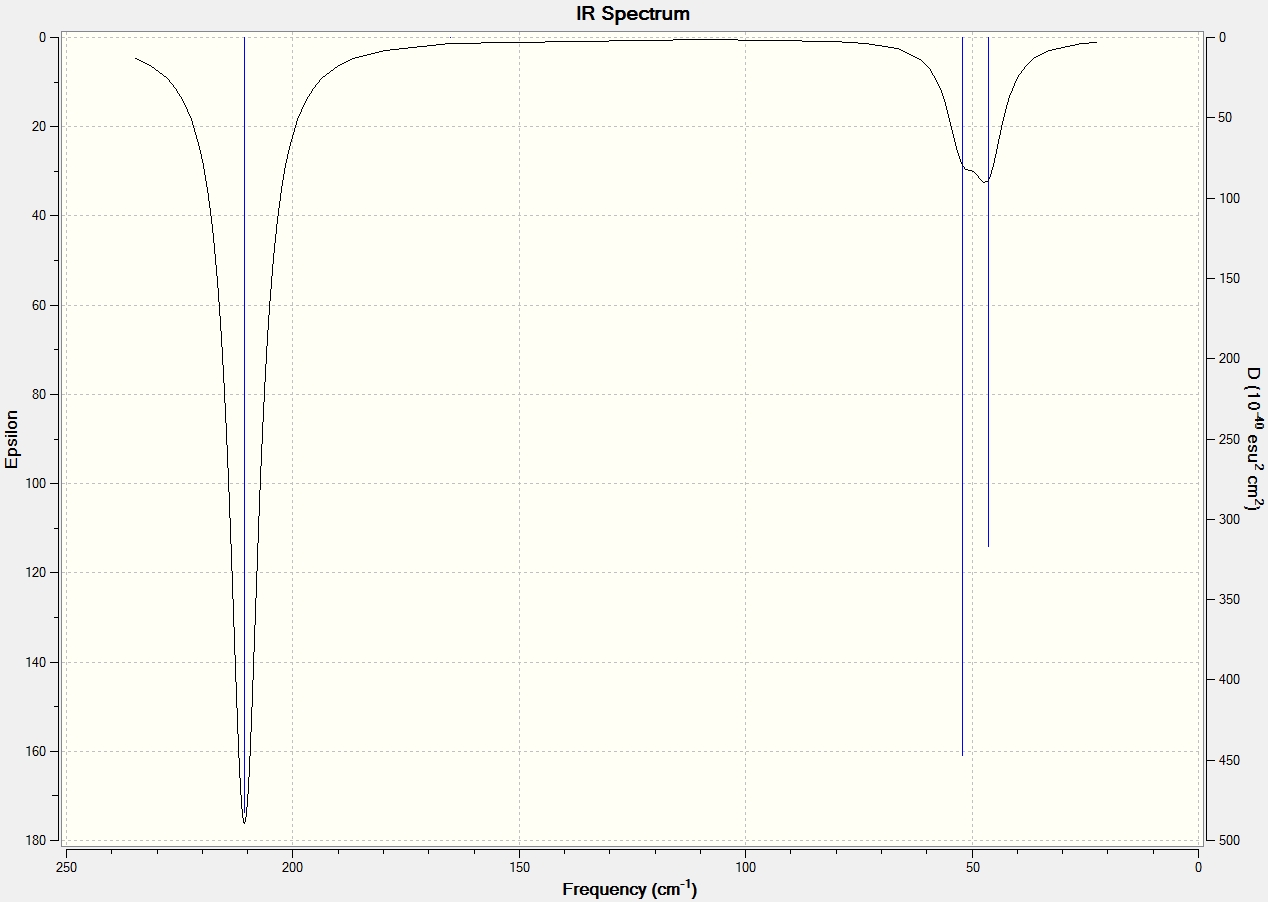
A frequency calculation was run for the optimised molecule using the same basis set LANL2DZ, the resulting frequencies are shown in the table below, they are all positive confirming a minima was reached. In this case, LANL2DZ, a medium level basis set was used in order to achieve a compromise between calculation time and accuracy of results. The same basis set and method must be used for both the optimisation and the frequency calculations in order to achieve comparable and useful results. Each method uses different approximations to generate the results so inorder to compare calculation results the same method/basis set must be used. The table below shows the "real" normal modes. The low frequencies, which correspond to the vibrations of the centre of mass of the molecule are -0.0008 -0.0004 -0.0003 0.6824 3.5014 3.5014. These low frequencies confirm that the calculation has provided accurate results as they are all at least 1 order of magnitude smaller than the lowest "real" normal modes.
| Number | Image | Frequency / cm-1 | Intensity | |
|---|---|---|---|---|
| 1 | 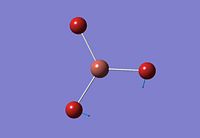 |
49.9 | 3.5 | |
| 2 |  |
49.9 | 3.5 | |
| 3 | 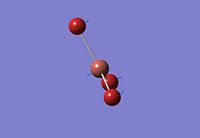 |
57.5 | 5.8 | |
| 4 | 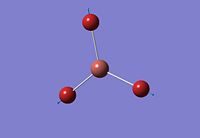 |
150.77 | 0.0 | |
| 5 | 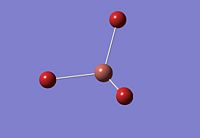 |
195.0 | 23.7 | |
| 6 |  |
195.0 | 23.7 |
|
Further Questions
In some cases after a calculation has been run by Gaussian, the resulting .log file will appear in Gaussview with a number of bonds missing. Although these bonds may be missing, it does not mean that they don't exist. GaussView recognises bonds up to a certain length. GaussView works mostly with organic molecules, however, inorganic molecules tend to contain longer bonds which are out of the range that the program possesses. This explains why various bonds will not show up throughout these exercises.
A bond can be described as an attractive interaction between 2 ions, atoms or molecules. More specifically; an area of electron density which "binds" two positive nuclei i.e. an MO formed from the corresponding AOs.
Day 2 & 3: cis and trans isomerism
Optimisation of Isomers
In this exercise a transistion metal complex Mo(CO)4(PCl)2 will be investigated. The two cis and trans isomers will be examined. The number of active vibrational CO bands present will differ due to their varying geometries. It is already known that 4 bands are expected from the cis isomer while only 1 band is expected from the trans isomer.
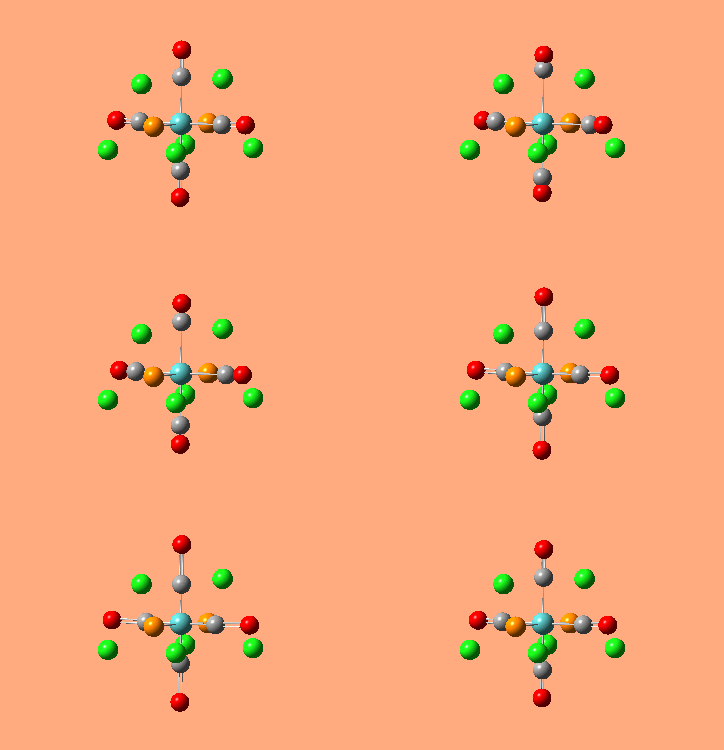
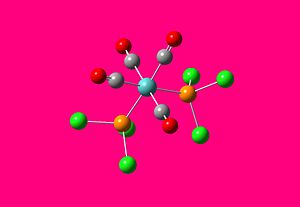
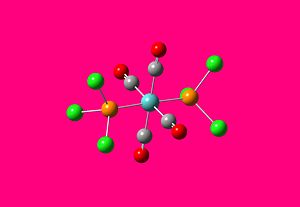
The molecules were firstly optimised roughly [calc = B3LYP/LANL2MB]. To save time, a specific starting point was used in order to find the minima. For the cis isomer; 1 Cl atom points up parallel to the axial bond while another Cl points down. For the trans isomer the PCl groups are eclipsed and 1 Cl atom of each group lies parallel to 1 Mo-C bond. The molecules were then optimised for a second time and the results of this optimisation are shown below. Optimisation Files deposited in D space: cis-optimisation trans-optimisation
Looking at the relative energies of the two isomers; it can be seen that the cis isomer is the more stable which agrees with results listed in literature.[3] in a new unit cell The cis isomer has an energy of -1637201.7271201kJ/mol [-623.57707195a.u] and the trans isomer has an energy of -1637198.9944208kJ/mol [-623.57603112a.u] The energy difference [2.73kJ/mol] between the two isomers is small however looking solely at sterics this may not be the expected result, given that PCl3 is a relatively bulky ligand it would be expected that the 2PCl3 should want to be as far apart as possible i.e. in the trans conformer. However this result is due to the delicate balance of sterics vs. electronics, with the cis effect stabilising the molecule. Although the ligands are relatively large they are not quite large enough and as such electronic stabilization outwieghs steric stabilization. If the experiment were carried out with PPh3 it is likely that a greater energy difference would be found given that this ligand is much larger than the PCl3 used in this calculation. If larger ligands are used, the results are more likely to favour the trans conformer whereas using smaller ligands will increase the stabilization felt by the cis effect.
 |
 |
Frequency Analysis
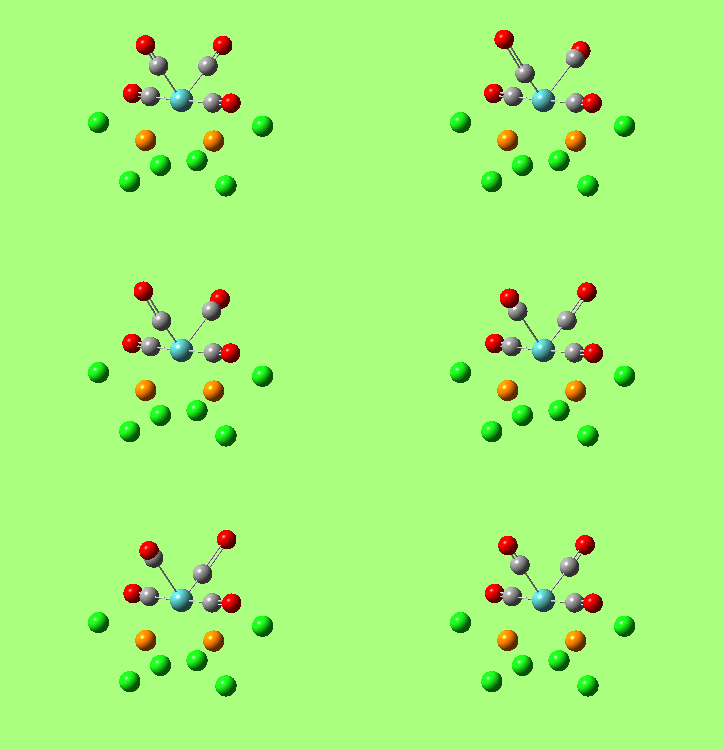
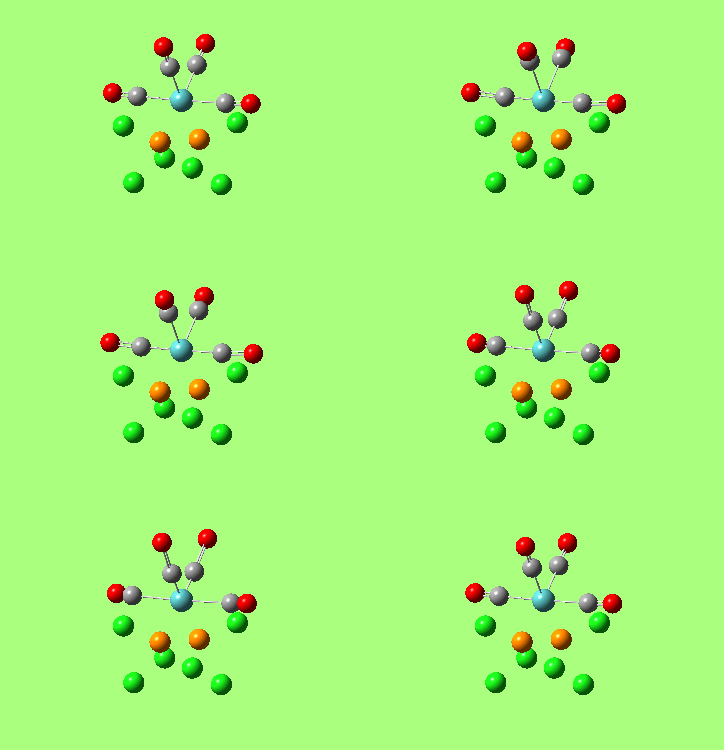
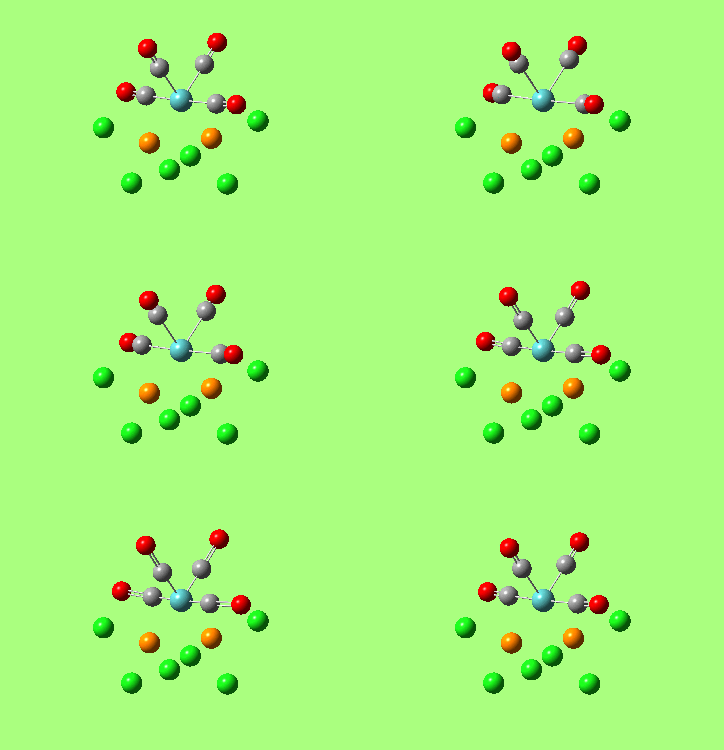
In order to ensure the molecules were optimised, it was necessary to carry out a frequency analysis. All the resulting frequencies were positive and as such confirm the molecules did infact reach minima. Frequency Calculation Files deposited in D space: cis-frequency trans-frequency
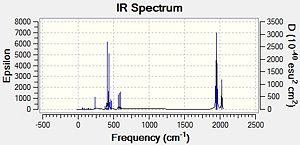 |
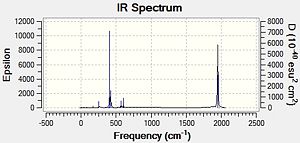 |
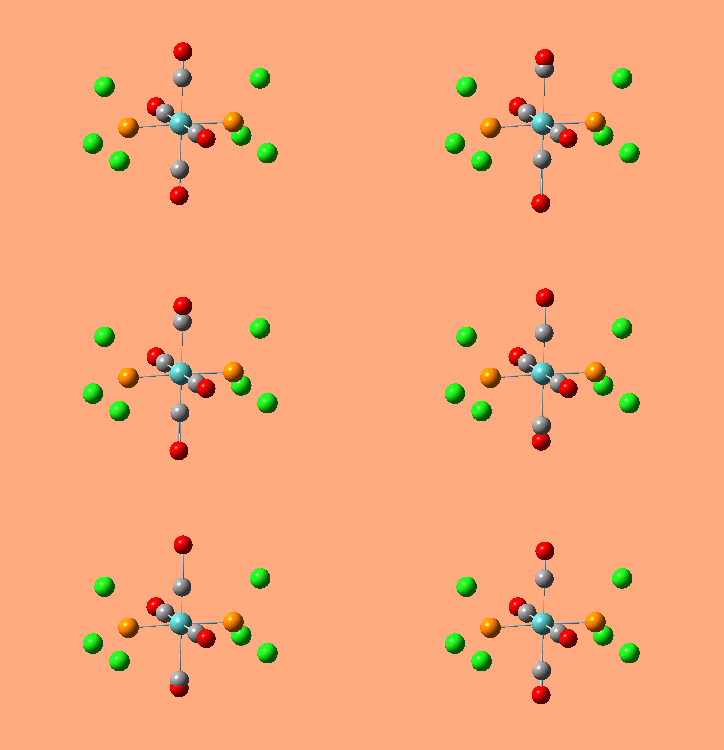
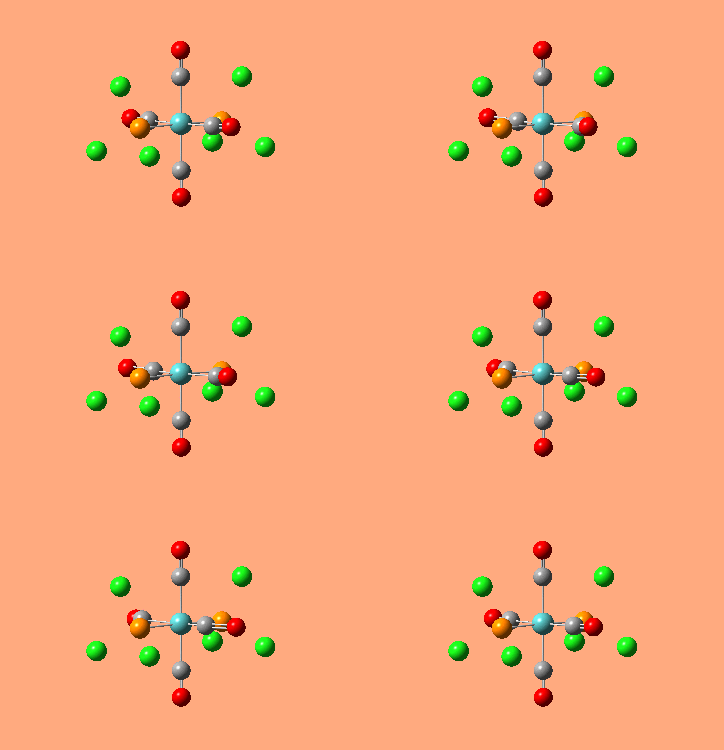
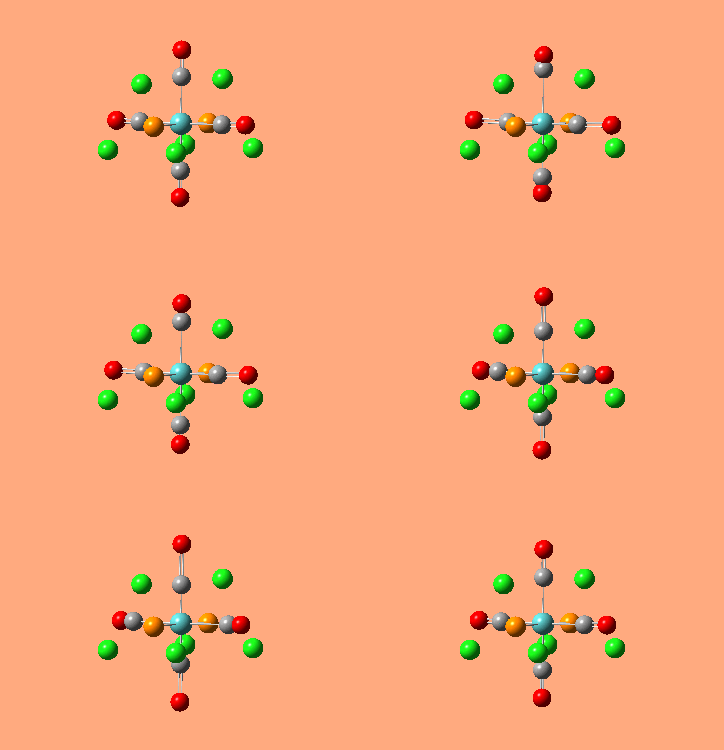
For the cis isomer one frequency is particularly low and for the trans isomer, there are 2 low frequencies [shown below].
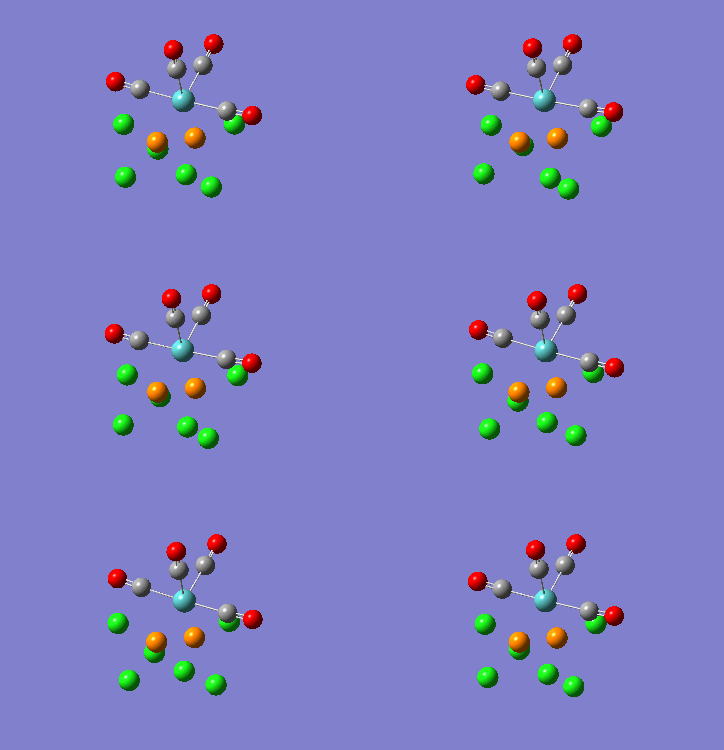 |
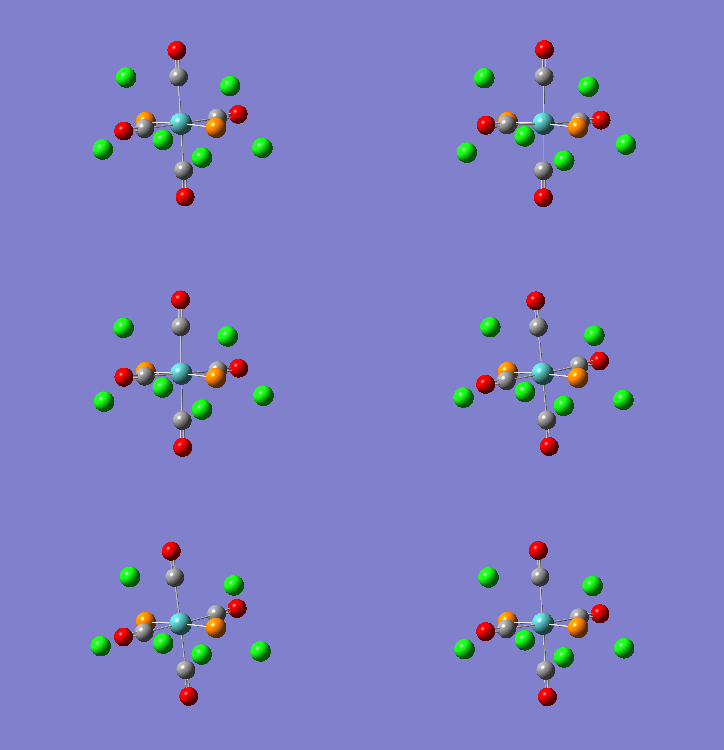 |
|
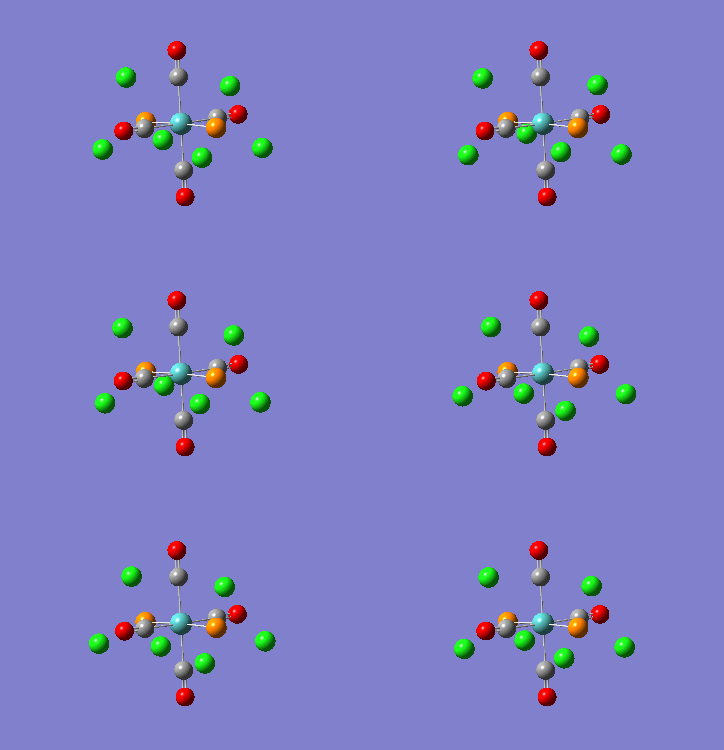
These low frequencies can be attributed to vibrations along the Mo-P bond and at room temperature are probably due to thermal energy. With an increase in temperature it is probable that these frequencies would then increase.
As already mentioned in the beginning of this exercise due to the geometries of the isomers, 4 bands are expected from the cis isomer while only 1 band is expected from the trans isomer. The results obtained show 4 stretching frequencies recorded for each isomer, however as expected in the IR Spectra we see a different case. This is due to the centre of inversion present in the trans complex which "cancels out" some of the stretches rendering them IR inactive. The stretching frequencies found in literature for the complexes are 2019, 1922,1905,1899cm-1 for cis isomer and 1895cm-1 for the trans isomer.[4] These values are in relatively good agreement with the computed values found in this investigation, taking into account that the computed values are for L = PCl3 while those stated in literature are for L = PPh3.
Mini Project: Exploration of Bonding in Main Group Halides
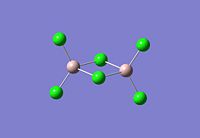
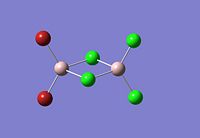
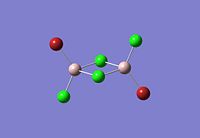
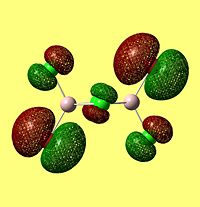
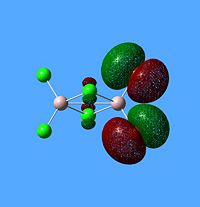
AlCl3 is electron deficient and in order to relieve this electron deficiency it dimerises to Al2Cl6 just like B2H6. In the following exercise the effect of replacing 2 of the Cl atoms with 2 Br atoms will be investigated. The positioning of the Br atoms will also be analysed i.e. how does the stability of the dimer vary when the Br atoms are in the bridging positions vs. 2 Br atoms at one terminal vs. 2 Br atoms at opposite terminals. Spectroscopic studies of aluminium halide intermediates are difficult due to their further reactivity, computational chemistry provides a way of gaining a picture of such intermediates. In the following exercise dimers will be optimized and further, a frequency analysis and Natural Bond Orbital Analysis will be carried out in order to produce a picture of the orbitals of such molecules and the effect of Br on the vibrational frequencies.
Optimization of Dimers
 |
 |
 |
 |
The dimer of highest energy is Al2Cl6 at -8.52x10⁶kJ/mol [-3246.32a.u]. This optimisation was carried out using calculation method B3LYP and the 6-31g basis set. The bond length for the Al-Cl[terminal] is equal to 2.17Å which is in relatively good agreement with the value found in literature [2.08Å]. The Al-Cl[bridging] bond length is also consistent with literature, found to be 2.4Å [lit.2.3Å][5] The Al-Cl-Al bond angle was found to be 93 degrees, slightly higher than the 90.9 recorded in literature.
The Al2Cl4Br2 dimers with terminal Bromines [opposite & same terminal] had the same energy at -1.95x10⁷kJ/mol [-7438.23a.u.] and are clearly a lot more stable than the AL2Cl6 dimer at a much lower energy. From these results; it would indicate that the addition of 2 Br atoms stabilises the dimer. This may be due to the lessened electronegativity of Br, therefore allowing greater relief of electron deficiency in Al. The dimer with the 2 Br in the bridging positions is as would be expected from the previous explanation again slightly lower than the previous 3 dimers at -1.96x10⁷kJ/mol [-7469.13a.u.].
Frequency Analysis of Dimers
 |
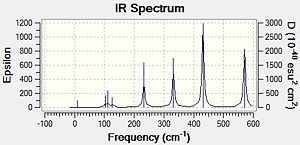 |
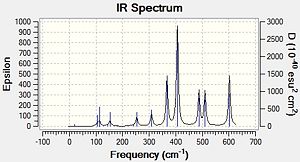 |
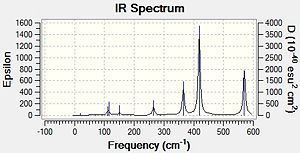 |
In the Al2Cl6 dimer, large peaks can be seen at 360.3, 449.2, 597.5cm-1 which are relatively consistent with literature which lists characteristic stretches [in the gas phase] at 420, 484, and 625 cm-1.[6]The frequencies correspond to the stretches shown below.
 |
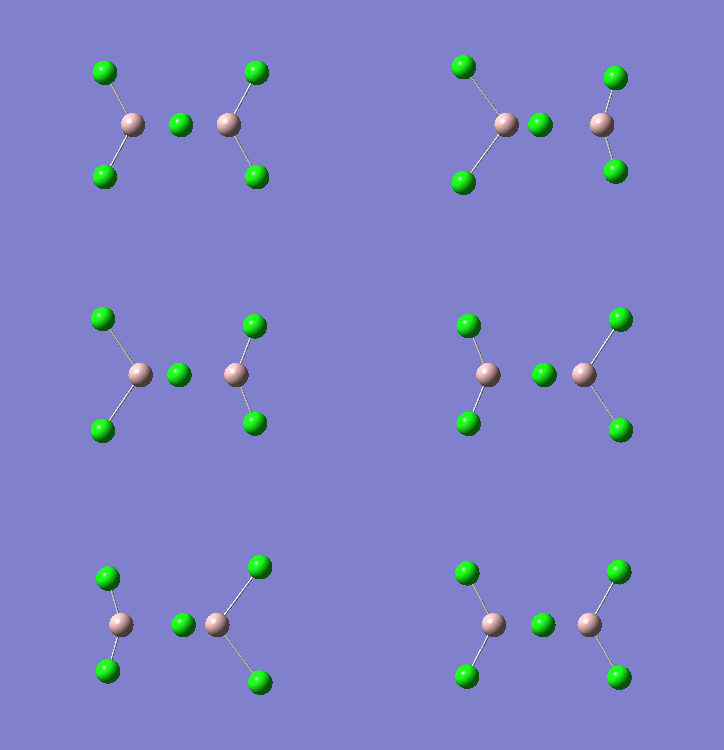 |
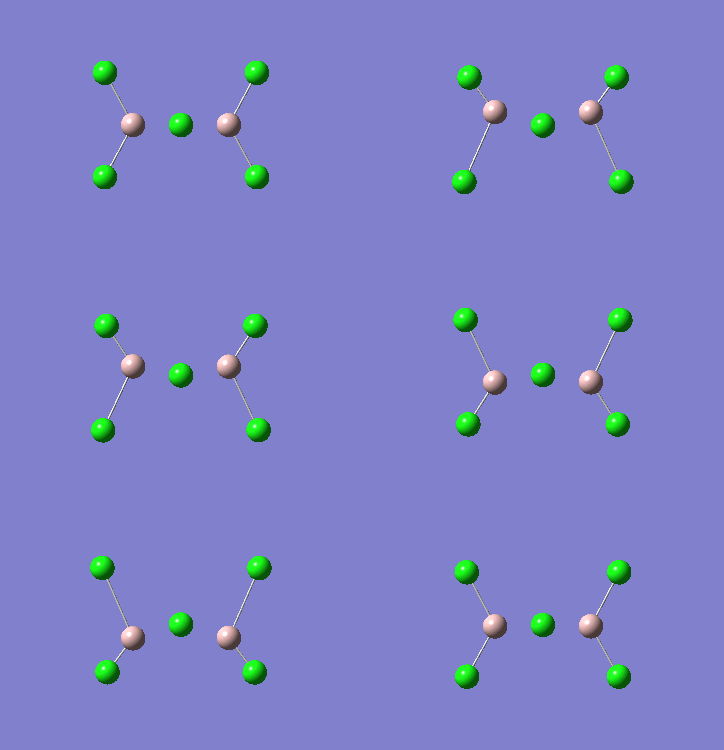 |
In the Al2Cl4Br2 dimer with the 2 Br in the bridging positions, the 3 frequencies are still present but slightly lower. This may be attributed to the more diffuse orbitals of Br leading to a weaker interaction [Al-Br-Al] in the bridging position. The frequencies recorded for this dimer are 332.0, 431.3 and 571.0cm-1. For the dimer with 2 Br at opposite terminals we see relatively similar results; 365, 418 and 570 cm-1. However for the dimer with 2 Br at the same terminal we see the following frequencies;367, 406, 487, 510 and 601cm-1. With this dimer there are an additional 2 stretches of high intensity which result from the fact that the molecule is no longer symmetric.
NBO Analysis of Dimers
 |
 |
 |
 |
 |
 |
 |
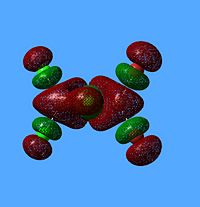 |
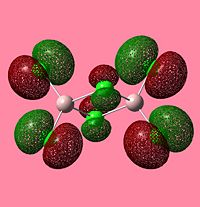
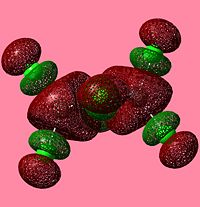
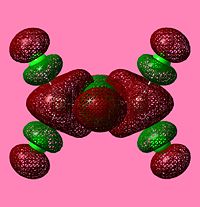
As would be expected the Br MOs are more diffuse, this is explained by the fact that Br is further down Group 7, as such a larger atom with more diffuse orbitals.
References
- ↑ Taken from Dr. Hunt's Lecture Course; "Molecular Orbitals in Inorganic Chemistry", 2009-10.
- ↑ www.hbcpnetbase.com//articles/09_07_90.pdf
- ↑ Bennett et al; The crystal and molecular structure of trans-tetracarbonylbis(triphenyl-phosphine)chromium(0), Journal of Chemical Crystallography, Vol. 34, No. 6, June 2004.
- ↑ F. Cotton, Inorg. Chem. 1982, 21, 2661-2666
- ↑ Chey et al; π-Complexes of Alkenes to Trivalent Aluminium, Organometallics, 1990, 9, 2430-2436.
- ↑ P. Hassanzadeh, A. Citra, L. Andrews;Laser-Evaporated Aluminum Atom Reactions with Halogen Molecules, J. Phys. Chem. 1996, 100, 7317-7325

