Vm371798
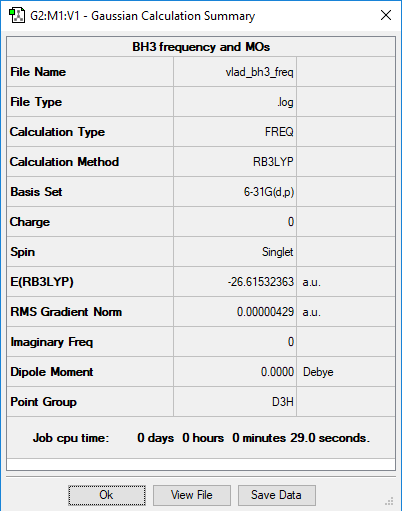
BH3
B3LYP/6-31G(d,p)
         Item               Value     Threshold  Converged?
 Maximum Force            0.000009     0.000450     YES
 RMS     Force            0.000004     0.000300     YES
 Maximum Displacement     0.000034     0.001800     YES
 RMS     Displacement     0.000017     0.001200     YES
Frequency File: VLAD_BH3_FREQ.log
Low frequencies ---   -2.2126   -1.0751   -0.0054    2.2359   10.2633   10.3194
 Low frequencies --- 1162.9860 1213.1757 1213.1784
The spectrum shows only 3 peaks, because two pairs of vibrations are degenerate and one vibration is not IR active since there is no net change in dipole moment.
You have the correct reasons for why only three peaks are visible, however, you could have been clearer about which peaks you are referring too. To improve, you should have also produced your own table with the vibrational information, including symmetries and the vibrational type. Smf115 (talk) 23:08, 31 May 2019 (BST)
Optimised BH3 Molecule |
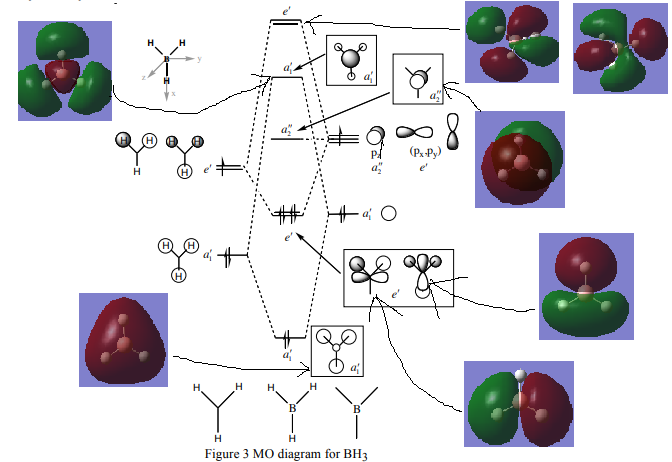
(Diagram taken from Lecture 4 Tutorial Problem Model Answers, page 3, http://www.huntresearchgroup.org.uk/teaching/teaching_comp_lab_year2a/Tut_MO_diagram_BH3.pdf)
Are there any significant differences between the real and LCAO MOs?
At lower energies the real MOs look exactly like predicted by the LCAO MOs; however, at higher energies, the superposition of out of phase LCAOs might be quite complicated, but when it is done they still look similar.
What does this say about the accuracy and usefulness of qualitative MO theory?
This shows that the qualitative MO theory is useful and accurate.
Good inclusion of the calculated MOs on to the MO diagram, the corresponding LCAOs for the top e' MOs are missing though for comparison. Your evaluation of the usefulness of the LCAO approach is ok but it is very brief and general, and you haven't really discussed the differences. For example, you could have considered the contributions in the 3a1' or 2e' MOs to illustrate your points further. Smf115 (talk) 23:08, 31 May 2019 (BST)
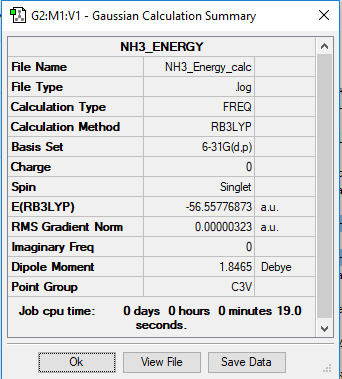
NH3 Energy Calculation
B3LYP/6-31G(d,p)
         Item               Value     Threshold  Converged?
 Maximum Force            0.000006     0.000450     YES
 RMS     Force            0.000004     0.000300     YES
 Maximum Displacement     0.000014     0.001800     YES
 RMS     Displacement     0.000009     0.001200     YES
 Low frequencies ---   -0.0128   -0.0017    0.0013    7.1034    8.1048    8.1051
 Low frequencies --- 1089.3834 1693.9368 1693.9368
Frequency File: NH3 ENERGY CALC.LOG
Optimised NH3 Molecule |
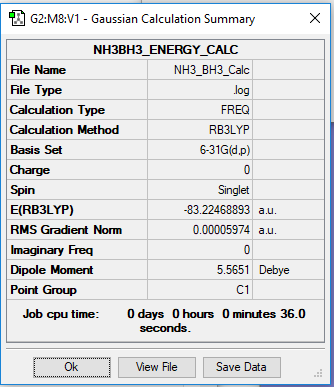
NH3BH3 Energy Calculation
B3LYP/6-31G(d,p)
         Item               Value     Threshold  Converged?
 Maximum Force            0.000123     0.000450     YES
 RMS     Force            0.000058     0.000300     YES
 Maximum Displacement     0.000585     0.001800     YES
 RMS     Displacement     0.000320     0.001200     YES
 Low frequencies ---   -0.0006    0.0011    0.0012   16.8436   17.4462   37.3291
 Low frequencies ---  265.8243  632.2043  639.3227
Frequency File: NH3 BH3 CALC.LOG
Optimised NH3BH3 Molecule |
Association Energy Calculation
E(NH3)= -56.55776873 a.u. E(BH3)= -26.61532363 a.u. E(NH3BH3)= -83.22468893 a.u.
ΔE=E(NH3BH3)-[E(NH3)+E(BH3)] = -0.05159657 a.u. = -135kJ/mol
Based on your energy calculation is the B-N dative bond weak, medium or strong? What comparison have you made to come to this conclusion?
B-H average bond energy literature value is 389kJ/mol (Reference Data Series," National Bureau of Standards, No. 31, Washington, DC, 1970; S.W. Benson, J. Chem. Educ., 42, 502 (1965).)
N-H average bond energy value is 391 kJ/mol (Referenced from Chemistry by Zumdahl (5th ed.) Table 8.4 on page 373)
Compared to the N-H and B-H bond energies the dative B-N bond appears to be relatively weak.
Correct calculation, good consideration of the accuracy of the final reported energy and good, referenced comparisons! Smf115 (talk) 23:10, 31 May 2019 (BST)
NI3 Molecule Optimisation
B3LYP/6-31G(d,p)LANL2DZ
        Item               Value     Threshold  Converged?
 Maximum Force            0.000088     0.000450     YES
 RMS     Force            0.000044     0.000300     YES
 Maximum Displacement     0.000858     0.001800     YES
 RMS     Displacement     0.000481     0.001200     YES
 Low frequencies ---  -12.3847  -12.3783   -5.6131   -0.0040    0.0194    0.0711
 Low frequencies ---  100.9307  100.9314  147.2333
Frequency File: VM NI3 FREQUENCY.LOG
Optimised NI3 Molecule |
N-I bond distance: 2.18424 Å
Day 2 Project: Ionic Liquids
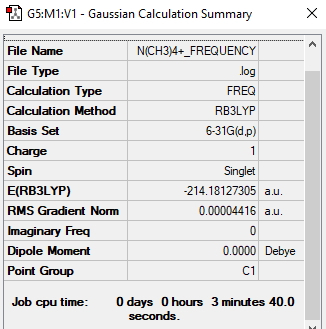
[N(CH3)4]+
B3LYP/3-21G level
         Item               Value     Threshold  Converged?
 Maximum Force            0.000104     0.000450     YES
 RMS     Force            0.000044     0.000300     YES
 Maximum Displacement     0.001280     0.001800     YES
 RMS     Displacement     0.000471     0.001200     YES
Low frequencies ---   -5.1443    0.0001    0.0002    0.0008    8.6939   10.0026
 Low frequencies ---  185.0713  289.7367  290.3827
Frequency File: N(CH3)4+ FREQUENCY.LOG
Optimised N(CH3)4+ |
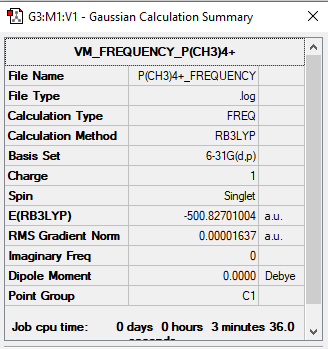
P(CH3)4+
B3LYP/3-21G level
         Item               Value     Threshold  Converged?
 Maximum Force            0.000035     0.000450     YES
 RMS     Force            0.000016     0.000300     YES
 Maximum Displacement     0.001592     0.001800     YES
 RMS     Displacement     0.000629     0.001200     YES
Low frequencies ---   -8.7146   -0.0025   -0.0020   -0.0001    5.1179    7.2785
 Low frequencies ---  157.0823  192.6438  193.0924
Frequency File: P(CH3)4+ FREQUENCY.LOG
Optimised P(CH3)4+ |
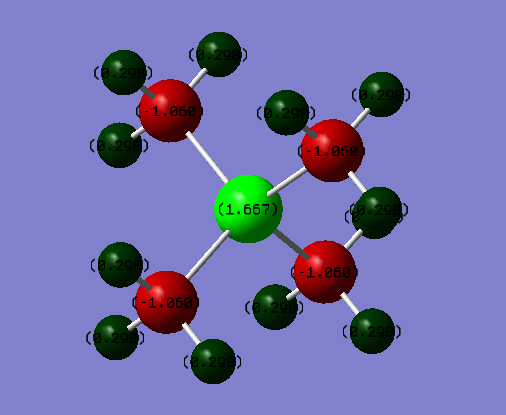
Charge Distributions:
N(CH3)4+:
N: -0.30 C: -0.48 H: +0.27
P(CH3)4+:
P: +1.7 C:-1.1 H:+0.30
The two structures are symetrically similar, thus we can compare them based on the charge distribution differences. For example, we can see that the phosphorus atom is more electropositive than the nitrogen atom, thus it carries a higher positive charge. Due to the same reason (phosphorus is more electropositive than nitrogen), the carbon in the phosphorus molecule carries a higher negative charge. Even though the nitrogen is a more electronegative atom than carbon, it carries a higher charge, because initially an electron was removed from it in order for this ion to form.
Correct NBO charges, although you should have used the same colour range to highlight the distributions in both ILs. Your electronegativity comparison is right but is very brief and a more detailed comparison could have been given, e.g. including mentioning the charges on the H atoms. You mention the symmetry which is good, but what implication does this have for the charges within the molecules? Smf115 (talk) 16:19, 2 June 2019 (BST)
Questions
What does the "formal" positive charge on the N represent in the traditional picture?
In the traditional picture, formal charge is the charge on the N atom assuming that all atoms share electron density equally, thus disregarding the effects of electronegativity. In reality, the electronegativity is important for the real picture consideration and the charge on the Nitrogen atom is not +1.
On what atoms is the positive charge actually located for this cation?
As a result of the molecule optimisation, we can see that the positive charge is located on the hydrogen atoms.
Nice point that electronegativity is not considered in the traditional picture but this doesn't explain where the +1 charge arises from. To improve, consider formal electron counting and the Lewis structure. Smf115 (talk) 16:21, 2 June 2019 (BST)
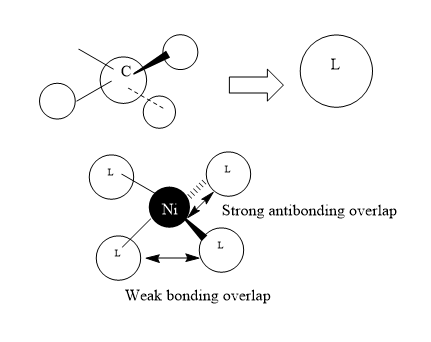
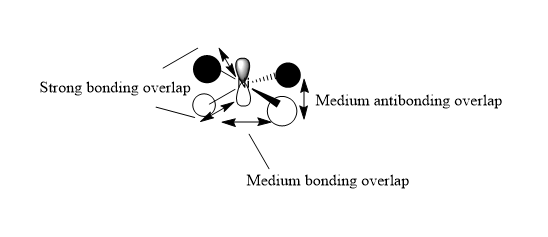
Simplified MO Representation of N(CH3)4+
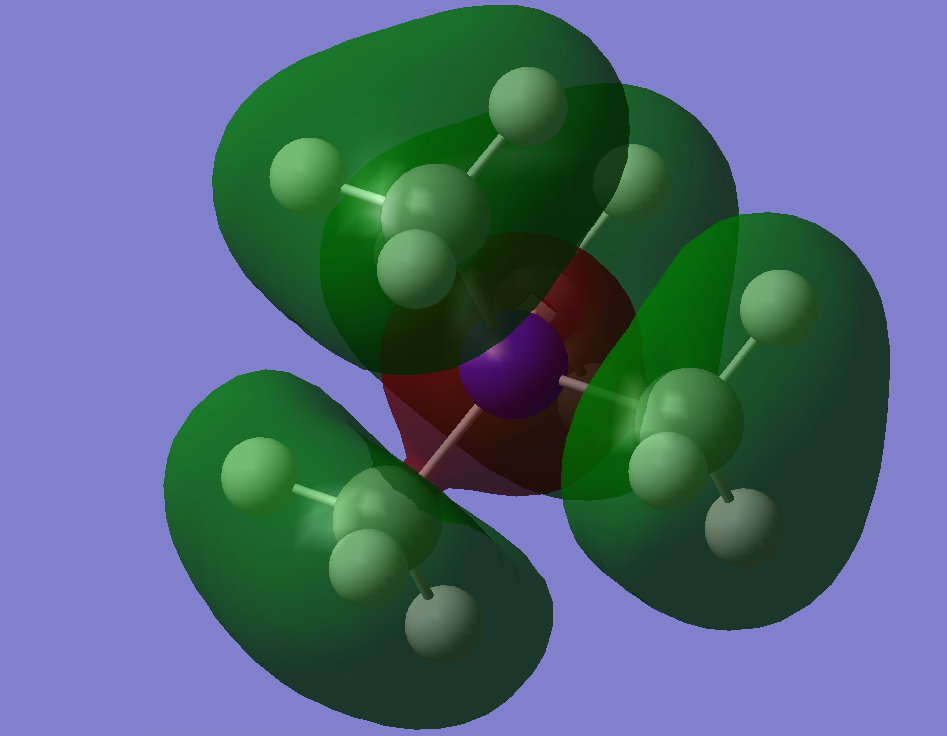
MO 10:
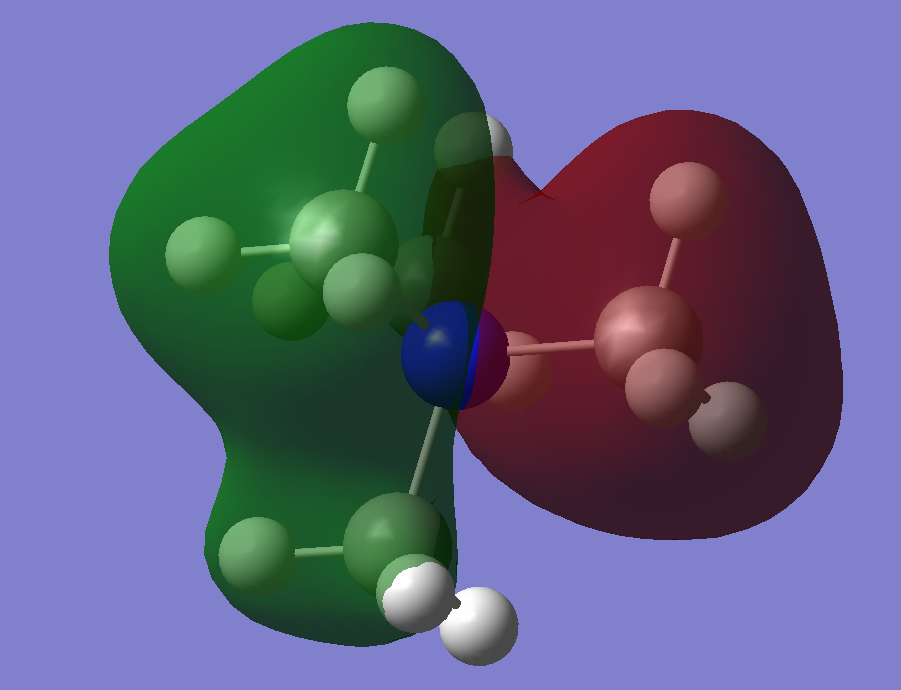
MO 8:
MO 6:
A decent attempt at constructing the FOs and LCAOs. To improve, it would have been good to see a range of MOs selected in terms of complexity, you have also not formed the FO for each one or made any note that it uses the initial construction. You have identified some of the interactions, to improve, try to use more technical words to describe them (i.e. are they through bond or through space?) Smf115 (talk) 16:27, 2 June 2019 (BST)
Overall, an ok report which lacks in the analysis parts of the project section. Smf115 (talk) 16:27, 2 June 2019 (BST)

