Vg3217 inorg2ndyear
Part I
BH3 optimisation
Method: B3YLP
Basis set: 6-31G (d,p)

         Item               Value     Threshold  Converged?
 Maximum Force            0.000011     0.000450     YES
 RMS     Force            0.000007     0.000300     YES
 Maximum Displacement     0.000043     0.001800     YES
 RMS     Displacement     0.000028     0.001200     YES
 Predicted change in Energy=-6.942915D-10
 Optimization completed.
    -- Stationary point found.
Frequency calculation log file
Low frequencies ---  -14.6858  -14.6818  -11.0436    0.0010    0.0165    0.3415
Low frequencies --- 1162.9492 1213.1220 1213.1222
Optimised BH3 molecule |
| wavenumber (cm-1) | Intensity (arbitrary units) | symmetry | IR active | type |
| 2716 | 126 | E' | yes | asymmetric stretch |
| 2716 | 126 | E' | yes | asymmetric stretch |
| 2583 | 0 | A1' | no | symmetric stretch |
| 1213 | 14 | E' | yes - weak | angle deformation |
| 1213 | 14 | E' | yes - weak | angle deformation |
| 1163 | 93 | E' | yes | umbrella |
Ng611 (talk) 17:19, 30 May 2019 (BST) Try to use the correct terminology when describing the modes in your molecule (i.e.: in-plane/out-of-plane bends instead of 'angle deformation' or 'umbrella'. Otherwise, good IR analysis.
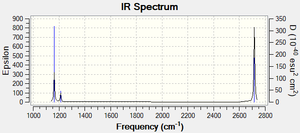
The symmetrical stretch does not lead to a change in dipole moment and so is not visibile in IR. The asymmetrical stretches and angle deformations are each degenerate, resulting in one peak for each mode.
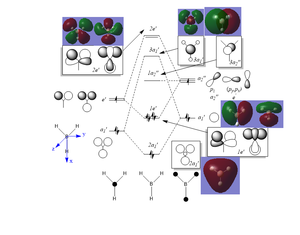
The MOs obtained through LCAOs closely match the ones predicted by Gaussian. Therefore, MO theory can reliably provide useful information on relative energy levels and bonding character.
Ng611 (talk) 17:22, 30 May 2019 (BST) Are there any significant differences?
NH3 optimisation
Method: B3YLP
Basis set: 6-31G (d,p)

         Item               Value     Threshold  Converged?
 Maximum Force            0.000006     0.000450     YES
 RMS     Force            0.000004     0.000300     YES
 Maximum Displacement     0.000012     0.001800     YES
 RMS     Displacement     0.000008     0.001200     YES
 Predicted change in Energy=-9.843795D-11
 Optimization completed.
    -- Stationary point found.
Frequency calculation log file
 Low frequencies ---   -0.0140   -0.0032   -0.0015    7.0783    8.0932    8.0937
 Low frequencies --- 1089.3840 1693.9368 1693.9368
Optimised NH3 molecule |
H3NBH3 optimisation and N-B bond energy
Method: B3YLP
Basis set: 6-31G (d,p)
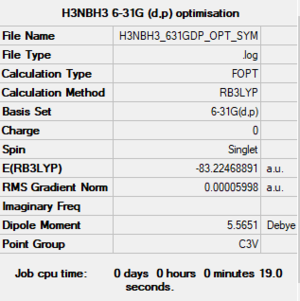
         Item               Value     Threshold  Converged?
 Maximum Force            0.000122     0.000450     YES
 RMS     Force            0.000058     0.000300     YES
 Maximum Displacement     0.000531     0.001800     YES
 RMS     Displacement     0.000296     0.001200     YES
 Predicted change in Energy=-1.655945D-07
 Optimization completed.
    -- Stationary point found.
Frequency calculation log file
 Low frequencies ---   -0.0251   -0.0030    0.0011   17.1236   17.1258   37.1326
 Low frequencies ---  265.7816  632.2034  639.3483
Optimised NH3 molecule |
1 Eh= 2625.50 kJ mol -1
5 kJ mol -1 = 0.002 Eh
E(NH3) = -26.615 Eh
E(BH3) = -56.558 Eh
E(H3NBH3) = -83.225 Eh
E = E(H3NBH3) - [ E(NH3) + E(BH3) ] = -0.052 Eh = -140 kJ/mol
The dative N-B bond has less than half the energy of the covalent N-B bond (389 kJ/mol), making it very weak in comparison.
Ng611 (talk) 17:24, 30 May 2019 (BST) You rounded too early. You should use the full precision values and round at the end. Remember that your values are accurate to about 5 d.p., NOT 5 s.f.. Also, you need to cite where you obtained your bond enthalpy value from.
NI3 optimisation
Method: B3YLP
Basis sets:
- N: 6-31G (d,p)
- I: LanL2DZ

         Item               Value     Threshold  Converged?
 Maximum Force            0.000065     0.000450     YES
 RMS     Force            0.000038     0.000300     YES
 Maximum Displacement     0.000952     0.001800     YES
 RMS     Displacement     0.000415     0.001200     YES
 Predicted change in Energy=-5.172366D-08
 Optimization completed.
    -- Stationary point found.
Frequency calculation log file
 Low frequencies ---   -0.1614   -0.0983   -0.0031    0.5823    0.7024    1.5522
 Low frequencies ---  101.3248  101.3255  148.3662
Optimised NI3 molecule |
Optimised N-I bond length: 2.184 A
Ng611 (talk) 17:25, 30 May 2019 (BST) Good!
Part II
[Cr(CO)6]
Method: B3YLP
Basis sets:
- C, O: 6-31G (d,p)
- Cr: LanL2DZ
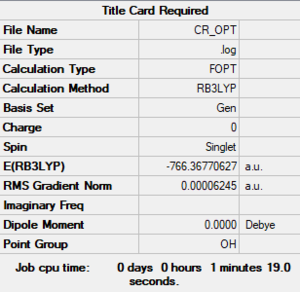
         Item               Value     Threshold  Converged?
 Maximum Force            0.000155     0.000450     YES
 RMS     Force            0.000063     0.000300     YES
 Maximum Displacement     0.000705     0.001800     YES
 RMS     Displacement     0.000378     0.001200     YES
 Predicted change in Energy=-2.394140D-07
 Optimization completed.
    -- Stationary point found.
Frequency calculation log file
 Low frequencies ---   -0.0011   -0.0010   -0.0009   11.7423   11.7423   11.7423
 Low frequencies ---   66.6546   66.6546   66.6546
[Cr(CO)6] |
[Mn(CO)6]+
Method: B3YLP
Basis sets:
- C, O: 6-31G (d,p)
- Mn: LanL2DZ
Method: B3YLP

         Item               Value     Threshold  Converged?
 Maximum Force            0.000045     0.000450     YES
 RMS     Force            0.000018     0.000300     YES
 Maximum Displacement     0.000344     0.001800     YES
 RMS     Displacement     0.000163     0.001200     YES
 Predicted change in Energy=-4.865686D-08
 Optimization completed.
    -- Stationary point found.
Frequency calculation log file
 Low frequencies ---    0.0010    0.0013    0.0014    6.1527    6.1528    6.1528
 Low frequencies ---   76.3733   76.3733   76.3733
[Mn(CO)6]+ |
[Fe(CO)6]2+
Method: B3YLP
Basis sets:
- C, O: 6-31G (d,p)
- Fe: LanL2DZ
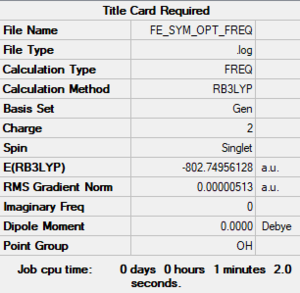
         Item               Value     Threshold  Converged?
 Maximum Force            0.000011     0.000450     YES
 RMS     Force            0.000004     0.000300     YES
 Maximum Displacement     0.000034     0.001800     YES
 RMS     Displacement     0.000015     0.001200     YES
 Predicted change in Energy=-4.521203D-10
 Optimization completed.
    -- Stationary point found.
Frequency calculation log file
 Low frequencies ---  -10.5131  -10.5130  -10.5130   -0.0009   -0.0004   -0.0002
 Low frequencies ---   82.0308   82.0308   82.0308
[Fe(CO)6]2+ |
Comparative analysis
The analysed compounds are isolelectronic and isostructural; therefore, the main differences should arise from the varying degree of backbonding between the metal centre and the *-acceptor carbonyl ligands. Thus, progressing across the row, the metal centre becomes more electropositive and the valence electrons are affected by an increasing Zeff.
It is therefore expected that backbonding with the ligands should decrease as the valence electrons of the metal centre become more tightly held, with the valence 3d orbitals contracting, resulting in poorer overlap with the ligand frontier orbitals.
Since backbonding involves donation of electrons into the * orbital on CO, its decrease across the row could be observed as a lengthening of the M-C bond (which it would otherwise stabilise) and a shortening of the C=O bond (which it would otherwise destabilise).
Experimentally, this could be confirmed by IR spectroscopy (increasing CO stretching frequency) and, additionally, X-ray diffraction, for a general determination of all bond lengths.
Ng611 (talk) 17:35, 30 May 2019 (BST) Excellent rationalisation and good suggestions for experimental validation.
| M-C bond length (A) | C-O bond length (A) | C=O IR t1u stretching frequency (cm-1) | Charge on M (e) | Charge on C (e) | Charge on O (e) | |
|---|---|---|---|---|---|---|
| [Cr(CO)6] | 1.915 | 1.149 | 2086 | -2.450 | 0.827 | -0.419 |
| [Mn(CO)6]+ | 1.908 | 1.136 | 2199 | -2.048 | 0.834 | -0.326 |
| [Fe(CO)6]2+ | 1.942 | 1.125 | 2297 | -1.503 | 0.815 | -0.231 |
The simulation confirms the increased electropositive character of the metal centre and the increasing IR carbonyl stretching frequency, corresponding to a decrease of backbonding and strengthening and shortening of the C-O bond across the row. However, the predicted M-C bond lengths do not show the expected trend, with the Mn complex having the shortest M-C bond.
Generally, vibrational modes that have the same symmetry as quadratic functions (e.g. x2, y2, z2 etc., as well as their linear combinations) are Raman IR active. Therefore, the symmetrical carbonyl a1g and eg stretching modes, which transform as (x2+y2+z2) and (2z2-x2-y2, x2-y2) respectively, could be investigated using this technique.
Molecular orbitals
| a1g | 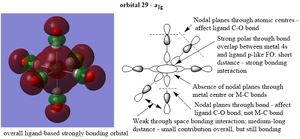 |
|---|---|
| eg | 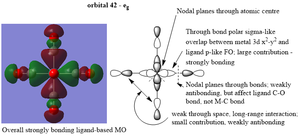 |
| t2g |  |
Ng611 (talk) 17:41, 30 May 2019 (BST) For your a1g orbital, what AO is that on the central metal atom? Is it s-type, or did you draw an (incorrect) dz^2 orbital? It's unclear. To cut down ambiguity, you could explicitly label the orbital.
Ng611 (talk) 17:45, 30 May 2019 (BST) In your eg orbital, the carbon interacts with the metal through an along bond p-orbital to form a sigma orbital. You then also have a sigma orbital between the carbon and oxygen, with the nodes passing through the C and O atomic centers.
Ng611 (talk) 17:45, 30 May 2019 (BST) Your t2g orbital is correct, well done!
In the case of * acceptor ligands, such as CO, the favourable interaction between the metal t2g orbitals and the ligand * frontier orbitals leads to an increase of the splitting parameter oct.
This also gives rise to a corresponding set of t2g orbitals (no. 56-58), which are expected to be higher in energy than the eg orbitals of the metal complex.
However, due to the loss of precision of Gaussian when estimating higher-energy unoccupied orbitals, it has placed the aforementioned unoccupied t2g orbitals lower in energy than the eg orbitals (no. 65-66), which would otherwise be characteristic of a donor ligand.
