User:Zl4817
NH3 Molecule Information
Optimization Information
Calculation Method: RB3LYP
Basis Set: 6-31G(d,p)
Final Energy E(RB3LYP): -56.44397188 a.u.
RMS Gradient: 0.05399560 a.u.
Point Group: C3V
Geometry
N-H Bond Distance: 1.01798Å
H-N-H Bond Angle: 105.741°
Item Table
         Item               Value     Threshold  Converged?
 Maximum Force            0.000004     0.000450     YES
 RMS     Force            0.000004     0.000300     YES
 Maximum Displacement     0.000072     0.001800     YES
 RMS     Displacement     0.000035     0.001200     YES
Jmol Dynamic Image
NH3 Molecule |
Frequency Analysis
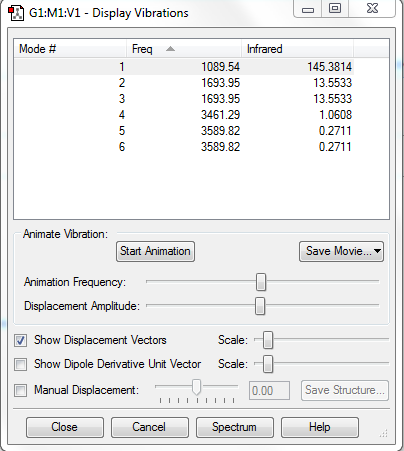
Number of Mode Expected: 3N-6=6(N=4)
Degenerate Modes: Modes 2 and 3: Frequency 1693.95cm-1; Modes 5 and 6: Frequency 3589.82cm-1
Bending Modes: Modes 1, 2 and 3
Stretching Modes: Modes 4, 5 and 6
Highly Symmetric Mode: Mode 4
Umbrella Mode: Mode 1
Number of bands expected to see in an experimental spectrum of gaseous ammonia: 2
Explanation: In theory, 4 bands would be seen, which have intensities of 145.3814 (from Mode 1), 27 (combined value for degenerate Modes 2 and 3), 1.0608 (Mode 4), 0.542 (combined value for degenerate Modes 5 and 6). However, bands with intensities 1.0608 and 0.542 are too minor so they would be ignored. Hence, only 2 bands would be seen.
Atomic Charge
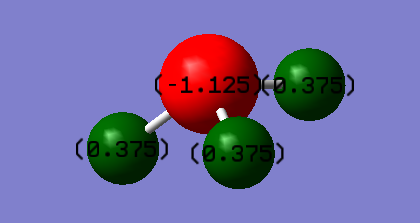
Charge on N atom: -1.125
Charge on H atom: 0.375
It is expected that nitrogen will have a negative charge while hydrogen having a positive charge, as nitrogen is more electronegative than hydrogen.
N2 Molecule Information
Optimization Information
Calculation Method: RB3LYP
Basis Set: 6-31G(d,p)
Final Energy E(RB3LYP): -109.52412868 a.u.
RMS Gradient: 0.00000060 a.u.
Point Group: Dinfh
Geometry
N-N triple Bond Distance: 1.10550Å
N-N triple Bond Angle: 180°
Item Table
         Item               Value     Threshold  Converged?
 Maximum Force            0.000001     0.000450     YES
 RMS     Force            0.000001     0.000300     YES
 Maximum Displacement     0.000000     0.001800     YES
 RMS     Displacement     0.000000     0.001200     YES
Jmol Dynamic Image
N2 Molecule |
Frequency Analysis
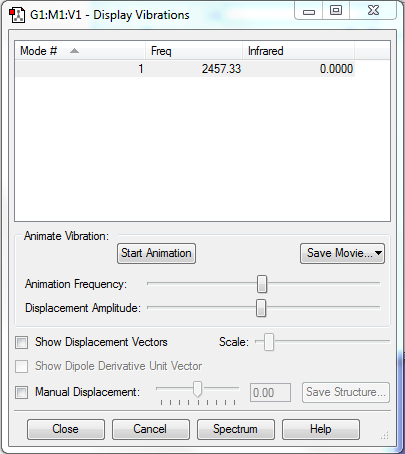
Number of Mode Expected: 3N-5=1(N=2)
Degenerate Modes: N/A
Bending Modes: N/A
Stretching Modes: Mode 1 with frequency 2457.33cm-1
Highly Symmetric Mode: Mode 1
Umbrella Mode: N/A
Number of bands expected to see in an experimental spectrum of gaseous ammonia: 0
Explanation: The vibration mode of molecule does not induce a change in dipole moment, hence it could not be observed in IR spectrum.
Atomic Charge
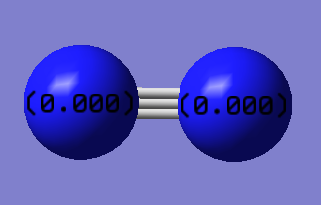
Charge on both N atoms: 0
Molecular Orbital Analysis
H2 Molecule Information
Optimization Information
Calculation Method: RB3LYP
Basis Set: 6-31G(d,p)
Final Energy E(RB3LYP): -1.17853936 a.u.
RMS Gradient: 0.00000017 a.u.
Point Group: Dinfh
Geometry
H-H Bond Distance: 0.74279Å
H-H Bond Angle: 180°
Item Table
         Item               Value     Threshold  Converged?
 Maximum Force            0.000000     0.000450     YES
 RMS     Force            0.000000     0.000300     YES
 Maximum Displacement     0.000000     0.001800     YES
 RMS     Displacement     0.000001     0.001200     YES
Jmol Dynamic Image
H2 Molecule |
Frequency Analysis
Number of Mode Expected: 3N-5=1(N=2)
Degenerate Modes: N/A
Bending Modes: N/A
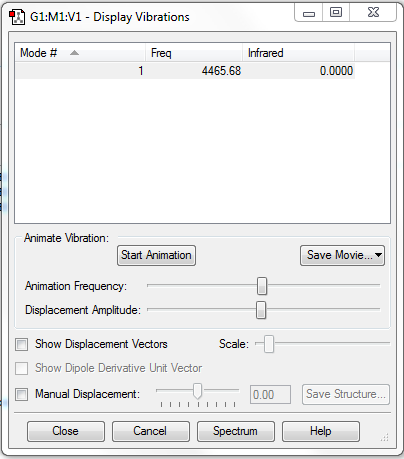
Stretching Modes: Mode 1 with frequency 4465.68cm-1
Highly Symmetric Mode: Mode 1
Umbrella Mode: N/A
Number of bands expected to see in an experimental spectrum of gaseous ammonia: 0
Explanation: The vibration mode of molecule does not induce a change in dipole moment, hence it could not be observed in IR spectrum.
Atomic Charge
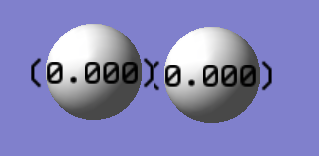
Charge on both H atoms: 0
Reaction Energy
CH4 Molecule Information
Optimization Information
Calculation Method: RB3LYP
Basis Set: 6-31G(d,p)
Final Energy E(RB3LYP): -40.52401404 a.u.
RMS Gradient: 0.00003263 a.u.
Point Group: Td
Geometry
C-H Bond Distance: 1.09197Å
H-C-H Bond Angle: 109.471°
Item Table
         Item               Value     Threshold  Converged?
 Maximum Force            0.000063     0.000450     YES
 RMS     Force            0.000034     0.000300     YES
 Maximum Displacement     0.000179     0.001800     YES
 RMS     Displacement     0.000095     0.001200     YES
Jmol Dynamic Image
CH4 Molecule |
Frequency Analysis
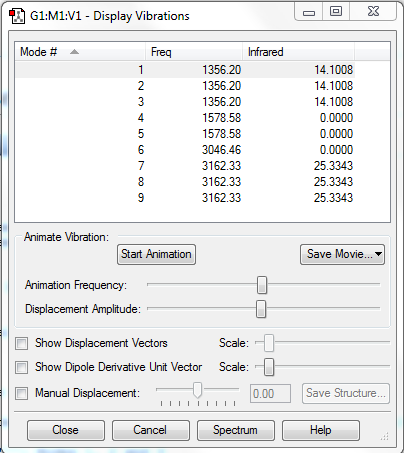
Number of Mode Expected: 3N-6=9(N=5)
Degenerate Modes: Modes 1, 2 and 3: Frequency 1356.20cm-1; Modes 4 and 5: Frequency 1578.58cm-1; Modes 7, 8 and 9: Frequency 3162.33cm-1;
Bending Modes: Modes 1, 2, 3, 4 and 5
Stretching Modes: Modes 6, 7, 8 and 9
Highly Symmetric Mode: Mode 6
Umbrella Mode: Mode 1
Number of bands expected to see in an experimental spectrum of gaseous ammonia: 2
Explanation:2 bands would be seen, which have intensities of 42.3024 (combined value for degenerate Modes 1, 2 and 3), and 76.0029 (combined value for degenerate Modes 7, 8 and 9). The vibration modes 4, 5 and 6 do not induce a change in dipole moment, hence they could not be observed in IR spectrum.
Atomic Charge
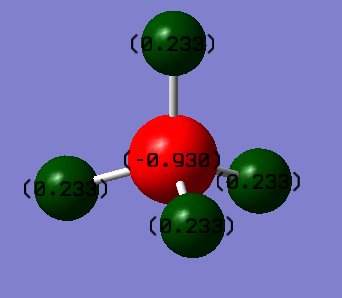
Charge on C atom: -0.930
Charge on H atom: 0.233
It is expected that carbon will have a negative charge while hydrogen having a positive charge, as carbon is more electronegative than hydrogen.

