User:Yz8711
Synthesis and computational lab: 1C
Conformational analysis using Molecular Mechanics (Part 1)
Hydrogenation of Cyclopentadiene Dimer
The dimerisation of cyclopentadienes will produce endo dimer 2 more favourable compared to exo dimer 1. Afterwards, the hydrogenation of this endo dimer will generate two dihydro derivatives 3 and 4. By comparing and analysing the data collected from molecular mechanics technique(Avogadro), it could be figured out that exo dimer is thermodynamically more stable while endo dimer is more kinetically controlled(more favourabe to be produced).
The mechanism shows below:

Table 1. Energy Dissection of 4 dimers
| exo dimer 1 | endo dimer 2 | dimer 3 | dimer 4 | |
| total energy/kcal/mol | 55.37346 | 58.19073 | 50.44571 | 41.25749 |
| total bond stretching energy/kcal/mol | 3.54284 | 3.46687 | 3.3113 | 2.82306 |
| total angle bending energy/kcal/mol | 30.77282 | 33.19279 | 31.93219 | 24.68551 |
| total stretch bending energy/kcal/mol | -2.04134 | -2.08207 | -2.10216 | -1.65715 |
| total torsional energy/kcal/mol | -2.73094 | -2.94965 | -1.46708 | -0.37813 |
| total out-of-plane bending energy/kcal/mol | 0.01495 | 0.0221 | 0.01314 | 0.00028 |
| total van der waals energy/kcal/mol | 12.80142 | 12.35628 | 13.63879 | 10.6369 |
| total electrostatic energy/kcal/mol | 13.01372 | 14.18442 | 5.11954 | 5.14702 |
As you can see from the table, the total energy of the exo dimers lower than the endo one, which means that the former is thermodynamically more stable. Due to that the total energy for endo dimer is higher, so it is kinetically controllded to be the major final product. By comparing all the dissection energies shows above, it could be found that the total angle bending energy contributes the most to this difference in total energy. The reason to cause such a difference is that the endo sturcure is more bent, which could be illustrated by comparing the bond angle of a sp3 carbon in the same positon in two dimers(the endo one is larger).
Table 2. Angle Comparison
| exo dimer | endo dimer | Dimer 3 | Dimer 4 | ||||||||||||
|
|
|
|
The the standard angle for a tetrahedral structure sp3 carbon is 109.5°. By comparing the angle shown above(114.9°for exo dimer and 117.8°for endo dimer), it can be found that the endo dimer is more bent compared to the standard angle, which demonstrated that it has a lager total angle bending energy.
The angle in dimer 3 is 107.4°, by comparing to the standard sp2 carbon angle 120° the difference would be 12.6. The angle in dimer 4 is 102.9°, it has a smaller difference by comparing to the standard sp3 carbon angle 109.5°. This also demonstrates that why dimer 3 has a lager total angle bending energy, which contributed the most to the total energy, and is kinetically controlled. The dimer 4 is more thermodynamically stable.
The following molecules 9 and 10 are the key intermediates in the total synthesis of Taxol (an important drug in the treatment of ovarian cancers) proposed by Paquette[1] with the carbonyl group pointing either up or down. By comparing the total and dissection energy, it is found that intermediate 10 with carbonyl group pointing down is more thermodynamically stable.

Table 3. Dissection energy of two intermediates and two derivatives
| 9 | 9' | 10 | 10' | |||||||||||||
| Avogadro Figure |
|
|
|
| ||||||||||||
| total energy/kcal/mol | 70.55018 | 77.92074 | 60.59944 | 70.085 | ||||||||||||
| total bond stretching energy/kcal/mol | 7.71116 | 7.24725 | 7.5711 | 7.47175 | ||||||||||||
| total angle bending energy/kcal/mol | 28.34612 | 25 | 18.79432 | 26.75596 | ||||||||||||
| total stretch bending energy/kcal/mol | -0.05487 | 0.19554 | -0.14913 | 0.25381 | ||||||||||||
| total torsional energy/kcal/mol | 0.07126 | 10.76378 | 0.43691 | 9.49576 | ||||||||||||
| total out-of-plane bending energy/kcal/mol | 0.96047 | 0.06473 | 0.8887 | 0.11398 | ||||||||||||
| total van der waals energy/kcal/mol | 33.21466 | 33.69162 | 33.13126 | 34.99374 | ||||||||||||
| total electrostatic energy/kcal/mol | 0.30138 | 0 | -0.04089 | 0 |
Which of the two atropisomers is the more stable?
Basically, by optimising the above molecules in Avogadro program, the minimum total energy can be carried out, which is 70.55018 and 60.59944kcal/mol for compound 9 and 10 separately. The compound 10 with carbonyl group pointing down has lower total energy and therefore is more stable.
Why the alkene reacts abnormally slowly?
By comparing the 9 with 9' and 10 with 10', the difference is that the double bond is hydrogenated to form a single bond. According to the literature[2], it is said that the Olefinic Strain(OS),measured by subtracting the total strain energy of the most stabe conformer of the parent hydrocarbon from the total strain energy of the olefin, is the main factor to justify whether the olefin is isolable bridgehead or not. If the OS<<17kcal/mol, then it is isolable bridgehead olefin. For instance, the difference of total torsional energy between 9 and 9' is -10.69252cal/mol, which is far less than 17cal/mol. As a result, 9 is a isolated olefin with stable structure, which explains why the reaction undergoes abnormally slow. In the literature, it is concluded that the olefin strain is largely due to twisting around the double bond; this decreases the HOMO-LUMO difference. Highly twisted bridgehead olefins thus have significant diradicaloid character.
Spectroscopic Simulation using Quantum Mechanics (Part 1)
The molecules 17 and 18 are derivatives of 9 and 10 shown above, when refluxed in tetrahydrofuran for several days, 17 is completely transformed into its conformational isomer 18. Once the carbonyl oxygen points down as in 18, a lower energy conformation is attained.[3]

Table 4. Energy of Derivatives 17 and 18.
| ' | 17 | 18 | ||||||
| Avogadro Figure |
|
| ||||||
| total energy/kcal/mol | 106.51482 | 102.32318 | ||||||
| total bond stretching energy/kcal/mol | 16.42883 | 14.36942 | ||||||
| total angle bending energy/kcal/mol | 31.56527 | 27.37804 | ||||||
| total stretch bending energy/kcal/mol | 0.01019 | 0.46892 | ||||||
| total torsional energy/kcal/mol | 11.13796 | 14.82348 | ||||||
| total out-of-plane bending energy/kcal/mol | 1.24184 | 1.0577 | ||||||
| total van der waals energy/kcal/mol | 53.33202 | 50.77309 | ||||||
| total electrostatic energy/kcal/mol | -7.20129 | -6.54747 |
From the table shown above, it demonstrated that the derivative 18 is more thermodynamically stable due to it has lower total energy.
13C spectra
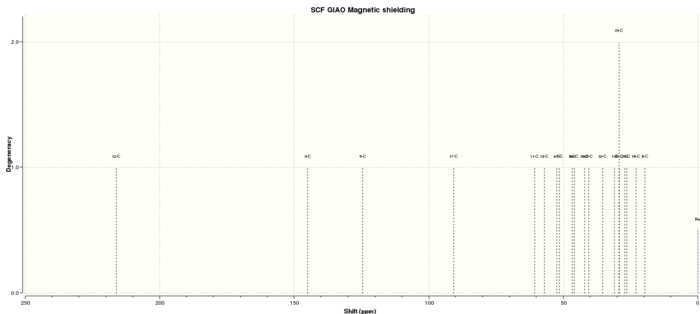
Table 5. 13C NMR spectra data
| C atom | shift/ppm | Degenercy |
| 12-C | 216.1064763 | 1.00000 |
| 3-C | 145.1255305 | 1.00000 |
| 5-C | 124.679523 | 1.00000 |
| 17-C | 90.64913363 | 1.00000 |
| 11-C | 60.64046575 | 1.00000 |
| 13-C | 57.04104715 | 1.00000 |
| 4-C | 52.47783745 | 1.00000 |
| 7-C | 51.54822803 | 1.00000 |
| 6-C | 46.69194578 | 1.00000 |
| 24-C | 45.95482971 | 1.00000 |
| 18-C | 42.16754886 | 1.00000 |
| 23-C | 40.56998747 | 1.00000 |
| 10-C | 35.33412388 | 1.00000 |
| 1-C | 31.01266965 | 1.00000 |
| 20-C | 29.35346946 | 2.00000 |
| 15-C | 29.32003702 | 2.00000 |
| 2-C | 27.09146448 | 1.00000 |
| 9-C | 26.40383862 | 1.00000 |
| 19-C | 22.9051313 | 1.00000 |
| 8-C | 19.72693766 | 1.00000 |
1H spectra
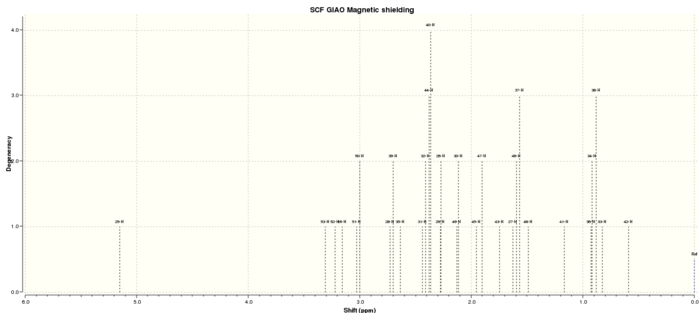
Table 6. 1H NMR spectra data
| H atom | shift/ppm | Degeneracy |
| 25-H | 5.151082801 | 1.00000 |
| 53-H | 3.308424388 | 1.00000 |
| 52-H | 3.22130496 | 1.00000 |
| 16-H | 3.158409093 | 1.00000 |
| 51-H | 3.028959223 | 2.00000 |
| 50-H | 3.000487322 | 2.00000 |
| 28-H | 2.729953527 | 2.00000 |
| 39-H | 2.701303411 | 2.00000 |
| 35-H | 2.635063591 | 1.00000 |
| 31-H | 2.43756362 | 4.00000 |
| 32-H | 2.409212031 | 4.00000 |
| 44-H | 2.378858972 | 4.00000 |
| 40-H | 2.361893464 | 4.00000 |
| 29-H | 2.27671558 | 2.00000 |
| 26-H | 2.270075278 | 2.00000 |
| 49-H | 2.129123523 | 2.00000 |
| 30-H | 2.113669856 | 2.00000 |
| 45-H | 1.954063851 | 2.00000 |
| 47-H | 1.904341606 | 2.00000 |
| 43-H | 1.745307449 | 1.00000 |
| 27-H | 1.624750697 | 3.00000 |
| 46-H | 1.595177895 | 3.00000 |
| 37-H | 1.567612757 | 3.00000 |
| 48-H | 1.48955497 | 1.00000 |
| 41-H | 1.165060017 | 1.00000 |
| 36-H | 0.924864726 | 3.00000 |
| 34-H | 0.915514959 | 3.00000 |
| 38-H | 0.881423531 | 3.00000 |
| 33-H | 0.82405528 | 1.00000 |
| 42-H | 0.59190554 | 1.00000 |
Table 7. Literature reference data
| 'H NMR (300 MHz, CDCI) | 64.84(dd,J=7.2,4.7Hz, 1 H),3.40-3.10(m,4H),2.99(dd,J=6.8, 5.2 Hz, 1 H), |
| 2.80-1.35 (series of m, 14 H), 1.38 (s, 3 H), 1.25 (s, 3 H), 1.10 (s, 3 H), 1.004.80 (m, 1 H) | |
| 13C NMR(75 MHz, CDCI) /ppm | 218.79, 144.63, 125.33, 72.88, 56.19, 52.52,48.50, 46.80, 45.76, 39.80, |
| 38.81, 35.85, 32.66, 28.79, 28.29, 26.88, 25.66, 23.86, 20.96, 18.71; |
By comparing the computational data with the reference values, the former 13C NMR chemical shift is slightly larger than the reference due to Spin orbital coupling errors caused by the carbon attached to 'heavy' elements(particularly S element). 1H NMR spectra are quite similar. Some overlap peaks within 1H NMR might be caused by different conformations or different chemical solvent used.
Analysis of the properties of the synthesised alkene epoxides (Part 2)
In the second part, Shi and Jacobsen asymmetric epoxidation catalysts,shown in figure 4. and 5. separately, are used to produce two different chiral alkene epoxide of unknown absolute configurations in the enantiomeric excess. According to the first part experience, we are suggested to predict the configuration and its' formation by studying the catalyst structure, the product NMR, the absolute configuration and interactions in the active site.
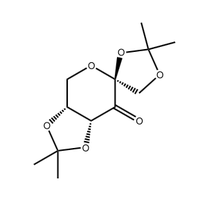
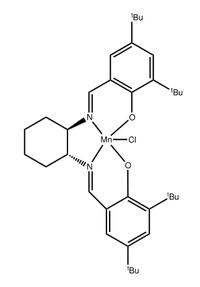
Shi |
Shi
9 |
Jacobsen
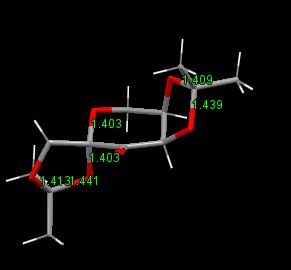
the C-O bond lengths for the two anomeric centres
From the diagram below, it can be seen that one of the two adjacent C=O length for the two anomeric is longer than the other and also longer than the normal C=O bond(1.43). For instance, 1.439>1.43>1.409. It can be explained by the anomeric effect. The lone pair of electrons on one oxygen donates to the sigma* C-O orbital which strength the bond and the anti-bonding therefore weaken the other.
the close approach of the two adjacent t-butyl groups on the rings
From the diagram below, we measured out the distances between the two adjacent hydrogen, which is 2.328, 2.577, 2.924, 2.866. According to the literature[4], the two hydrogen van der waals interaction is 2.4. Due to that 2.328 and 2.577 is quite close to 2.4, therefore, the alkene will be hindered to get close to the two tBu group and slower the rate of raction as a result.

The calculated NMR properties of epoxides
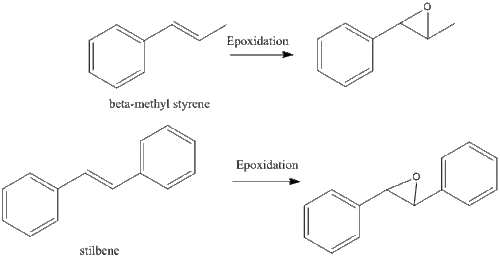
The following diagram shows the epoxidation of beta-methyl styrene and stilbene and several diagrams and tables of 13C and 1H NMR spectra.
Assigning the absolute configuration of the product
the calculated NMR properties of trans ß-methyl styrene and trans stilbene
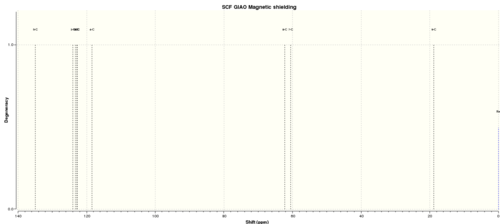
Table 8. 13C NMR spectra of Trans b-methyl epoxide
| C atom | shift/ppm | Degenercy |
| 5-C | 134.9753287 | 1.00000 |
| 3-C | 124.0723275 | 1.00000 |
| 1-C | 123.3280131 | 1.00000 |
| 6-C | 122.7965861 | 1.00000 |
| 2-C | 122.7268744 | 1.00000 |
| 4-C | 118.4861195 | 1.00000 |
| 8-C | 62.31999215 | 1.00000 |
| 7-C | 60.57584753 | 1.00000 |
| 9-C | 18.83766596 | 1.00000 |
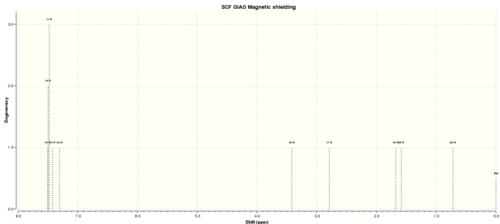
Table 9. 1H NMR spectra of Trans b-methyl epoxide
| H atom | shift/ppm | Degenercy |
| 15 | 7.500576702 | 3.00000 |
| 13 | 7.496531286 | 3.00000 |
| 11 | 7.476405398 | 3.00000 |
| 12 | 7.421502737 | 1.00000 |
| 14 | 7.307267489 | 1.00000 |
| 16 | 3.414612931 | 1.00000 |
| 17 | 2.787870161 | 1.00000 |
| 19 | 1.678227695 | 1.00000 |
| 18 | 1.587293269 | 1.00000 |
| 20 | 0.716949482 | 1.00000 |
trans stilbene
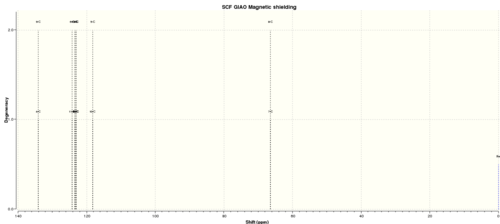
Table 10. 13C NMR spectra of Trans stilbene epoxide
| C atom | shift/ppm | Degenercy |
| 4 | 134.0891976 | 2.00000 |
| 9 | 134.0891127 | 2.00000 |
| 11 | 124.2214124 | 2.00000 |
| 6 | 124.2214061 | 2.00000 |
| 2 | 123.5181145 | 2.00000 |
| 13 | 123.518104 | 2.00000 |
| 12 | 123.2119811 | 2.00000 |
| 1 | 123.2119469 | 2.00000 |
| 14 | 123.0766307 | 2.00000 |
| 3 | 123.0765146 | 2.00000 |
| 10 | 118.2632122 | 2.00000 |
| 5 | 118.263165 | 2.00000 |
| 7 | 66.4254186 | 2.00000 |
| 8 | 66.4253744 | 2.00000 |
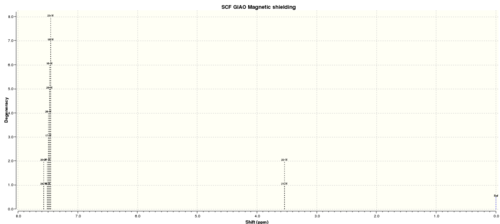
Table 11. 1H NMR spectra of Trans stilbene epoxide
| H atom | shift/ppm | Degenercy |
| 24 | 7.57053558 | 2.00000 |
| 20 | 7.570534923 | 2.00000 |
| 18 | 7.50688397 | 8.00000 |
| 27 | 7.506879479 | 8.00000 |
| 17 | 7.489637596 | 8.00000 |
| 26 | 7.489636496 | 8.00000 |
| 25 | 7.46914115 | 8.00000 |
| 16 | 7.469139091 | 8.00000 |
| 19 | 7.450923311 | 8.00000 |
| 23 | 7.450917951 | 8.00000 |
| 21 | 3.537703364 | 2.00000 |
| 22 | 3.537660905 | 2.00000 |
Table 12. Optical rotation data
| trans-beta methyl styrene(R,R) | cis-beta methyl styrene(R,S) | trans styrene(RR) | cis styrere(RS) | |
| experimental optical rotation at 598 nm | -101.52 | -119.27 | 39.99 | 24.03 |
| literature optical rotation | 44.3[5] | 38.6[6] | 319.8[7] | 87.1[8] |
Analysis
The computational optical rotation result shows a large difference compared to the literature value. The reason may be caused due to the different solvent used, the different temperature set, however the mainly reason must be the conformation structure is different.
The vibrational circular dichroism (VCD)
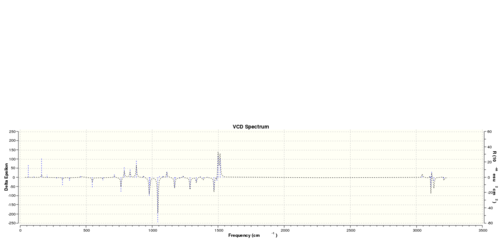
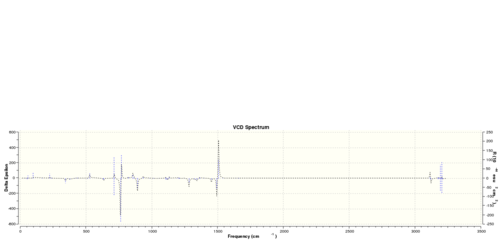
Using the (calculated) properties of transition state for the reaction (β-methyl styrene only)
Table 13. k for beta-methyl stytrene (shi catalyst)
| RR | SS | |
| Most stable transtion state group 4 | -1343.032443 | -1343.02472 |
| Free Energy Difference (Hartree) | -0.007723 | |
| Free Energy Difference (KJ/mol) | -20.27672878 | |
| k | 3596 | |
Table 14. k for beta-methyl stytrene (jacobsen catalyst)
| trans-beta methyl styrene | cis-beta methyl styrene | |||
| SS | RR | SR | RS | |
| Most stable transtion state group 4 | -3383.262481 | -3383.254344 | -3383.259559 | -3383.25106 |
| Free Energy Difference (Hartree) | -0.008137 | -0.008499 | ||
| Free Energy Difference (KJ/mol) | -21.36368536 | -22.314116 | ||
| k | 5580 | 8190 | ||
According to the minimum free energy of transition state given in the module, the selectivity of the enantiomers k (ratio of the two enantiomers in another word) can be calculated by using the formula: G = -RT * ln k, where G is the difference in free energy of two enantiomers in units of J/mol. (1 Hartree = 2625.499KJ/mol)
Conclusion
Therefore, it can be concluded that R,R series transition state for Shi epoxidation of trans-β-methyl styrene is predicted to be enantiomeric excess, which is the same as S,S series transition state for Jacobsen epoxidation of trans-β-methyl styrene and S,R series transition state for Jacobsen epoxidation of cis-β-methyl styrene.
Investigating the non-covalent interactions in the active-site of the reaction transition state
Orbital |
R,R trans stilbene
The above diagram is called Non-covalent interactions(NCI)which include hydrogen bonds, electrostatic attractions and dispersion-like close approaches of pairs of atoms can be defined by the properties of the electron density.[9]. The colour indicates the strength of the interactions(blue is very attractive, green mildly attractive, yellow mildly repulsive and red is strongly repulsive). For instance, within the cyclopentane contain two oxygen atoms, the interaction colour shows red which is caused by the strong lone pair electron repulsion on the oxygen. What's more, the mix of red and blue ring in the center indicates the bond forming in a transition state but usually be ignored.
Investigating the Electronic topology (QTAIM) in the active-site of the reaction transition state
Investing the Electronic topology(QTAIM) is complementary to the NCI(non covalent) analysis. It focus on the electron density in the covalent regions of the molecules as well as the weaker interactions identified in the NCI analysis. The following diagram is same alkene which used in the NCI (RR trans stilbene).
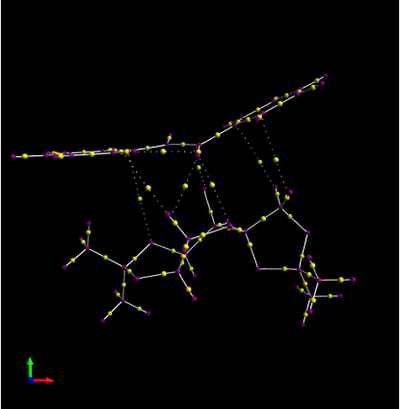
The yellow spot connected by the doted line indicates that it is a weak non covalent BCP(bond critical point, associated with weak interaction between oxygen and hydrogen in this instance). On the other hand, the yellow spot connected by the normal line known as a strong BCP. In the diagram shown above, the yellow spot connected by the doted lines seems to be dominated between the two compound, therefore there are associated with a non covalent bond.
Assigning the absolute configuration of the product
On reaxys, search a epoxide with advanced condition ORP.ORP>'500'
The compound I chose is trans-1-(p-Chlorphenyl)-2-phenylethenoxid as shown below
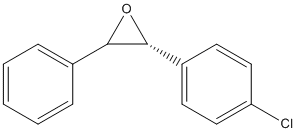
The compound Erythro 1-(4′-chlorophenyl)- and 1-(4′-methylphenyl)-2-phenylethane diols exist in two enantiomers with [1S:2R] and [1R:2S].[10]
| Type 1 | Type 2 | |
| Optical rotatory power | 350 deg | 780 deg |
| wavelength | 589 | 436 |
references
- ↑ S. W. Elmore and L. Paquette, Tetrahedron Letters, 1991, 319; DOI:10.1016/S0040-4039(00)92617-0 10.1016/S0040-4039(00)92617-0 10.1016/S0040-4039(00)92617-0
- ↑ W. F. Maier, P. Von Rague Schleyer, J. Am. Chem. Soc., 1981, 103, 1891. DOI:10.1021/ja00398a003
- ↑ Spectroscopic data: L. Paquette, N. A. Pegg, D. Toops, G. D. Maynard, R. D. Rogers, J. Am. Chem. Soc.,, 1990, 112, 277-283. DOI:10.1021/ja00157a043
- ↑ Manjeera Mantina , Adam C. Chamberlin , Rosendo Valero , Christopher J. Cramer and Donald G. Truhlar * Department of Chemistry and Supercomputing Institute, University of Minnesota, Minneapolis, Minnesota 55455-0431 J. Phys. Chem. A, 2009, 113 (19), pp 5806–5812; DOI:10.1021/jp8111556
- ↑ Andrea Wong , Bin Wang , Mei-Xin Zhao and Yian Shi *Department of Chemistry, Colorado State University, Fort Collins, Colorado 80523; DOI:10.1021/jo900739q
- ↑ 1. Shota Koya,2. Yota Nishioka,3. Hirotaka Mizoguchi,4. Dr. Tatsuya Uchida,5. Prof. Tsutomu Katsuki*; DOI:10.1002/anie.201201848
- ↑ Bin Wang , Xin-Yan Wu , O. Andrea Wong , Brian Nettles , Mei-Xin Zhao , Dajun Chen and Yian Shi *Department of Chemistry, Colorado State University, Fort Collins, Colorado 80523; DOI:10.1021/jo900330n
- ↑ http://dx.doi.org/10.1016/S0040-4039(01)85782-8;
- ↑ J. L. Arbour, H. S. Rzepa, J. Contreras-García, L. A. Adrio, E. M. Barreiro, K. K. Hii, Chem.Euro. J., 2012, 18, 11317–11324, DOI:10.1002/chem.201200547
- ↑ National Institute of Arthritis, Metabolism, and Digestive Diseases, National Institutes of Health, Bethesda, MD 20014, U.S.A.; DOI:http://dx.doi.org/10.1016/0040-4020(76)85110-1
