User:Wf312
EX3 section
| Parameter | BH3 | BBr3 | GaBr3 |
|---|---|---|---|
| r(E-X) | 1.19 | 1.93 | 2.35 |
| θ(X-E-X) | 120.0 | 120.0 | 120.0 |
Note that the values reported for Borane are from the 6.21G calculation
Borane
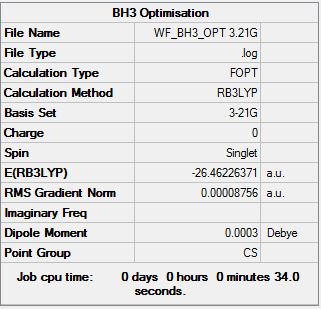
B3LYP/3-21G level
Optimisation log file here
Borane
B3LYP/6.21G(d,p) level
Optimization log file here
| Summary Data | Convergence | Jmol | |||
|---|---|---|---|---|---|
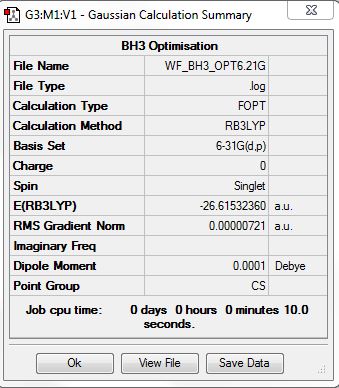 |
 Item               Value     Threshold  Converged?
 Maximum Force            0.000012     0.000450     YES
 RMS     Force            0.000008     0.000300     YES
 Maximum Displacement     0.000064     0.001800     YES
 RMS     Displacement     0.000039     0.001200     YES
 Predicted change in Energy=-1.128214D-09
 Optimization completed.
    -- Stationary point found.
|
|
GaBr3 B3LYP/LANL2DZ
Optimization log file DOI:10042/31130
| Summary Data | Convergence | Jmol | |||
|---|---|---|---|---|---|
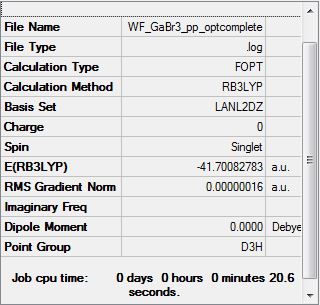 |
  Item               Value     Threshold  Converged?
 Maximum Force            0.000000     0.000450     YES
 RMS     Force            0.000000     0.000300     YES
 Maximum Displacement     0.000003     0.001800     YES
 RMS     Displacement     0.000002     0.001200     YES
 Predicted change in Energy=-1.282681D-12
 Optimization completed.
    -- Stationary point found.
|
|
BBr3 B3LYP/6-31G(d,p)LANL2DZ
Optimization log file DOI:10042/31143
| Summary Data | Convergence | Jmol | |||
|---|---|---|---|---|---|
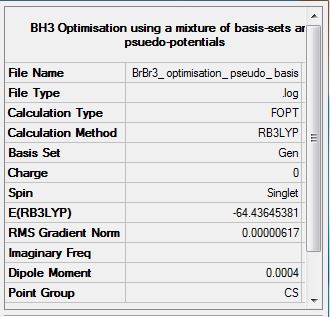 |
 Item               Value     Threshold  Converged?
 Maximum Force            0.000013     0.000450     YES
 RMS     Force            0.000006     0.000300     YES
 Maximum Displacement     0.000058     0.001800     YES
 RMS     Displacement     0.000029     0.001200     YES
 Predicted change in Energy=-6.008431D-10
 Optimization completed.
    -- Stationary point found.
|
|
BBr3 symmetry imposed D3h B3LYP/6-31G(d,p)LANL2DZ
Optimization log file DOI:10042/31143
| Summary Data | Convergence | Jmol | |||
|---|---|---|---|---|---|
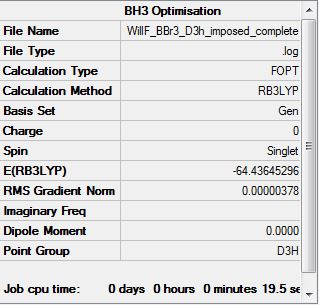 |
 Item               Value     Threshold  Converged?
 Maximum Force            0.000008     0.000450     YES
 RMS     Force            0.000005     0.000300     YES
 Maximum Displacement     0.000035     0.001800     YES
 RMS     Displacement     0.000023     0.001200     YES
 Predicted change in Energy=-3.955125D-10
 Optimization completed.
    -- Stationary point found.
|
|
Answers to questions
Structure comparison questions:
Reference for covalent radii data taken from: Beatriz Cordero, Verónica Gómez, Ana E. Platero-Prats, Marc Revés, Jorge Echeverría, Eduard Cremades, Flavia Barragán and Santiago Alvarez (2008). "Covalent radii revisited". Dalton Trans. (21): 2832–2838
In discussing all of the above structures, the general molecular characteristics will first be discussed. All compounds are EX3 trigonal planar species, and are inherently electron deficient. This electron deficiency is of vital importance in understanding the potential bonding that can arise in these compounds. Firstly, some slightly crude expectations on the bond lengths. It is relatively simple to predict that from moving from BH3 to BBr3 to GaBr3, the bond length should be increasing. Invoking purely a size related argument, the covalent bond length is equal to the sum of the covalent radii of the constituent atoms. This argument of course proposes a purely covalent bond, excluding many factors such as potential ionic contributions. Using purely covalent radii, the predicted bond length for the B-H bond is 115pm, the error range in this prediction, combined with the error range from our calculation means for the purposes of this argument, the B-H bond length appears as an almost ideal covalent bond. For B-Br, the predicted bond length is 204pm. The calculated bond length of 193pm therefore shows more a deviation from the expected value. A possible explanation for this is the presence of pi stabilisation between the bromine atoms and central boron. As previously mentioned, boron compounds are electron deficient, and hence will readily accept electron density (they are strong Lewis acids). This electron density could come from an adduct, for an example a molecule of ammonia acting as a Lewis base, or from the surrounding atoms in the trigonal planar species. Although not a formal electron donation, as for the addition of an ammonia adduct, the surrounding bromine atoms in BBr3 are able to donate electron density through their available lone pairs in to empty sp2 hybridised orbital on Boron. This increases the bond order of the B-Br bond, giving it a degree of double bond character justifying the shorter than expected bond length. On moving from boron to gallium the Lewis acidity decreases. The previously mentioned pi stabilisation is now far less of a factor. It must be remembered the strength of pi bonds drop off very quickly with distance. Due to the increased size of the atoms, the bond length is now much longer than for B-Br. When this is combined with the uneven orbital size, it can be imagined that the potential pi stabilisation is actually very small. The predicted bond length from considering covalent radii data is 238 pm, due to the error range in the calculation, this once again compares almost exactly to the calculated value. As a final note, it can be seen that the bond angle remains identical at 120.0 θ throughout the calculations.
What is a bond A bond is denoted as a line between two atoms, and perhaps conceptually can be viewed as an anchor between two nuclei. Using the Born-Oppenhemier approximation, whereby the energy of the system is independent of nuclear motion, ie there is no kinetic energy operator for the nuclei in the Hamiltonian the nuclei can be seen to be fixed at either end of a bond. This is of course a massive simplification, nuclei are moving, and a bond length can oscillate but crucially the electrons are seen to adapt instantaneously to any nuclear motion. When we draw structures, for example the trigonal planar boron discussed above, the structure drawn is the lowest energy possible in the system. This structure represents an optimum distance between nuclei that minimises the potential energy between the nuclei. Where nuclei are positively charged, the negatively charged electrons form the ‘glue’ between the nuclei. The electron density becomes shared between the two constituent atoms of the bond, with the negatively charged electrons sitting in between the two nuclei. With this concept, perhaps the best description of a chemical bond is a point in which electron density is higher than the surrounding space. Of course this definition runs in to problems when considering lone pairs on atoms, for example terminal halides. All of the above discussion only relates to covalent bonding. It should be considered that multiple forms of bonding exist including ionic and metallic, and the rationale behind these bonds differs somewhat to the covalent bond. What denotes weather a bond is strong or weak is also a conceptually difficult question to answer. In the broad categories of bonding, there are large size differences between the respective bonding types. Ionic bonding is, on the whole stronger than covalent bonding, due to the high electrostatic attraction of oppositely charged ions. Covalent bonding shows a huge variation in the bonding strength. A diatomic N-N triple bond is one of the strongest covalent bonds, where a large amount of electron density lies between the two atoms. On the other end of the spectrum, diatomic bonding in the halogens is typically very weak, with the lone pairs on the separate atoms being in too close proximity and leading to repulsion. This argument has so far only considered simple bonding models, where all electron density is centred across 2 atoms. Weaker bonds can be found in bridging systems, where bonds can take the form of 3c-2e or 4c-2e. This lack of electron density causes weakness within these covalent bonds.
Why doesn’t Gaussian always draw bonds? Gaussian works with pre-defined values as to the length of any given bond. This means that if a bond is particularly weak given the circumstances of the molecule, Gaussian may not show a bond. Take for example a B-H 2c-2e bond as found in BH3, and a 3c-2e bridging bond as found in B2H6. Gaussian assumes that the bond lengths for both these molecules should fall within the range expected of a B-H single bond. However, the B2H6 bridging bond is longer and weaker than usual due to its 3c-2e nature. If a low level calculation is performed, or a poor structure used for optimisation, Gaussian may fail to properly optimise the structure and show a bond.
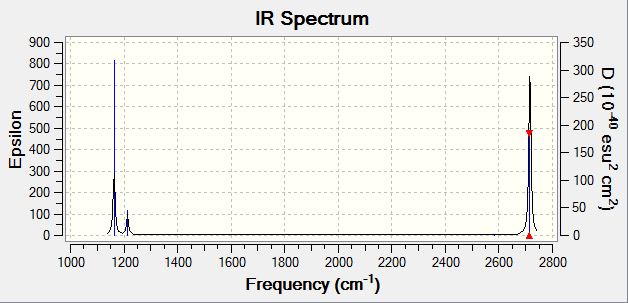
BH3 B3LYP/6.21G(d,p)
Frequency file here
| Summary Data | Low modes |
|---|---|
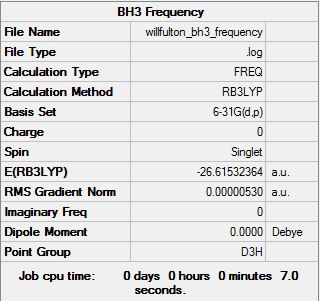 |
Low frequencies --- -14.5183 -14.5142 -10.8197 0.0008 0.0169 0.3454 Low frequencies --- 1162.9508 1213.1230 1213.1232 |
| Wavenumber | Intensity | IR active? | Type |
| 1163 | 93 | Yes | Bend ( Wag) |
| 1213 | 14 | Yes (Slight) | Bend ( Scissoring + Rocking) |
| 1213 | 14 | Yes (Slight) | Bend (Scissoring) |
| 2583 | 0 | No | Stretch (Symmetrical) |
| 2716 | 126 | Yes | Stretch (Anti symmetrical) |
| 2716 | 126 | Yes | Stretch (Anti symmetrical) |
Answer to Question
For BH3 there are 3N-6 total vibrational modes, giving a total of 6 potential IR active modes. The selection rules for IR spectroscopy require a change in molecular dipole moment on vibrational excitation. As the stretch at 2583 wavenumbers corresponds to a totally symmetrical stretch, there is no change in dipole moment along, and hence this stretch does not appear in the IR spectrum. In order for this stretch to be visualised, Raman spectroscopy would need to be used. Hence, although there are 6 potential IR modes, only 5 contain a change in dipole moment and hence only 5 peaks appear in the spectrum.
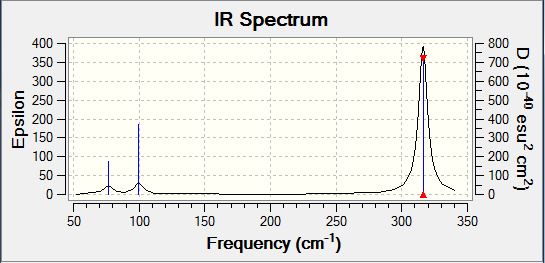
GaBr3 frequency B3LYP/LANL2DZ
Frequency log file DOI:10042/31156
| Summary Data | Low modes |
|---|---|
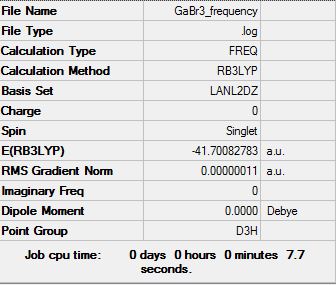 |
Low frequencies --- -0.5252 -0.5247 -0.0024 -0.0010 0.0235 1.2010 Low frequencies --- 76.3744 76.3753 99.6982 |
| Wavenumber | Intensity | IR active? | Type |
| 76 | 3 | Yes | Bend |
| 76 | 3 | Yes (Slight) | Bend |
| 100 | 9 | Yes (Slight) | Bend |
| 197 | 0 | No | Stretch (Symmetrical) |
| 316 | 57 | Yes | Stretch |
| 316 | 57 | Yes | Stretch |
Answer to question
In order to maintain validity of comparison through these calculations, the same basis set must be used for optimisation and frequency analysis. On changing the basis set, the accuracy level of the calculation will change, this can cause large differences in the recorded energies of molecules. The purpose of the optimisation is to find the lowest energy level geometry, with the frequency analysis checking this exact structure is not a transition state. A frequency analysis confirms the optimised structure is not a transition state. Previously in the optimisation we have performed a calculation to take us to an energy gradient of zero. This can be a maximum or a minimum point, with the maximum representing a transition state, and only the minimum representing a true optimisation. A ‘positive’ frequency analysis (which will confirm the optimised structure) will show all positive frequencies. The low frequencies represent micro distortions to the optimised structure, with the resultant frequencies being the result of rotational and translational modes.
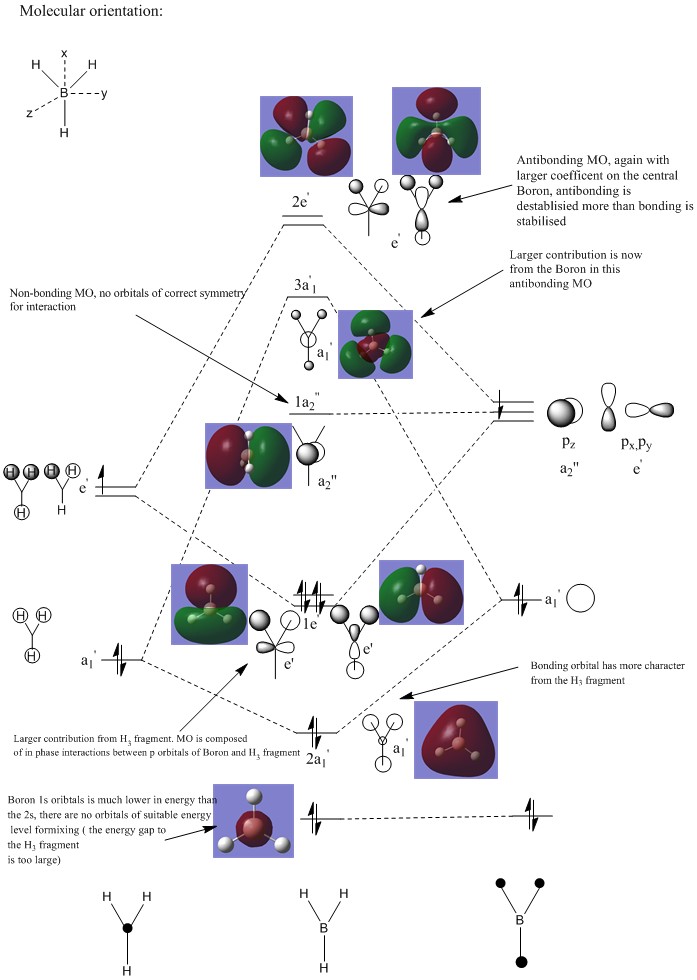
BH3 Molecular Orbital Analysis B3LYP/6-31G
Answer to questions
By examining the real MO’s against the LCAO, it appears as though the LCAO is a strong qualitative predictor as to the overall appearance and phases of an MO. Where the LCAO approximation is particularly strong, is in the examination of core like orbitals where the calculated MO’s and predicted MO representations are very similar. Perhaps of note in this example is the low difference in electronegativity and size between boron and hydrogen. This aids in making the MO’s somewhat evenly distributed in terms of size and shape, with no high polarizability or low overlap integrals to consider. The LCAO begins to lose its accuracy as we move towards unoccupied orbitals at high energy. In this range, orbitals begin to skew and deform to minimise unfavourable interactions, and the LCAO approximation begins to lose its validity.
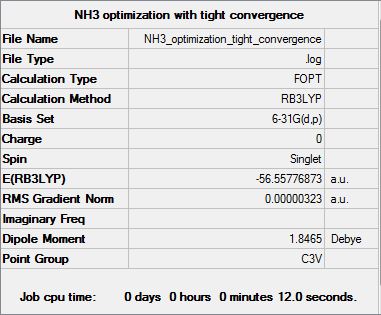
NH3 B3LYP/6.21G(d,p)
Optimization log file here
| Summary Data | Convergence | Jmol | |||
|---|---|---|---|---|---|
 |
 Item               Value     Threshold  Converged?
 Maximum Force            0.000006     0.000015     YES
 RMS     Force            0.000004     0.000010     YES
 Maximum Displacement     0.000012     0.000060     YES
 RMS     Displacement     0.000008     0.000040     YES
 Predicted change in Energy=-9.844486D-11
 Optimization completed.
    -- Stationary point found.
|
|
Frequency analysis B3LYP/6.21G(d,p)
Frequency log file here
| Summary Data | Low modes |
|---|---|
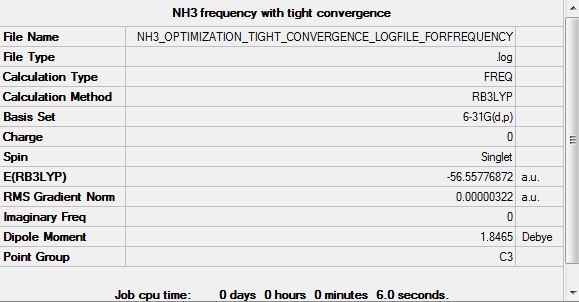 |
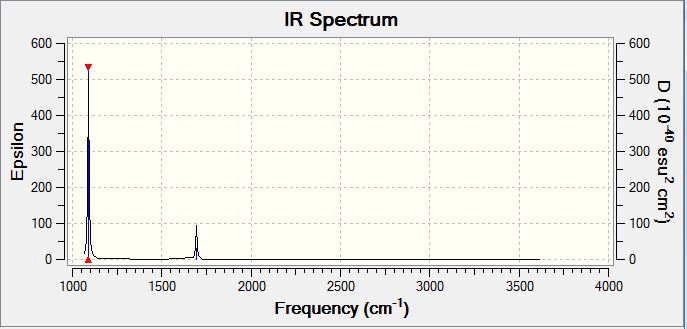
Low frequencies --- -0.0138 -0.0026 -0.0009 7.0783 8.0932 8.0937 Low frequencies --- 1089.3840 1693.9368 1693.9368 |
| Wavenumber | Intensity | IR active? | Type |
| 1089 | 145 | Yes | Bend |
| 1694 | 14 | Yes (Very Slight) | Bend |
| 1694 | 14 | Yes (Very Slight) | Bend |
| 3461 | 1 | No | Stretch |
| 3590 | 0 | No | Stretch |
| 3590 | 0 | No | Stretch |
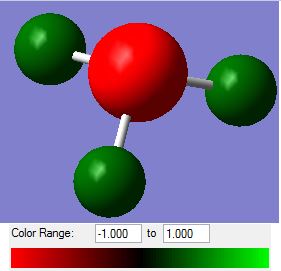
Population analysis B3LYP/6.21G(d,p)
Population analysis calculation: DOI:10042/31184
| Atom | Charge |
|---|---|
| H | 0.375 |
| N | -1.125 |
Optimization of BH3NH3
Optimisation log file here
| Summary Data | Convergence | Jmol | |||
|---|---|---|---|---|---|
 |
 Item               Value     Threshold  Converged?
 Maximum Force            0.000002     0.000015     YES
 RMS     Force            0.000001     0.000010     YES
 Maximum Displacement     0.000028     0.000060     YES
 RMS     Displacement     0.000013     0.000040     YES
 Predicted change in Energy=-8.402621D-11
 Optimization completed.
    -- Stationary point found.
|
|
Frequency analysis
Frequency log file here
| Summary Data | Low modes |
|---|---|
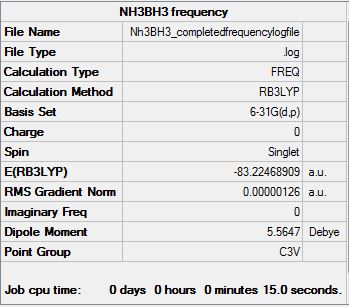 |
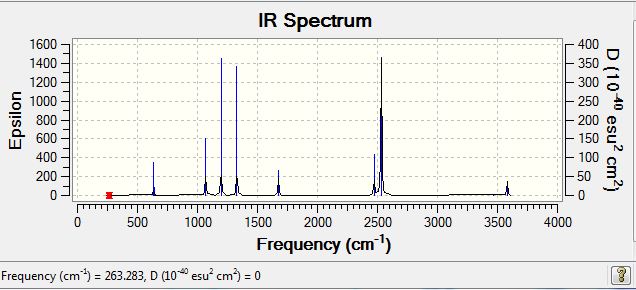
Low frequencies --- -5.6321 -0.3091 -0.0453 -0.0010 1.1953 1.2709 Low frequencies --- 263.2834 632.9623 638.4600 |
| Wavenumber | Intensity | IR active? | Type |
| 263 | 0 | No | Bend |
| 633 | 14 | Yes (Very Slight) | Stretch |
| 638 | 4 | No | Bend |
| 638 | 4 | No | Bend |
| 1069 | 41 | Yes | Bend |
| 1069 | 41 | Yes | Bend |
| 1196 | 109 | Yes | Bend |
| 1204 | 3 | No | Bend |
| 1204 | 3 | No | Bend |
| 1329 | 114 | Yes | Bend |
| 1676 | 27 | Yes | Bend |
| 1676 | 28 | Yes | Bend |
| 2472 | 67 | Yes | Stretch |
| 2532 | 231 | Yes | Stretch |
| 2532 | 231 | Yes | Stretch |
| 3464 | 3 | No | Stretch |
| 3581 | 28 | Yes | Stretch |
| 3581 | 28 | Yes | Stretch |
Answer to questions
E(NH3)= -56.5577687 au
E(BH3)= -26.6153236 au
E(NH3BH3)= -83.2246891 au
ΔE=E(NH3BH3)-[E(NH3)+E(BH3)] ΔE= -0.0515968 au ΔE=135.47 kJ/mol
Project section
Introduction
Please note: All confirmation of convergence and low frequencies of all calculations performed are included in their raw form in the appendix at the bottom of this project
As chemists, we commonly denote a bond as a single dashed line linking two atoms, with this notation signifying the sharing of two electrons. However many complexes exhibit multi-centre electron bonding, where the simplified concept of a 2c-2e bond no longer holds. We thus must adapt our over-simplified bonding model from a Lewis structure dominated model, to considering bonding in terms of molecular orbitals.
Perhaps a good starting point is examining the structure of diborane, B2 H6. The structure of diborane puzzled chemists for many years, with the currently accepted structure being eluded by Longuet Higgins. He proposed a twofold symmetric structure, with D2h symmetry, in which the bridging hydrogens exhibit 3c-2e bonding.

This structure explained the two fold symmetry present within the IR, but still failed to account for the B-B vibration. It wasn't until advancements within molecular orbital theory that the interaction between boron atoms was accurately predicted, and the IR of diborane fully explained, justifying Longuet Higgins postulate of a dimer with multi centre electron bonding.
This project looks at the relative energies of the 5 isomers of Al2Cl4Br2, a structure that forms a dimer, very similar to that of diborane.The five potential isomers are pictured below:

Optimization
Optimization calculations were carried out on all 5 isomers using identical basis sets. A 6.31G(d,p) basis set was used for the aluminium and chlorine atoms, with pseudo potentials necessary for the bromine atoms. For the bromine atom a basis set of LANL2DZ was used. The summary data from the calculations of all 5 isomers,is presented below:
| Isomer | Isomer 1 | Isomer 2 | Isomer 3 | Isomer 4 | Isomer 5 |
| File Type | .log | .log | .log | .log | .log |
| Calculation Type | FOPT | FOPT | FOPT | FOPT | FOPT |
| Calculation Method | RB3LYP | RB3LYP | RB3LYP | RB3LYP | RB3LYP |
| Basis Set | Gen | Gen | Gen | Gen | Gen |
| Charge | 0 | 0 | 0 | 0 | 0 |
| Spin | Singlet | Singlet | Singlet | Singlet | Singlet |
| E(RB3LYP) / a.u. | -2352.4162785 | -2352.4163010 | -2352.4111073 | -2352.4063255 | -2352.4163437 |
| RMS Gradient Norm / a.u. | 0.00000014 | 0.00000062 | 0.00000487 | 0.00000007 | 0.00000027 |
| Imaginary Freq | |||||
| Dipole Moment / Debye | 0.1732 | 0 | 0.1384 | 0 | 0.1909 |
| Point Group | C2V | C2H | C1 | D2H | C2V |
| Job cpu time | 0 days 0 hours 6 minutes 27.9 seconds. | 0 days 0 hours 4 minutes 16.7 seconds. | 0 days 0 hours 18 minutes 0.1 seconds. | 0 days 0 hours 2 minutes 53.0 seconds. | 0 days 0 hours 5 minutes 2.3 seconds. |
| D-Space Link | DOI:10042/31295 | DOI:10042/31296 | DOI:10042/31299 | DOI:10042/31297 | DOI:10042/31300 |
The structures were optimized to an energy minimum, and the log file checked to ensure a proper convergence at this point. The raw data from these log files can be found within the D space link given above. All optimizations are carried out assuming the Born-Oppenheimer approximation, that the electronic energy levels are independent of nuclei motion, and depend purely on nuclei position. That is to say, there is no kinetic energy operator for nuclei in the Hamiltonian. The structures were symmetry imposed before optimization- Gaussian is unable to compute to the accuracy required to generate the known point groups, and hence all isomers shown were symmetry imposed with 'Very Tight' restriction before optimization.
Analyzing the Optimized Structures
Please Note: Before analysis was undertaken on the optimized structures, frequency calculations were performed in order to ensure minima, and not transition states had been obtained. It can be assumed that all structures discussed in this section are minima, and frequency analysis confirming this is presented later in the project.
The optimized structures can shed light on the lowest energy conformer of the molecule, via analysis of the energy provided by Gaussian. The table below shows rotatable structures of the optimized isomers, alongside their energy in kJ relative to the lowest energy isomer.
| Isomer | Energy Relative to lowest energy Isomer (kJ) | |||
|---|---|---|---|---|
|
0.17 | |||
|
0.11 | |||
|
13.75 | |||
|
26.3 | |||
|
0.00 |
From the table above, it becomes possible to rank our isomers in energy order, from lowest to highest, the ordering is:
Isomer 5<Isomer 2< Isomer 1<Isomer 3< Isomer 4.
However, it must be noted that the error margin within our calculation is ± 10kJ. For this reason, the currently presented ordering is inappropriate. To the accuracy of our calculation, the ordering is actually:
Isomer 5=Isomer 2=Isomer 1<Isomer 3<Isomer 4
Because of this discrepancy within the accuracy of the program, any arguments as to why any isomers within 10kJ in energy are more/less stable than one another are unjustified, and will not be presented. To the accuracy of our calculation, these isomers are degenerate.
What factors are effecting the stability of the isomers?
Why a dimer?
Logically before rationalizing individual isomers within the structure, the cause of dimerization within the molecule should be discussed. It is common among aluminium compounds to form dimers, whereas for the isoelectronic Boron, monomer units are more common. Boron is of Group 3 in the periodic table, and is a small atom with the electronic structure 1s2 2s2 2p1. In trigonal planar Boron species (take for example BBr3 which was discussed earlier) the central Boron is electron deficient, having only a total of six valence electrons around it. However, due to its trigonal planar structure, there is a good overlap between the empty p orbital that resides on boron, and the filled p orbitals of the bromine atoms that surround it. This overlap can lead to pi stabilization, whereby electron density is donated from the lone pairs on bromine in to the electron deficient boron. This pi stabilization is strongest for boron compounds, and decreases as you descend Group III. This is a size related argument, and relates to the fact the strength of pi bonds decreases dramatically with distance, and hence while the 2p v 3p overlap of Boron with Bromine is favourable over formation of a dimer (which would remove this pi stabilisation), aluminium compounds would rather form dimers due to the weakness of potential pi overlap from the 3p orbital on aluminium.
How does the positioning of the Bromine atom effect the energy
Lone Pair donation As mentioned above, Group 3 EX 3 compounds are electron deficient, and whilst Boron counter acts this electron deficiency with pi stabilization, Aluminium compounds form dimers. The key concept here is that dimerisation has taken place in order to try and increase electron density around the Aluminium, and we can therefore make some postulations as to how the placement of different atoms could achieve this.
The first area of focus will be the bridging central bonds within the structure - the formal 3c-2e bonds. A sigma lone pair is donated from one bromine atom in to one aluminum atom, commonly drawn as a dative bond as below:

Using the above diagram, we could reasonably postulate that if the availability of the sigma lone pair for donation in to the Al center was the only factor effecting the energy of the isomers, than Isomer 4 would have the lowest energy. We could expect Isomer 4 to have the lowest energy, as it is the only isomer that does not contain a bridging chlorine atom. Due to electronegativity differences between chlorine and bromine, we expect the bromine to more willing to give up its lone pair, owed to its lower electronegativity when compared to chlorine.
Naturally, the availability of donation of the sigma lone pair is not the only factor affecting the relative energy levels of the isomers. Moreover, so far the availability of that lone pair has been discussed purely using electronegativity arguments, and this is far from the whole story
What about orbital overlap?
Continuing the idea that sigma donation from the bridging atoms is an important factor in the relative energy levels of the isomers, one must consider the extent to which the aluminium could overlap with this lone pair on the bridging halogen. Bromine may be lower in electronegativity than chlorine, but it is reasonable to expect the orbital overlap between Aluminium- Bromine to be less than the overlap between Aluminium and Chlorine. This argument is revolved around the relative sizings of the elements. We expect elements of roughly the same size to have strong overlap integrals, and hence interact efficiently with one another. As Aluminium and Chlorine share the same group in the periodic table, it is likely their orbitals interact more favourably when compared to Aluminium- Bromine, which differ more in relative sizings. We would therefore have to adapt our previous guess of the lowest energy isomer to one which contained two bridging chlorines, working off the concept that a greater overlap integral would lead to a greater stability. This would lead us to predict Isomers 1,2 and 5 to be the lowest in energy, with isomers 3 and 4 being higher due to the presence of a bridging Bromine.
Are there any other factors?
To further add to the complexity of the situation, there are still a wide variety of factors present within the structures mentioned. Considering a possible Al-Al interaction, the internal bridging bonds distances become important in determining the overlap integral of the associated orbitals of the Aluminum atoms. A classical problem with interpretating this dimer using classic Lewis structures is attempting to determine the hybridisation on the Al. IR data gives evidence of Al-Al interactions of sp2 nature, but bond angles suggest sp3. Also of consideration is the idea that Al3+ is a highly polarizing cation. This polarizing nature could form a heavily polarized bond across the bridging atoms, particularly when the larger, more easily polarizable Bromine is bridging.
What can be learnt from the optimizations
Firstly, it must be noted that is is highly likely all the factors discussed above contribute to the relative energy levels of the isomers. Our calculation tells us that Isomers 5, 2 and 1 are all degenerate, and these all share a common characteristic of having two bridging chlorides. It is therefore possible that the dominant factor in determining the energies of these isomers is the degree of orbital overlap between the Al and bridging halide. We can then compare Isomers 5,2 and 1 to Isomer 3, and learn that there is a +13kJ energy difference upon adding a bridging Bromine instead of 2 Chlorine atoms. This statement becomes more interesting when we note that on moving from Isomer 3, with one bridging Bromine, to Isomer 4, with 2 bridging Bromine atoms the energy increase is a further +13kJ mol. From our raw optimization data, it would appear that a bridging bromine atom is 13kJmol less stable than a bridging Chlorine atom in Al2Cl4Br2.
Further study: If this bonding model wished to be explored further, the NBO analysis provided by Gaussian may provide data as to the availability of the lone pair from the halide, as well as giving approximate breakdowns of the orbital overlaps involved in the bridging bonds, in order to determine the contributing orbitals, and gauge their overlap integrals
Energy considerations- How stable is the dimer structure?
In order to consider the relative stability of the dimer, energy values for the dimer structure can be compared to two isolated monomers. Theoretically, it is is expected that the dimer structure will be lower in energy than the two isolated monomers, owing to all the stabilization factors present in the dimer discussed previously.
The monomer chosen for this calculation was AlCl2Br. This monomer can easily be seen to be the starting molecule for Isomers 1-4, but Isomer 5's formation is more difficult to imagine from an AlCl2Br monomer. Isomer 5 is created via dynamic exchange of the ligands in aluminuium dimers, the situation is perhaps best explained by starting with an alternative isomer, and transforming it in to isomer 5, as below:

This dynamic exchange justifies the formation of all 5 isomers from the AlCl2Br monomers, the optimized structure of which is presented below:
| AlCl2Br monomer | ||||
| Jmol |
| |||
| File Type | .log | |||
| Calculation Type | FOPT | |||
| Calculation Method | RB3LYP | |||
| Basis Set | Gen | |||
| Charge | 0 | |||
| Spin | Singlet | |||
| E(RB3LYP) / a.u. | -1176.1901404 | |||
| RMS Gradient Norm / a.u. | 0.00000001 | |||
| Imaginary Freq | ||||
| Dipole Moment / Debye | 0.1133 | |||
| Point Group | C2V | |||
| Job cpu time | 0 days 0 hours 0 minutes 57.7 seconds. | |||
| D-Space Link | DOI:10042/31330 |
Using this optimized structure, the disassociation energy from the lowest energy isomer (Isomer 5) was calculated:
ΔE=E(Al2Cl4Br2)-[E(AlCl2Br)+E(AlCl2Br)]
ΔE= -0.03606au This means the dimer is 0.3606au (94.68kJ/mol) more stable than 2 isolated monomers.
This result confirms our hypothesis that the dimerisation of aluminium results in enhanced stability as compared to 2 isolated monomers. We can also test our earlier hypothesis that aluminium complexes prefer dimerisation due to the potential weakness of the pi stabilization, whereas Boron complexes remain as trigonal planar species due to this pi stabilisation. By setting up a very similar scenario, using BCl3 monomers to create a B2Cl6 dimer, and then calculating the disassociation energy we expect to find that in the case of Boron, 2 isolated monomers are actually more stable.
Key point- The following data on BCl3 cannot be compared to the data for the aluminium dimer as different basis sets have been used for the calculation.
To test this, a molecule of BCl3 and B2Cl6 were optimized, with frequency analysis performed to confirm a minima, with the results listed below:
| Molecule | BCl3 | B2Cl6 |
| File Type | .log | .log |
| Calculation Type | FOPT | FOPT |
| Calculation Method | RB3LYP | RB3LYP |
| Basis Set | 6-31G(d,p) | 6-31G(d,p) |
| Charge | 0 | 0 |
| Spin | Singlet | Singlet |
| E(RB3LYP) / a.u. | -1405.5626404 | -2811.0835171 |
| RMS Gradient Norm / a.u. | 0.00000003 | 0.00002463 |
| Imaginary Freq | ||
| Dipole Moment / Debye | 0.1133 | 0 |
| Point Group | D3H | D2H |
| Job cpu time | 0 days 0 hours 0 minutes 30.5 seconds. | 0 days 0 hours 2 minutes 32.1 seconds. |
| D-Space Link | DOI:10042/31343 | DOI:10042/31344 |
| Molecule | BCl3 | B2Cl6 |
| Calculation Type | FREQ | FREQ |
| Calculation Method | RB3LYP | RB3LYP |
| Basis Set | 6-31G(d,p)) | 6-31G(d,p) |
| Charge | 0 | 0 |
| Spin | Singlet | Singlet |
| E(RB3LYP) / a.u. | -1405.5626404 | -2811.0835171 |
| RMS Gradient Norm / a.u. | 0.00000011 | 0.00002467 |
| D-Space Link | DOI:10042/31342 | DOI:10042/31345 |
Using these optimized structure. the disassociation energy for the system can be calculated: ΔE=E(B2Cl6)-[E(BCl3)+E(BCl3)]
ΔE= 0.04176375 au
This means the dimer is 0.04176375 au ( 109.65kJ/mol) less stable than the isolated monomers, acting to back up the concept of pi stabilization being a highly efficient form of stabilization in trigonal planar bromine species
Overall, these optimization calculations have suggested that the method of molecular stabilization changes on moving down group 3, from pi stabilization for Boron, towards dimer related stabilization as you move down the group
Frequency analysis of Al2Cl4Br2
| Isomer | Isomer 1 | Isomer 2 | Isomer 3 | Isomer 4 | Isomer 5 |
| Calculation Type | FREQ | FREQ | FREQ | FREQ | FREQ |
| Calculation Method | RB3LYP | RB3LYP | RB3LYP | RB3LYP | RB3LYP |
| Basis Set | Gen | Gen | Gen | Gen | Gen |
| Charge | 0 | 0 | 0 | 0 | 0 |
| Spin | Singlet | Singlet | Singlet | Singlet | Singlet |
| E(RB3LYP) / a.u. | -2352.4162785 | -2352.4163010 | -2352.41110734 | -2352.4063255 | -2352.4163437 |
| RMS Gradient Norm / a.u. | 0.00000019 | 0.00000063 | 0.00000487 | 0.00000005 | 0.00000024 |
| D-Space Link | DOI:10042/31352 | DOI:10042/31353 | DOI:10042/31354 | DOI:10042/31355 | DOI:10042/31356 |
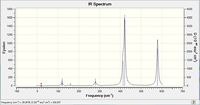
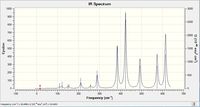
| IR spectra | 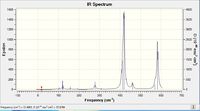 |
 |
 |
 |
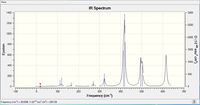 |
Why do some spectra have more bands than others?
Firstly, the selection rules for IR spectroscopy must be defined. In order for a vibrational mode to be IR active, the vibrational excitation of the molecule must result in a change in dipole moment. If the molecules dipole remains unchanged, the mode will be IR inactive ( although it may be seen via Raman spectroscopy). This definition of what makes an IR mode active, will aid the discussion of why some spectra have more bands than others.
As above, an IR mode must result in a change of dipole moment, and this change in dipole can naturally occur along any of the Cartesian axes. With this definition, analyzing the point groups of the respective isomers should begin to help the interpretation of the IR spectrum.
| Isomer' | Point group |
|---|---|
| Isomer 1 | C2v |
| Isomer 2 | C2h |
| Isomer 3 | C1 |
| Isomer 4 | D2h |
| Isomer 5 | C2v |
As can be seen from the above table, Isomer 3 has the lowest level of symmetry of any of the isomers. Intuitively, it can be predicted that Isomer 3 should therefore give the greatest number of IR active bands across all of the isomers. The reasoning behind this, is that both asymmetrical and symmetrical stretches in Isomer 3 are IR active due to the inherent lack of symmetry within the molecule. This generalization assumes that in any one vibrational mode all atoms within the molecule translate. As Isomer 3 has no mirror planes of symmetry, any translational motion from all atoms in the molecule cannot be displaced by equal motion elsewhere in the molecule, thus any vibrational modes where all atoms within the molecule translate must be IR active. This leads to a large number of IR active modes. It must of course be noted that many of these stretches have very low intensity in the IR. Although this molecule has very low symmetry, the atoms within the molecule are actually very similar. With very small translational motion the change in dipole moment across the molecule can be very small, and thus lead to a very low intensity within the IR. It could be expected that substituting the terminal Bromine and Chlorine atoms for atoms with less electronic similarities would lead to a greater change in dipole moment, and hence higher intensity vibrations within the IR.
In contrast to Isomer 3, Isomer 4 has a high level of symmetry. Isomer 4 has symmetry planes running through the xy, xz and yz axis and via invoking a similar argument used for Isomer 3 it can be predicted that the IR spectra will show a significantly reduced number of IR active modes when compared to Isomer 3. The justification of this prediction comes form assessing how vibrations on one side of the molecule can be exactly mirrored on the other, leading to no net dipole moment change.
Isomers 1,2 and 5 lead for an interesting IR comparison as they all share a very similar level of molecular symmetry. Isomers 1 and 5 actually share an identical point group, and as they both contain exactly the same number of atoms the IR spectra should contain exactly the same number of IR active modes ( although the positioning and intensity of these modes can differ greatly).
How does the position of the Bromine atom effect the IR spectra.
Bridging stretches
Although only isomers 3 and 4 contain a bridging bromine atom, all 5 isomers are analysed as to the effect of substituting bromine atoms for chlorine.
| Isomer' | Mode | IR | Intensity |
|---|---|---|---|
| Isomer 1 | 12 | 279 | 26 |
| Isomer 2 | 12 | 280 | 29 |
| Isomer 3 | 13 | 289 | 42 |
| Isomer 4 | 12 | 241 | 100 |
| Isomer 5 | 13 | 322.52 | 41 |
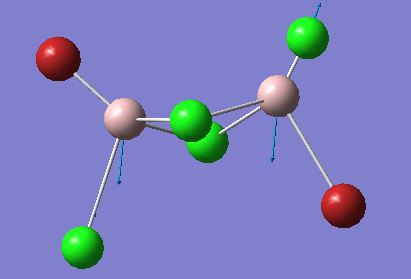
Representation of the stretch (from Isomer 4): 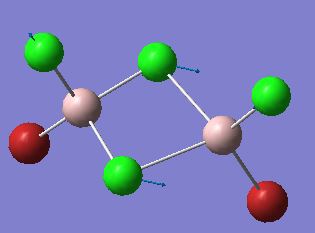
Discussion
The first point of interest from these comparable IR stretches is the high frequency of the stretch in isomer 5. To clarify, the stretch being assessed is one in which both terminal atoms move away from one aluminium towards another, with slight stretches from all terminal atoms. Discussed previously were the various factors effecting the stability of the dimer, and it was suggested that the overlap integral between the aluminium and bridging atom was the most important factor in determining stability. Invoking this argument, it is understandable how the most stable conformer produces the stretch with the highest IR frequency. A higher IR frequency represents a stronger bond, and hence it seems completely logically that the most stable isomer requires the most energy to invoke a stretch in the bridging halogens. Following a similar line of argument, Isomer 4 having a far lower stretching frequency is representative of the weaker bridging bonds present in this structure, the overall trend is suggestive that replacing bridging bromine atoms with chlorine atoms, moves the vibrational frequency to higher wavenumbers due to the formation of stronger bridging bonds. An apparent anomaly to the described trend would be Isomer 3, with the one bridging bromine atom, which would be expected to lie in between the two bridging bromine isomer atoms, and the 2 chlorine atoms. The result however, shows that in this isomer, the frequency is actually higher than some of the double chlorine bridging molecules. On analysis of the stretch, it appears there has been a qualitative change in the stretch present within the molecule. Although the stretch is similar, the bridging bromine appears to be having an anchor like effect on the bond, with the bridging chlorine seemingly being displaced further as a result. This extra displacement of the chlorine may help to explain the larger than expected frequency of the stretch. In terms of the intensity of all stretches discussed, all are IR active due to the no-symmetrical nature of the stretch, leading to a change in dipole moment.
Terminal Stretches
| Isomer' | Mode | IR | Intensity |
|---|---|---|---|
| Isomer 1 | 18 | 583 | 277 |
| Isomer 2 | 18 | 580 | 316 |
| Isomer 3 | 17+18 | 575 and 615 | 122 and 197 |
| Isomer 4 | 18 | 617 | 332 |
| Isomer 5 | 16+18 | 495+616 | 133 and 177 |
The first point to note on all terminal stretches is that all terminal stretches appear at much higher frequencies than the bridging stretches. The justification of this, is that all terminal bonds are 2c-2e, whereas the bridging bonds are formally described as 3c-2e. This change in electron density between the bridging and terminal halogen bonds leads to the bonds from the Al- terminal halogens being convincingly stronger than the bridging bonds, and this difference manifests itself in the IR stretching frequencies. The particular stretch being discussed here involves the coordinated movement of the two aluminium atoms up and down, compressing and elongating the terminal aluminium to halide bonds. In isomers where 2 modes are listed, the co-ordinated movement of the aluminium atoms does not exist. Rather, one aluminium atom moves up and down in one mode, with the other aluminium remaining stationery, and vice versa with the second listed mode. Wherever two modes are listed, the terminal bromine atom always forms the lower frequency mode. The justification for this has been presented numerous times previously, and is suggested to be based around a decreased orbital overlap between the aluminium and bromine compared to the aluminium and chlorine. The IR data presented broadly fits the trends that have been discussed throughout this project. In Isomer 5 where two terminal bromine atoms are stretching the frequency of the stretch is at its lowest. As we move from two bromines to one chlorine one bromine, this frequency increases due to the increased strength of the Al-Cl bond as opposed to the Al-Br bond. The isomers which contain this arrangement of atoms ( ie one Br one Cl in terminal positions) have almost identical frequencies, indicating an extremely similar nature of stretch. This similarity between stretches across isomers is also mirrored in the isomers containing two terminal chlorine atoms, with these frequencies (615,616 and 617) being almost identical. Perhaps the key point to take away from this IR data is that the stretching frequencies across the isomers are so similar. Regardless of the isomer, Al-Cl and Al-Br terminal stretches appear at very similar frequencies, far more so than for the bridging stretches. This result is indicative that the arrangement of the terminal atoms is perhaps not as crucial as the arrangement of the bridging atoms in determining the overall energy of the structure, with this perhaps being a topic for further study.
Molecular Orbital Analysis
Occupied molecular orbital calculations were generated from the formatted checkpoint file, with the resultant orbitals analysed for their overall bonding character. Through examining the shape of the MO's, it is also hoped that reasonable predictions can be made as to the contributing atomic orbitals to the MO. A molecular orbital calculation was only carried out on the lowest energy isomer ( Isomer 5), with five orbitals selected, ranging from bonding to anti bonding. The character and make up of these molecular orbitals is discussed below:
Calculation folder can be found here: DOI:10042/31368
Orbital analysis 1: MO 37
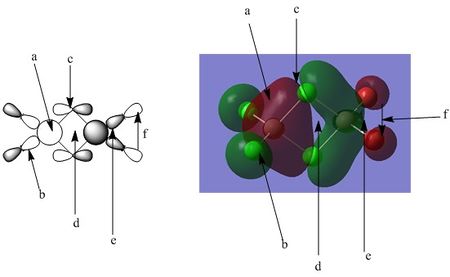
The diagram above shows 2 interpretations of the MO. The left hand side shows the likely orbital contributors, with the right hand side showing the MO produced from the Gaussian calculation.
Points of interest:
Point A:Point A shows the large orbital on the left hand side (coloured red in the Gaussian representation). As can be seen, this part of the MO is composed of a single phase, with no nodal planes. This shape of molecular orbital would reasonably be generated from the interaction from the 3s aluminium orbital, with strong in phase interactions with the surrounding 3p orbitals from the chlorine atoms. The nodal planes through the centre of the chlorine atoms can be easily visualised, with the phase change from red to green at the centre of each atom representing the nodal plane between the two phases of the p orbital. In this section of the MO, the electron distribution can be seen to be reasonably evenly distributed between the 5 contributing atoms ( the central Al and 4 surrounding chlorine atoms). A possible explanation for this is a balance between the high electronegativity of the chlorine atom and the highly polarizing nature of the central Al, leading to a roughly equal distribution of electron density in this part of the MO.
Point B:Point B simply points out the nodal plane running through the centre of the terminal Cl. This is the node of the p orbital, and can be seen to be present in all 4 of the terminal halogen atoms.
Point C: Point C refers to the nodal plane running through the centre of the bridging chlorine. This part of the MO is also interesting due to the skewed nature of the p orbital. It appears the contribution from the bridging chlorines is somewhat shifted towards the side of the molecule containing two terminal chlorines (the left side as pictured). A possible explanation for this is the aluminium on the left hand side of the molecule is more electron deficient than the one on the right, due to the difference in the elctronegativity of the terminal halides. Chlorine is more electronegative than bromine, and hence holds on to its electron cloud more strongly. This in turn creates a more deficient central aluminium atom. The skewing of the bridging chlorine creates a more efficient overlap between the chlorine 3p and the aluminium 3s, and hence would aid in the stabilisation of the electron deficient central atom. An alternative view point is that the bridging chlorines skew allows the anti bonding, out of phase interaction between the large red and green parts of the MO to move away from each other, lowering the unfavourable interactions of the out of phase orbitals.
Point D: Point D notes the out of phase interactions at the centre of the molecule between the large red and green parts of the MO. The bending of the green part away from the red is likely to be a result of trying to minimize this interaction, and the possible reasoning behind this is discussed above.
Point E: Point E shows the large green MO on the right hand side of the molecule. The AO's that build up this MO are very similar in nature to point A, however of interest is the slightly different shape of this part of the MO. The electron cloud is more polarized towards the aluminium, with little electron density surrounding the bromine. Bromine is more easily polarized than chlorine, and hence the aluminium on this side of the molecule can hold a greater share of the electron density.
Point F: Point F shows the weak in phase interaction between the p orbitals on the terminal bromine atoms, a similar interaction exists for the terminal chlorines on the left hand side.
Bonding character summary: This orbital is a overall bonding molecular orbital. Assessing the orbital from left to right:
-There is a weak through space interaction between the terminal chlorine atoms p orbitals ( coloured green in the Gaussian window) -There is a strong direct overlap between the aluminium 3s and chlorine 3p atoms ( on both the terminal and bridging chlorine atoms). This large degree of orbital overlap is of significant stabilisation. ( the large red cloud in the Gaussian window)
- A similarly strong overlap is created on the right hand side of the molecule from the aluminium 3s, bridging chlorine 3p and terminal aluminium 3p. This is once again an area of the MO with a strong degree of overlap, and hence significant stabilisation.
-There is an out phase interaction between the aluminium 3s orbitals through the centre of the molecule. This interaction is somewhat hard to classify. On first assessment it appears as though this region is highly anti bonding, but it must be remembered the p orbitals of the bridging chlorine atoms contain an inherent phase change, and this is not an out of phase interaction. Perhaps more easily explained by the atomic orbital contributions with the left hand diagram, the only out of phase interactions are the out of phase interactions between aluminium 3s orbitals. As these orbitals are primarily core like, these interactions can be seen to be minimal over this distance.
Orbital analysis 2: MO 39
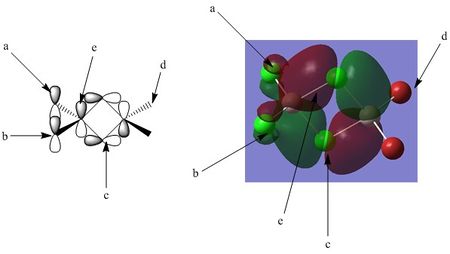
Point A: Point A shows the small degree of interaction between the terminal chlorine p orbital, and the larger bonding orbital that surround the central aluminium and bridging chlorine atoms. This part of the MO differs from the previously discussed MO (MO 37) in that there is no longer an even distribution of electron density between the terminal halogen atoms and the bridging halogen.
Point B: Point B once again notes the node through the p orbital of the terminal chlorine. This nodal plane runs across the entire molecule.
Point C: Point C represents the node at the centre of the bridging chlorine atoms, this is again a nodal plane, running through the centre of the molecule (in to the page as viewed).
Point D: Point D notes that in this molecular orbital, there is zero contribution from the terminal bromine atoms.
Point E:Point E notes the bonding interaction between the central aluminium, the terminal chlorine atoms, and the the bridging chlorine atoms. The overlap between the aluminium and the terminal atoms is far smaller, and there is only a small amount of electron density here. This can be justified by noting that the orbital overlap here has pi characteristics whereas the overlap between the aluminium and the bridging chlorine atoms has more sigma characteristics; ie the overlap is more end on, with higher directionality. This is perhaps more easily visualised by examining the potential atomic orbital contributors in the left hand image above.
Bonding character summary:
This orbital is a overall bonding molecular orbital. Assessing the orbital from left to right:
- There is a relatively weak interaction between the terminal chlorine atoms and the central aluminium. This interaction is a non direct overlap and is more pi like in character.
-There is a stronger bonding interaction between the aluminium and bridging chlorine atoms, as mentioned, this bond is more directional, and hence has a stronger bonding character. This bonding orbital is present on both sides of the molecule
-There is a moderate out of phase interaction between the two large electron clouds across the molecule. This interaction is only described as moderate due to the non direct overlap, again considering this interaction to be more pi like in nature, and not involving any along bond interactions.
-This MO can be considered weakly bonding overall.
Orbital analysis 3: MO
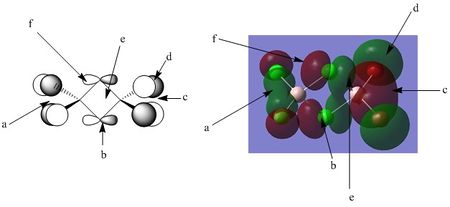
Points of interest:
Point A: Point A notes the green electron density cloud between the two terminal chlorine atoms of the molecule. The overlap is a strong interaction due to the sigma type of interaction occurring. Also of note is how the aluminium seemingly has no atomic orbital contribution to this part of the MO. Contribution from a 3s orbital would encompass the aluminium atom with electron density, interaction with a 3p orbital would give the distinctive phase pattern discussed previously with the MO analysis. As neither are present, it is reasonable to postulate no direct contribution from the aluminium in this MO.
Point B: Point B notes the distinctive node at the centre of the p orbital of the bridging chlorine atoms.
Point C: Point C notes an orbital very similar in form to point A. Of particular note however is the increased diffuseness of the electron cloud, both around the terminal bromine atoms, and around the central aluminium. As discussed previously, bromine is more easily polarizable than chlorine. Hence, although the aluminium makes no direct contribution to this part of the MO, its highly polarizing nature contributes to forming a more diffuse region of the molecular orbital.
Point D: Point D notes that the surrounding electron density from the terminal bromine p orbital is far more diffuse than the chlorine. This aids in the discussion of point C as above.
Point E: Point E notes the bonding region across the centre of the MO through the bridging chlorine atoms. Of particular note here is the non-symmetrical nature of the electron cloud.
Overall bonding character
From left to right: -There is a moderately strong bonding interaction on the left hand side of the MO between the terminal chlorine atoms. This sigma like overlap is highly directional, but also over a moderately long distance.
-There is a moderate bonding interaction between the two bridging chlorine atoms, through a pi like interaction. This interaction can be expected to be slightly weaker than the green electron cloud at point A, due to the decreased overlap.
- There are small bonding and anti bonding contributions from the electron clouds around the two bridging chlorine atoms. Taking the top bridging chlorine as an example, there are: 1) Weak through space bonding interactions between the red phase of the p orbital, and the red phase of the terminal chlorine atoms (on the left hand side) 2) Slightly stronger (but still relatively weak) antibonding contributions from the red phase of the orbital with the bonding green orbital at point A. This interaction is slightly stronger than the interaction described in 1 due to the decreased distance of the interaction. These interactions are essentially mirrored on the right hand side of the molecule.
Orbital analysis 4: MO 46
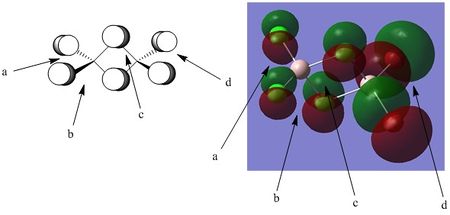
Points of interest:
Point A: Point A shows the out of phase interaction between the two terminal chlorine atoms, interacting via their p orbitals, as easily distinguished via the distinctive nodal plane through the centre of the atoms. The electron clouds surrounding the atoms are being drawn towards the aluminium centre due to its highly polarizing nature, although there is no direct AO contribution from the aluminium centre itself.
Point B: Point B represents the weak through space bonding interaction between the terminal and bridging chlorine atoms. This interaction is very weak. Although as shown it may appear as though the phases line up in a pi like fashion, they are actually skewed off to one side of one another. This makes the directional overlap very weak, and hence minimises the interaction.
Point C: Point C represents the pi like interaction between the bridging chlorines. This interaction is far more directional than the interaction at point B, and hence is likely stronger.
Point D: Point D notes a very similar interaction to point A. In this part of the MO however, the electron cloud is far more diffuse, likely due to the lowered electronegativity of bromine (as compared to chlorine), alongside the highly polarizing nature of the aluminium. Again, this is an out of phase interaction and is unfavourable. There are again weak through space interactions between the terminal bromine atoms, and bridging chlorines. As previously mentioned, the skewed nature of this overlap, along with the long distance make this stabilisation very weak.
Overall bonding character: Overall this is an antibonding MO. The main contributions to the MO take the form of out of phase interactions. Although in phase interactions exist they are weak through space interactions with low directionality, and hence cannot overcome the effects of the large out of phase interactions that meet at each aluminium atom.
Orbital analysis 5: MO 49
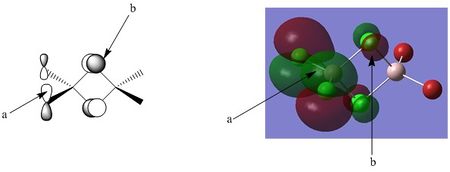
Points of interest:
Point A: Point A shows the out of phase interaction between the p orbitals of the chlorine atoms. This is a pi like interaction and is highly localised on the individual chlorine atoms. A simple rationalisation of this is considering the unfavourable interaction, it is energetically favourable to keep theses out of phase parts of the MO at maximum distance. The central aluminium atom does not contribute, and this part of the MO is purely antibonding
Point B: Point B notes the out of phase, through space interaction between the p orbitals of the bridging chlorine atoms. Once again, these phases are highly localised on the atoms, in an attempt to generate the maximum possible distance between energetically unfavourable interactions.
Overall bonding character: This orbital is entirely anti bonding, with no obvious bonding interactions present at all, both points A and B describe the separate out of phase p orbital interactions between the respective chlorine atoms, but also of note are the weaker through space interactions that occur between points A and B, further raising the energy of the MO.
Conclusion
Overall this project has explored the molecular effects of substituting atoms in terminal and bridging positions in a dimer complex. It has been shown that small changes in atomic position and nature can have moderate energetic effects on the overall molecule. Furthermore, the project has aimed to demonstrate the different structural effects that result in stabilization of electron deficient group three molecules, moving from pi related stabilisation for boron, to dimer related stabilisation for aluminium containing compounds. A suggestion for further work would include using Iodine substituents in an attempt to further understand the dominant factor in determining the stability of the isomers, or alternatively to use bridging atoms with less electronic similarities to the halogens.
Appendix
| Calculation performed | Raw convergence/ Low frequency data |
|---|---|
| Isomer 1 Optimisation | Item Value Threshold Converged?
Maximum Force 0.000000 0.000015 YES
RMS Force 0.000000 0.000010 YES
Maximum Displacement 0.000003 0.000060 YES
RMS Displacement 0.000001 0.000040 YES
Predicted change in Energy=-1.134013D-12
Optimization completed.
-- Stationary point found.
|
| Isomer 2 Optimisation | Item Value Threshold Converged?
Maximum Force 0.000001 0.000015 YES
RMS Force 0.000000 0.000010 YES
Maximum Displacement 0.000027 0.000060 YES
RMS Displacement 0.000011 0.000040 YES
Predicted change in Energy=-4.461686D-11
Optimization completed.
-- Stationary point found.
|
| Isomer 3 Optimisation | Item Value Threshold Converged?
Maximum Force 0.000008 0.000015 YES
RMS Force 0.000003 0.000010 YES
Maximum Displacement 0.000047 0.000060 YES
RMS Displacement 0.000014 0.000040 YES
Predicted change in Energy=-1.132409D-10
Optimization completed.
-- Stationary point found.
|
| Isomer 4 Optimisation | Item Value Threshold Converged?
Maximum Force 0.000000 0.000015 YES
RMS Force 0.000000 0.000010 YES
Maximum Displacement 0.000005 0.000060 YES
RMS Displacement 0.000002 0.000040 YES
Predicted change in Energy=-1.116310D-12
Optimization completed.
-- Stationary point found.
|
| Isomer 5 Optimisation | Item Value Threshold Converged?
Maximum Force 0.000001 0.000015 YES
RMS Force 0.000000 0.000010 YES
Maximum Displacement 0.000014 0.000060 YES
RMS Displacement 0.000005 0.000040 YES
Predicted change in Energy=-1.067804D-11
Optimization completed.
-- Stationary point found.
|
| AlCl2Br monomer optimisation | Item Value Threshold Converged?
Maximum Force 0.000000 0.000015 YES
RMS Force 0.000000 0.000010 YES
Maximum Displacement 0.000000 0.000060 YES
RMS Displacement 0.000000 0.000040 YES
Predicted change in Energy=-2.235015D-16
Optimization completed.
-- Stationary point found.
|
| BCl3 optimisation | Item Value Threshold Converged?
Maximum Force 0.000000 0.000015 YES
RMS Force 0.000000 0.000010 YES
Maximum Displacement 0.000000 0.000060 YES
RMS Displacement 0.000000 0.000040 YES
Predicted change in Energy=-1.543206D-14
Optimization completed.
-- Stationary point found.
|
| B2Cl6 optimisation | Item Value Threshold Converged?
Maximum Force 0.000076 0.000450 YES
RMS Force 0.000031 0.000300 YES
Maximum Displacement 0.000732 0.001800 YES
RMS Displacement 0.000303 0.001200 YES
Predicted change in Energy=-8.481200D-08
Optimization completed.
-- Stationary point found.
|
| BCl3 low frequency data | Low frequencies --- -5.8096 -4.7929 -4.7929 -0.0038 0.0019 0.0954 Low frequencies --- 259.8207 259.8222 453.0333 |
| B2Cl6 low frequency data | Low frequencies --- -1.8549 -0.0077 -0.0063 -0.0061 3.8630 4.7283 Low frequencies --- 20.0476 86.2461 113.0186 |
| Isomer 1 low frequency data | Low frequencies --- -1.3345 -0.7628 -0.0016 -0.0012 0.0023 2.2141 Low frequencies --- 17.4965 51.1454 78.5264 |
| Isomer 2 low frequency data | Low frequencies --- -0.7583 -0.7153 -0.0049 -0.0041 -0.0035 2.1623 Low frequencies --- 18.3078 49.2151 72.9029 |
| Isomer 3 low frequency data | Low frequencies --- -0.1639 -0.0018 0.0020 0.0022 1.1084 1.8102 Low frequencies --- 16.9466 55.9204 80.0643 |
| Isomer 4 low frequency data | Low frequencies --- -0.8417 -0.0045 -0.0038 -0.0034 1.3019 1.3756 Low frequencies --- 16.0716 63.6244 86.1127 |
| Isomer 5 low frequency data | Low frequencies --- -0.7767 -0.5774 0.0015 0.0031 0.0041 2.0650 Low frequencies --- 18.6308 51.2103 72.2012 |

