User:Wd812
The Cope Rearrangement of 1,5-hexadiene
The cope rearrangement is a thermal isomerization process involving the [3,3]-sigmatropic rearrangement of 1,5-dienes (Figure 1). In spite of the fact that this is a pericyclic reaction, it can also be considered as 'going via a transition state'. A great deal of effort has been put into the relative experimental and computational studies, and nowadays it has been widely accepted that the transition state of this reaction involves either a 'boat' or a 'chair' structure with the 'chair' conformation a few kilojoules lower in energy. In this exercise Gaussian calculation is used to determine the transition-state structures and their corresponding relative potential energies on the potential energy surface of the molecule 1,5-hexadiene. Once the transition structure(TS) on a potential energy surface (PES)is identified, the preferred reaction pathway is then revealed.

Optimizing the Reacants and Products
Optimisation using HF3-21G basis set
|
|
|
| ||||||||||||
| File:Hexadiene (anti1).mol | File:Hexadiene(gauche2).mol | File:Hexadiene(gauche3).mol | File:Hexadiene(anti2).mol |
- Anti1
| Method | Optimisation: to a minimum |
| Calculation Type | FOPT |
| Calculation Method | RHF |
| Basis Set | HF/3-21G |
| Total Energy | -231.69260220 a.u. |
| Charge | 0 |
| RMS Gradient Norm | 0.00004706 a.u. |
| Point Group | C2 |
         Item               Value     Threshold  Converged?
 Maximum Force            0.000120     0.000450     YES
 RMS     Force            0.000024     0.000300     YES
 Maximum Displacement     0.001356     0.001800     YES
 RMS     Displacement     0.000425     0.001200     YES
 Predicted change in Energy=-1.688996D-07
 Optimization completed.
    -- Stationary point found.
An'anti'linkage conformer (Table 1. a)) of 1,5-hexadiene molecule is drawn above. The potential energy of this conformer was calculated using default basis set HF/3-21G. According to Appendix 1 the identity of this molecule is 'Anti1' .
Since the first derivative of a potential energy function is force, a gradient of 0 within the threshold means that there is no force acting on the molecule, and the molecule is at a stationary minimum point.
- Anti2
| Method | Optimisation: to a minimum |
| Calculation Type | FOPT |
| Calculation Method | RHF |
| Basis Set | HF/3-21G |
| Total Energy | -231.69253529 a.u. |
| Charge | 0 |
| RMS Gradient Norm | 0.00001312 a.u. |
| Point Group | Ci |
         Item               Value     Threshold  Converged?
 Maximum Force            0.000043     0.000450     YES
 RMS     Force            0.000007     0.000300     YES
 Maximum Displacement     0.001492     0.001800     YES
 RMS     Displacement     0.000336     0.001200     YES
 Predicted change in Energy=-1.210933D-08
 Optimization completed.
    -- Stationary point found.
- Gauche2
| Method | Optimisation: to a minimum |
| Calculation Type | FOPT |
| Calculation Method | RHF |
| Basis Set | HF/3-21G |
| Total Energy | -231.69166702 a.u. |
| Charge | 0 |
| RMS Gradient Norm | 0.00000547 a.u. |
| Point Group | C2 |
         Item               Value     Threshold  Converged?
 Maximum Force            0.000012     0.000450     YES
 RMS     Force            0.000004     0.000300     YES
 Maximum Displacement     0.000476     0.001800     YES
 RMS     Displacement     0.000122     0.001200     YES
 Predicted change in Energy=-5.759908D-09
 Optimization completed.
    -- Stationary point found.
Another conformer with 'gauche linkage' is shown in Table 1. c). This structure is predicted to be higher in energy compared to the previous 'anti1' structure.
- Gauche3
| Method | Optimisation : to a minimum |
| Calculation Type | FOPT |
| Calculation Method | RHF |
| Basis Set | HF/3-21G |
| Total Energy | -231.69266122 a.u. |
| Charge | 0 |
| RMS Gradient Norm | 0.00000753 a.u. |
| Point Group | C1 |
         Item               Value     Threshold  Converged?
 Maximum Force            0.000024     0.000450     YES
 RMS     Force            0.000005     0.000300     YES
 Maximum Displacement     0.000940     0.001800     YES
 RMS     Displacement     0.000324     0.001200     YES
 Predicted change in Energy=-9.293580D-09
 Optimization completed.
    -- Stationary point found.
By testing out with a few structures using HF/3-21G calculation method, the structure with the lowest energy was found. See Table 1. d). The structure is identified as 'gauche 3' according to Appendix 1.
Optimize 'anti2' molecule at B3LYP/6-31G* level
In the next step the 'anti2' structure was reoptimized at a higher level using the B3LYP/6-31G* basis set.The corresponding energy after this optimization is -234.55970434 a.u., compared to the value of -231.69253529 a.u., calculated form the HF/3-21G basis set, it apparently has a lower value. The 6-31G* basis set contains more modelling factors,and is considered as a more efficient and accurate way of calculation [1]. The outcomes of these two basis sets are compared in below table 2.
 |
 | ||||||
| a)HF/3-21G | b)B3LYP/6-31G* | c)Bond angle at HF/3-21G level | d)Bond angle at B3LYP/6-31G* level |
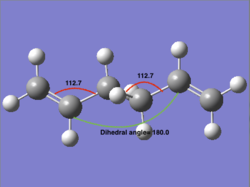
By careful inspection of the optimized structures, we can see that from the HF/6-31G optimisation result, the two red-labelled angles aren't exactly the same (124.8° and 111.3° respectively); while at higher level of optimisation, these two angles become the same (both 112.7°), which means a better result has obtained.
Energy calculation and Stability Discussion
All the rest structures in Table 1. were then reoptimised at the B3LYP/6-31G* level to allow comparison between the computed energies and the experimental results. Notice that the reoptimization input are the original structures, rather than the HF/3-21G optimised structures.
| Structure | Energy HF/3-21G (Ha) | Relative Energy*(kcal/mol) | Energy 6-31G* (Ha) | Relative Energy (kJ/mol) | Sum of electronic and zero-point Energies (Ha) | Sum of electronic and thermal Energies (Ha) | Sum of electronic and thermal Enthalpies (Ha) | Sum of electronic and thermal Free Energies (Ha) | Point Group |
|---|---|---|---|---|---|---|---|---|---|
| Anti1 | -231.69260220 | 0.03704 | -234.61179050 | -0.28938 | -234.458507 | -234.452736 | -234.451792 | -234.488087 | C2 |
| Anti2 | -231.69253529 | 0.07902 | -234.61171024 | -0.23902 | -234.469203 | -234.461858 | -234.460913 | -234.500772 | Ci |
| Gauche2 | -231.69166702 | 0.62387 | -234.61068500 | 0.40433 | -234.468284 | -234.460967 | -234.460023 | -234.500014 | C2 |
| Gauche3 | -231.69266122 | 0.00000 | -234.61132934 | 0.00000 | -234.468693 | -234.461464 | -234.460520 | -234.500105 | C1 |
| Types of energies | Expression of this energy |
|---|---|
| The sum of electronic and zero-point energies | E=Eelec+ZPE |
| The sum of the electronic and thermal energies | E = E + Evib + Erot + Etrans |
| The sum of electronic and thermal enthalpies | RT (H = E + RT) |
| The sum of electronic and thermal free energies | G = H - TS |
Although of each of the structure the geometries obtained from the two optimising methods are very similar, they are possessing different energies. Form Table 3, we can see that the structure with lowest energy optimised by HF/3-21G is 'gauche3', however, once we optimise these structures at higher level (B3LYP/6-31G*), it seems that 'anti1' structure has the lowest energy.
To rationalise these computational results, we have to consider factors affecting the stability of the 'gauche' and 'anti' structures. The main factors are three:
Factor1: Orbital overlap and bond orientation;
Factor2: Pauli repulsion or steric effect;
Factor3: van der Waals (dispersion) forces.
For the 'anti' structure, the πC=C/σ*C-H and the σC-H/π*C=C orbitals overlap better than that of the 'gauche' structure. Also, for the anti structures, the steric effect caused by the bulky vinyl groups also favours the 'anti' structure. Whether the H...H interaction caused by factor 3 favours 'anti' or 'gauche' remains controversial. But overall the 'anti' structure should be the favourable one.
For HF/3-21G method, the results show that 'gauche 3' is favoured over the two 'anti' structures, which is contradictory to or prediction. This is probably due to the fact that the HF/3-21G doesn't take the effect caused by change of electron density into account. At higher level of optimisation, an correlation term was included for more accurate optimisation. Thus at the B3LYP/6-31G* level, the 'anti' structures have lower energy than the 'gauche' ones. In fact, in more detail, the 'anti1' structure has lower energy than the 'anti2' structure. This is due to the fact that the two vinyl groups in the 'anti1' structure are 'staggered', whereas in 'anti2' they are 'eclipsed'. Since the staggered forms are more stabled ones, 'anti1' is more preferred over 'anti2'.
Frequency and IR check
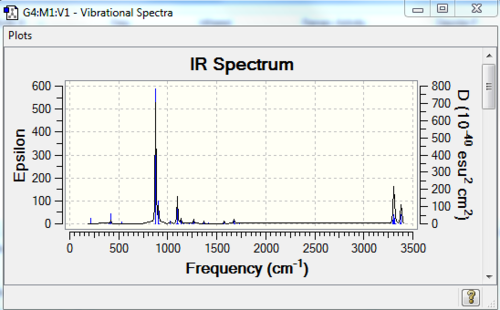
A frequency calculation of the molecules was carried out as well. The log file of the frequency calculation can be found here: File:631ANTI2FCQ.LOG. And the IR spectrum is shown below in Figure 5 .
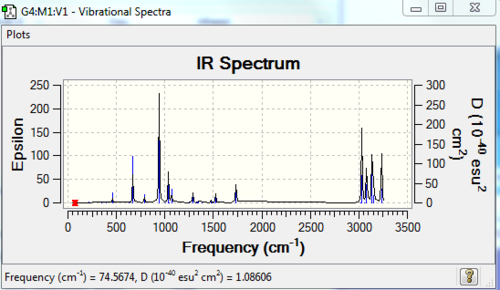
From the list of frequencies generated by the log. file, we can see that there is no imaginary frequency(all positive numbers).
Frequency is closely related to the second derivative of the potential energy function. If for a known stationary (minimum) point, the frequency calculation shows one and only one negative value (implying a negative force constant) then this point can be considered as the transition state of the reaction, since the negative value implies that the point is a maximum in one direction but minimum in all the other orthogonal directions. [2]. Remember these are all based on the fact that a transition state is defined as the highest point on a lowest energy pathway on the potential energy surface.
Therefore based on the above discussion, our 'anti2' is not determined as a transition state structure.
Optimising the "Chair" and "Boat" Transition Structures
The transition state structures (TS) of the cope rearrangement can be built up by three means of ways: i) OPT=TS: the input/starting point is a reasonable guess of the TS. In this method the Hassian Matrix (also the force constant matrix)is computed at the first step. Form the Hassien Matrix we can find the second derivative of the potential energy surface. Therefore the TS coordinate can be deduced and the exact TS can be found. ii) OPT=ModRedundant: The second method involves freezing the reaction coordinate. iii) OPT=QST2: The input is the reactants and the products. The reaction coordinates are then defined accordingly. The maxima on the reaction pathway is then assigned to the TS. In this experiment the proposed transition states are the 'chair' and 'boat' conformations. The way to confirm whether these TS are the 'desired' ones or not is to use the so-called Intrinsic Reaction Coordinate (IRC) method. This is carried out in the last part of this section.
The "Chair" Transition Structrue
An allyl fragment(CH2CHCH2) was drawn and optimised using the HF/3-21G basis set. The fragment was then duplicated, shifted and rotated to make the 'chair transition state' simulation. In addition, from experience, many C-C bond distance during the bond forming reaction is between 2.1Å to 2.3Å. Thus an approximation of the transition state structure of bond length of 2.2Å is reasonable.
- opt=ts
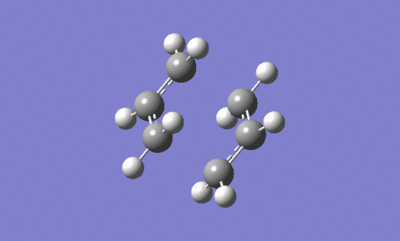
Firstly, by using the 'OPT=TS' method, the chair TS was optimised on the HF/3-21G basis set. The bond length of the C-C bond forming/breaking distance is adjusted to ~2.2 Å. The frequency calculation is carried out and there is one and only one characteristic imaginary frequency at -817.97 cm-1 (Table 3). This imaginary frequency represents the transition state structure, as reasons explained above. The symmetry point group of this transition structure is C2h. The .log file of the molecule can be found here. File:B)OPT=TSFREQUENCY.LOG
Sum of electronic and zero-point Energies=           -231.466703
Sum of electronic and thermal Energies=              -231.461344
Sum of electronic and thermal Enthalpies=            -231.460399
Sum of electronic and thermal Free Energies=         -231.495209
         Item               Value     Threshold  Converged?
 Maximum Force            0.000076     0.000450     YES
 RMS     Force            0.000016     0.000300     YES
 Maximum Displacement     0.001350     0.001800     YES
 RMS     Displacement     0.000314     0.001200     YES
 Predicted change in Energy=-1.332178D-07
 Optimization completed.
    -- Stationary point found
 |
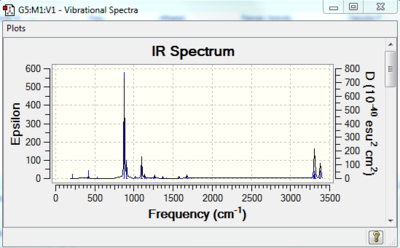 |
| a)opt=ts: animation | b)IR spectrum of the optimised trasintion structure |
- opt=modredundant
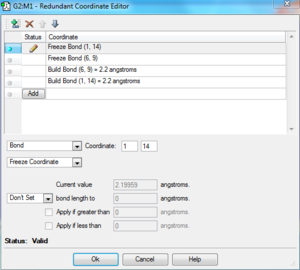
Secondly, we use the 'freeze coordinate' method to optimise the TS. The modredundant editor was set in such a way that the 'coordinate distance=2.20 Å', the 'bond freeze' options were added in separate input columns. (Settings: see Table 4a)). As a result, the optimised transition state has a confined C-C bond length of 2.20 Å. This TS was further optimised. This time for the bond forming/breaking C-C bond length, in the redundant coordinate editor, the option of 'bond' and 'derivative' options were selected. The structure was then optimised at the HF/3-21G level. We choose to optimise the transition state ('TS Berny') without calculating the force constant. The stationary point was found and this point was further confirmed to be the TS by checking the imaginary frequency(one and one only) and the IR spectrum (Figure 6).
Sum of electronic and zero-point Energies=           -231.466690
Sum of electronic and thermal Energies=              -231.461333
Sum of electronic and thermal Enthalpies=            -231.460388
Sum of electronic and thermal Free Energies=         -231.495194
    Item               Value     Threshold  Converged?
 Maximum Force            0.000073     0.000450     YES
 RMS     Force            0.000020     0.000300     YES
 Maximum Displacement     0.001315     0.001800     YES
 RMS     Displacement     0.000336     0.001200     YES
 Predicted change in Energy=-1.569817D-07
 Optimization completed.
    -- Stationary point found.
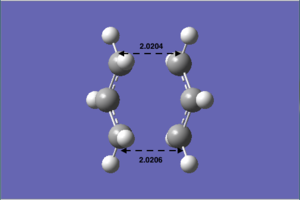
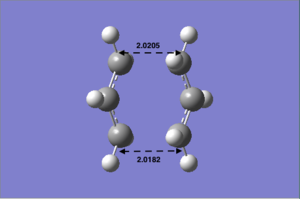
The transition state structure optimised (Table 4b)) looks similar to the above 'opt=ts' method, but the bond forming/breaking C-C bond lengths are different. The bond distance of 'opt=ts' is 2.02040 and 2.02060respectively; for the 'opt=modredundant' optimisation, the bond length are0.02050 and 2.0182. Form these results, we can conclude that the 'opt=ts' is probably the better optimisation method. Since the difference between the C-C bond lengths is smaller.
 |
|||
| a)Freeze coordinate settings | b)Optimized: TS animation | ||
 |
 | ||
| c) Optimised result using opt=ts | d) Optimised result using opt=modredundant |
The "Boat" transition structure
- Opt=QST2
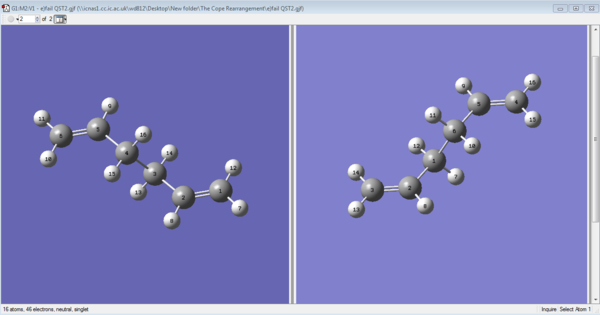
The 'Boat' transition state structure is optimized using the QST2 optimizing method.It was the TS(Berny) option used for optimization in OPT+Freq job type. The optimized anti2 structure was copied, pasted, and edited in the 'reactant' from and 'product' from under the same edit window. The reactant and the product are then labelled and renumbered so that the each atom is matched in the reactant and product structure. SeeFigure 5a) below. The QST2 optimization is then ran and completed. But an awkward TS appeared in the output file. See Table 5b). This is due to a fault that comes from the QST2 method itself. It did not put the consideration of the possibility of rotating around the bond in the centre.
 |
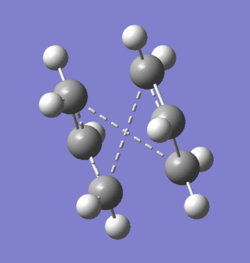 |
| a) Numbering the reactant and product | b) The failed optimisation |
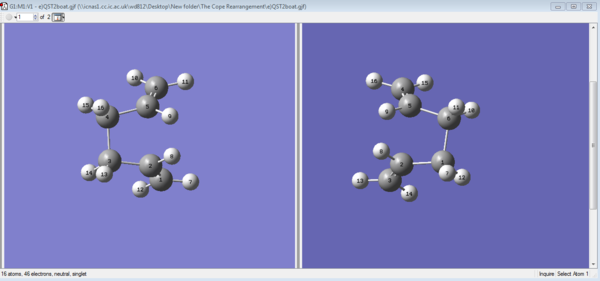
The original structure was adjusted so that the the reactant and the product are in their correct orientation. The dihedral angle between C2-C3-C4-C5 was adjusted to 0°; the C2-C3-C4 and C3-C4-C5 angle was adjusted to 100°. See Figure 7a). This time the Opt=QST2 ran successfully. The boat transition was covered and the following frequency check shows that there is one and only one negative force constant of this TS. the transition state motion is visualised(Figure 7b)). The opt+Freq check can be found here: File:E)QST2ORIENTATED.LOG
       Item               Value     Threshold  Converged?
Maximum Force            0.000152     0.000450     YES
RMS     Force            0.000053     0.000300     YES
Maximum Displacement     0.001667     0.001800     YES
RMS     Displacement     0.000456     0.001200     YES
Predicted change in Energy=-4.620781D-07
Optimization completed.
   -- Stationary point found.
Sum of electronic and zero-point Energies=           -231.450929
Sum of electronic and thermal Energies=              -231.445301
Sum of electronic and thermal Enthalpies=            -231.444357
Sum of electronic and thermal Free Energies=         -231.479773
 |
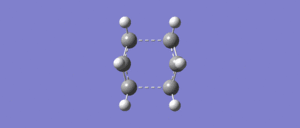 |
| a)renumbering the reactant and product | b) The optimised outcome |
By checking the frequency result, the
IRC check and reaction path
The Intrinsic Reaction Coordinate (IRC) is a way of confirming TS geometry.An IRC path is calculated as the coordinate with the steepest gradient on the potential energy surface. Once a possible transition state structure is found, we can follow the ICR to check if this is indeed the desired TS.
The .log file of the calculation can be found here: File:F)IRC50.LOG. The reaction path is shown below in Figure 7.

To get a better result: i)The last point on the IRC was ran a normal minimisation. ii) The IRC was ran again using a larger number of calculation of 150. iii) The IRC was redone by specifying 'computing force constant at every step'. The third method donsn't give an out come. And the reoptimised results don't show much differences. The resulting IRC files can be seen here: File:F)I)STEP44MINIMIZATOIN.LOG; File:F)II)IRC150.LOG
Energy and geometry comparison
Diels Alder reaction study
By applying what have been learnt from the above sessions, a Diels Alder reaction case study was carried out. This time some analysis of the molecular orbital (MO) of the transition were also added.
Reactant Cis-butadiene Optimisation
Optimisation using AM1 semi-empirical molecular orbital method
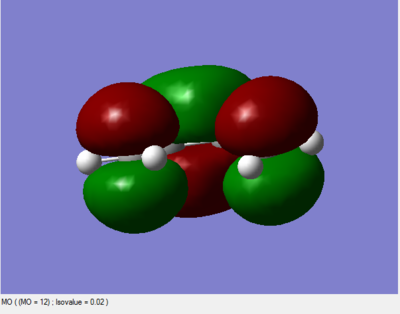
A cis-butadiene molecule was built up and optimised using Gaussian using the 'AM1 semi-empirical molecular orbit method'. The MO diagrams of the HOMO and LUMO orbitals were plotted and their corresponding symmetry is labelled in the diagrams. The .log file of the result can be found here: File:I)OPT2.LOG
| Method | Optimisation: to a minimum |
| Calculation Type | FOPT |
| Calculation Method | RAM1 |
| Basis Set | ZDO |
| Total Energy | 0.04878543 a.u. |
| Charge | 0 |
| RMS Gradient Norm | 0.00000155 a.u. |
| Point Group | C2V |
        Item               Value     Threshold  Converged?
Maximum Force            0.000004     0.000450     YES
RMS     Force            0.000001     0.000300     YES
Maximum Displacement     0.000268     0.001800     YES
RMS     Displacement     0.000089     0.001200     YES
Predicted change in Energy=-1.982453D-10
Optimization completed.
   -- Stationary point found.
HOMO and LUMO orbital
 |
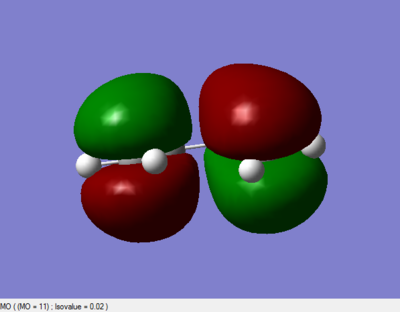 |
The LUMO is symmetric with respect to plane; the HOMO is asymmetric with respct to plane.
Optimisation at B3LYP/6-31G* level
The structure was reoptimized at the B3LYP/6-31G*. The .log file of the result can be found here: File:I)631.LOG
        Item               Value     Threshold  Converged?
Maximum Force            0.000040     0.000450     YES
RMS     Force            0.000014     0.000300     YES
Maximum Displacement     0.001110     0.001800     YES
RMS     Displacement     0.000404     0.001200     YES
Predicted change in Energy=-1.873800D-08
Optimization completed.
   -- Stationary point found.
A frequency check confirmed that a transition state has been found. The MO diagrams are shown below:
 |
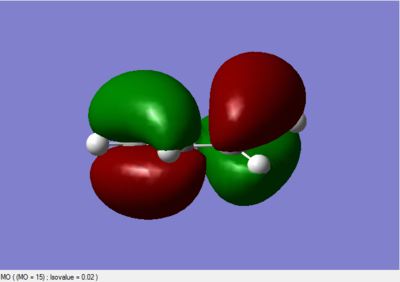 |
Again the LUMO is symmetric with respect to plane; the HOMO is asymmetric with respct to plane.
Reactant-Ethylene Optimisation
Optimisation using AM1 semi-empirical molecular orbital method
The optimised .log file can be found here: File:ETHYLENE1.LOG
| Method | Optimisation: to a minimum |
| Calculation Type | FOPT |
| Calculation Method | RAM1 |
| Basis Set | ZDO |
| Total Energy | 0.02619051 a.u. |
| Charge | 0 |
| RMS Gradient Norm | 0.00011710 a.u. |
| Point Group | D2h |
        Item               Value     Threshold  Converged?
Maximum Force            0.000210     0.000450     YES
RMS     Force            0.000099     0.000300     YES
Maximum Displacement     0.000721     0.001800     YES
RMS     Displacement     0.000418     0.001200     YES
Predicted change in Energy=-2.480913D-07
Optimization completed.
   -- Stationary point found.
Transition State Optimisation using AM1
The transition state of the reaction is obtained by combining two optimized reactant fragments. The optimized results are can be found here: File:ITS AM1OPT.LOG The TS is confirmed by frequency check. The results are shown below:
| Method | Optimisation: to a minimum |
| Calculation Type | FOPT |
| Calculation Method | RAM1 |
| Basis Set | ZDO |
| Total Energy | 0.11165470 a.u. |
| Charge | 0 |
| RMS Gradient Norm | 0.00004127 a.u. |
| Point Group | Cs |
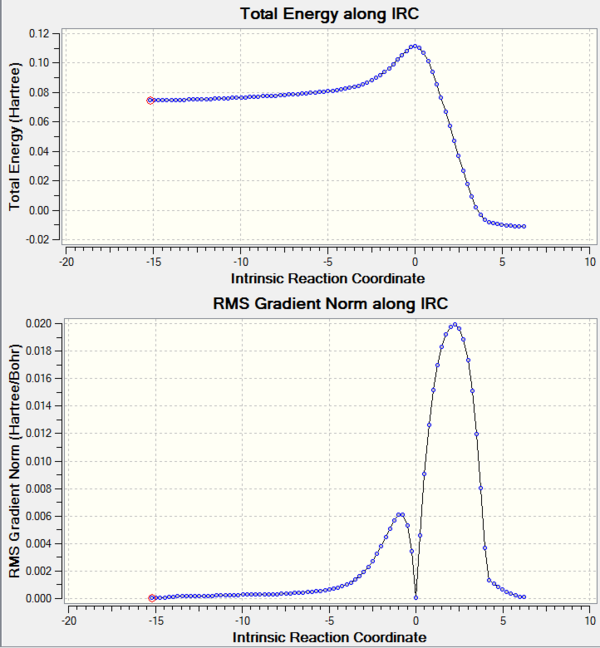
The TS was further confirmed by IRC check. File:IIRC.LOG
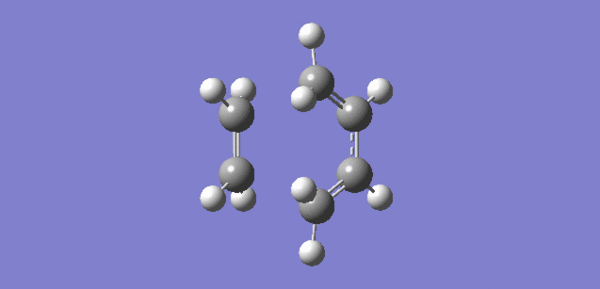
The IRC path is drawn below:
The TS motion:click for the gif file.
Regioselectivity: Cyclohexa-1,3-diene and maleic anhydride reaction
In theory, the transition structure can be found by combining the pre-optimized reagent. The best optimization choice is B3YLP/6-31G. The combined transition state structure should then be optimized again, and its validity can be found by operating frequency check, followed by IRC path check. The 'one and only one' imaginary frequency and the correct IRC coordination should all confirm the TS.
But due to the fact that the time given is very limited, several guess of the transition state structure was made first. These guessed structures were then optimized using the HF/3-21G method, and the following frequency check could identify the correct transition state.
The 'endo' product
The endo TS guesss structure: File:ENDO QST2.LOG To find the transition state structure, the opt=QST2 method was used for better outcome. Below is the numbering of the transition state before optimization.
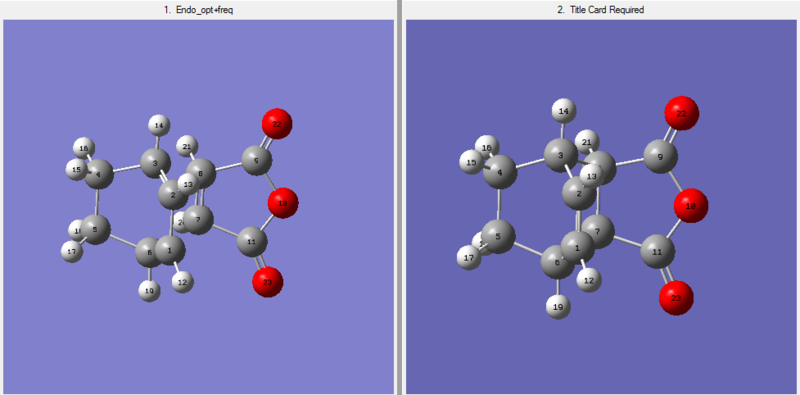
The molecule was optimized for several times until a valid result obtained. The QST2 optimized file can be found here: File:ENDO QST2.LOG.
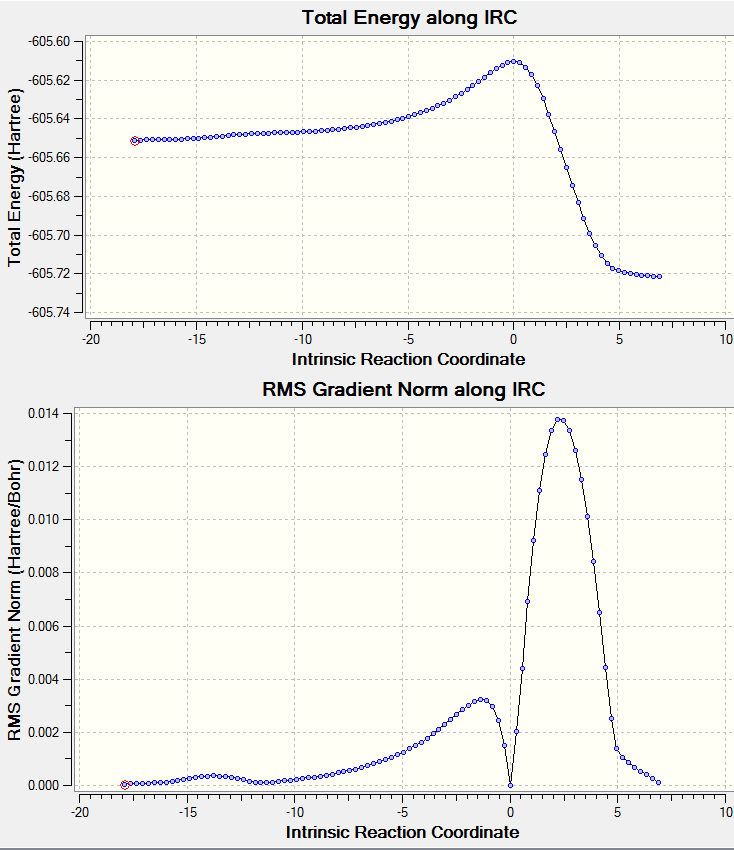
The IRC path of QST2 optimized structure was obtained here: File:ENDO IRC.LOG.
A screenshot of the IRC path:
The 'exo' product
The guess transition structure of the exo product can be found here: File:IiTS.gjf
The frequency-checked .log file is shown here: File:Exo321G.LOG
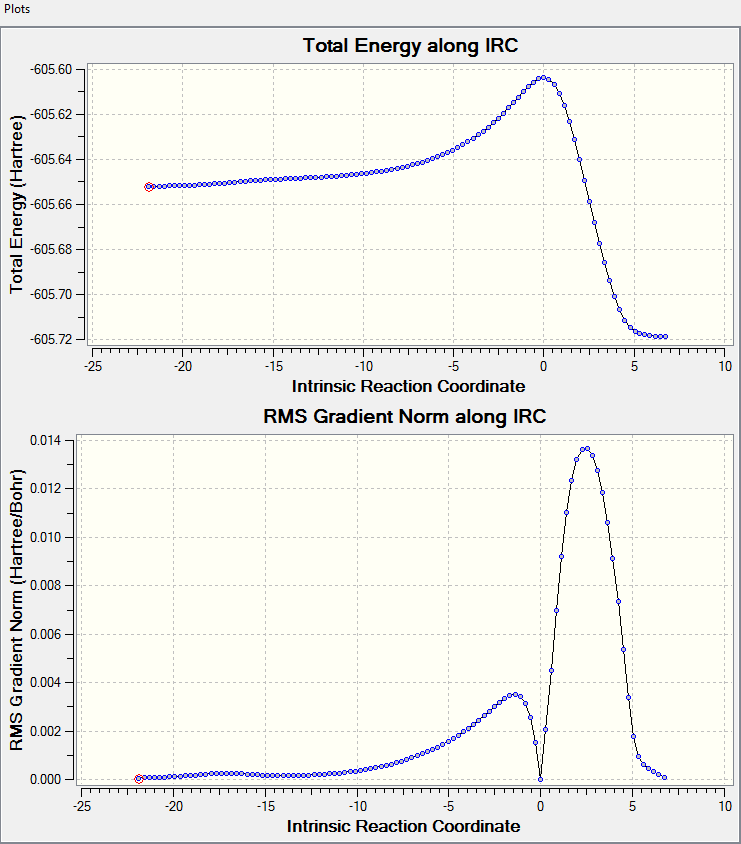
The IRC check for both directions can be seen here: File:ExoIRCbothdirection.LOG
A screenshot of the IRC path:
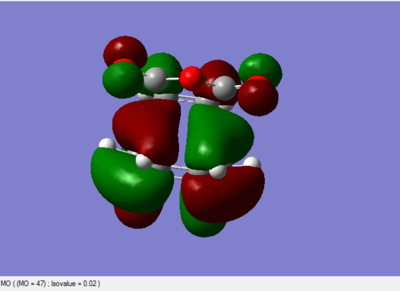
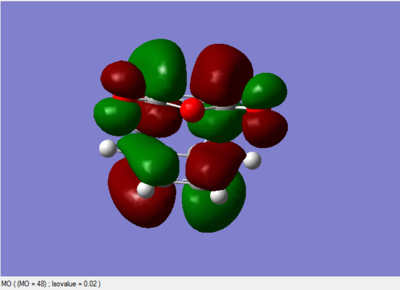
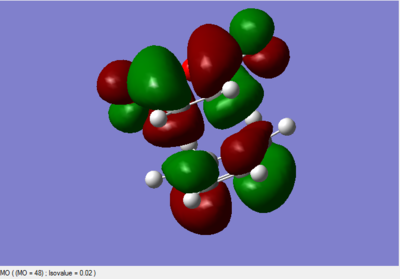
The MO diagrams
 |
 |
 |
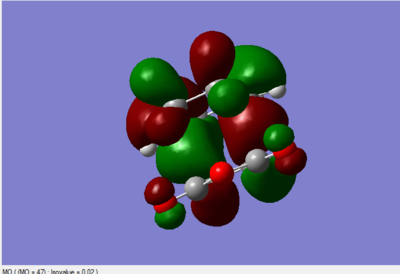 |
All the above MO diagrams are asymmetric with respect to the plane.
Discussion
In fact the 'endo' structure contains more favorable orbital overlaps, it is the preferred transition structure. The so-called 'secondary orbital overlap' cannot be found in exo structure, causes it posses even higher energy. Unfortunately the .chk file cannot be opened due to some systematic error. Thus the comparison of bond length and bond angles between the exo and end forms cannot be done.
During the experiment regioselectivity was neglected. In real life the regioselectivity can be affected by, for example, the polarity of the substituents/the resonance effect. A Frontier Molecular Orbital (FMO) analysis can be used for the study of regioselectivity for these reactions. In addition, in this experiment only the normal electron demand of the is discussed, whereas the inverse electron demand. If the diene contains an electron-withdrawing group, and the dienophile contains an electron-donating group. The LUMO of the diene and the HOMO of the dienophile will then interact, and since these two orbitals are close in energy, the resulting product is strongly energetically favourable.
Reference
- ↑ Phil Klunzinger.Basis Set FAQ[Online]Available form:https://www.wavefun.com/support/sp_compfaq/Basis_Set_FAQ.html[Accessed 9Nov2014]
- ↑ Dept. of Chem. Uni.of Waterloo.Transition State.[Online]Available from://scienide2.uwaterloo.ca/~nooijen/Chem-440-computational/Lab_Gaussian_transition_states.pdf[Accessed 9th Nov2014]
