User:St908(module2)
optimisation of TlBr3
1. What is the optimised Tl-Br bond distance?
2.65Å(3s.f)
2. What is the optimised Br-Tl-Br bond angle?
120°
| File type | .log |
|---|---|
| Calculation type | FOPT |
| Calculation Method | RB3LYP |
| Basis set | LANL2DZ |
| E(RB+HF-LYP) | -91.22 a.u. |
| RMS Gradient Norm | 0.00000090 a.u. |
| Dipole Moment | 0 Bebye |
| Point group | D3H |
Gassian log file link: TlBr3 optimisation
Molecular Orbitals of BH3
Optimised structure of BH3
Output gaussian file link: BH3 energy
BH3 Natural Bond Orbital Analysis
Charge on Boron: 0.331
Charge on Hydrogen: -0.110
Total charge add up to 0 as BH3 is neutral
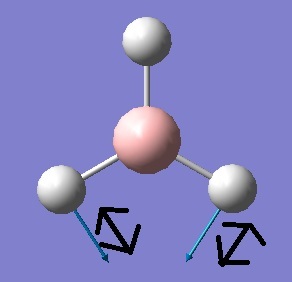
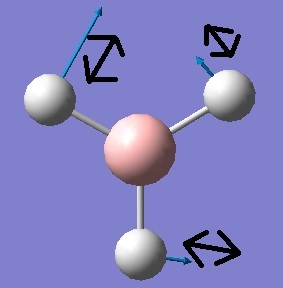
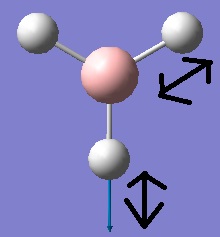
Animating the vibrations
Calculations on TlBr3
The structure is optimised by frequency analysis
1. What is the calculation method?
B3LYP
2. What is the basis set?
LANL2DZ
3. Why must you use the same method and basis set for both calculations?
In order to maintain the accuracy of frequency calculation based on the optimised geometry, we must use same method and basis set.
4. Why do you have to carry out a frequency analysis?
The structure of molecule is further optimised by using frequency analysis in vibrational energy level. The modified bond length and bond angle represent the minimum energy in potential energy surface. Therefore the frequency analysis based on the structure of previous optimisation produces more precise result. The calculation also provides the information of frequency of different vibrational mode.
5. What are the "Low frequencies" for TlBr3? What is the lowest "real" normal mode?
Low frequencies --- -0.0008 -0.0004 -0.0003 18.6824 19.5013 19.5013
They are the motion of centre atom such as Tl in this example. The frequencies are low even compared to the lowest frequency in 3N+6 vibrational modes which is 49.98.
6. Compare the the optimised Tl-Br bond distance to others you find in the literature. Hint: look in the CRC handbook. Sometimes it can be difficult to find a good literature value, in which case we try to find a similar complex or bond distance to compare with. The idea here is to check your result is not unreasonable, not to make a quantitative comparison. Be sure to provide a proper reference for your literature source.
The calculated bond length is 2.69Å.
Literature: Tl-Br bond length of TlBr4- is 2.56Å examined by X-ray measurement[1]
The difference between calculated and literature bond length is about 0.13Å. As TlBr3 and TlBr4- have similar chemical environment in terms of bond length or strength, the results are comparable. Therefore the calculated results is reasonable.
7. In some structures gaussview does not draw in the bonds where we expect, does this mean there is no bond? Why?
Gaussview does not draw bond if the distance between two atom exceed a certain limit. This limit is determined by the extend of overlap and stablizing energy calculated by gaussview. In general, the gaussview does not give bond if the overlap is inefficient to a certain extend. However it does not show no interaction at all or weak bond still exist.
8. What is a bond? (your reply should not be more than a paragraph in length)
In an atom, electron has total energy consisting of potential and kinetic energy. Perturbation of electron orbitals is made if two or several atoms approaches to each other to enable overlap of atomic orbitals. In one case, this overlap results in more stable form with total energy lower than individual atoms before overlapping. The word 'bond' is used to define this additional interaction in a more realistic sense.
The MO diagram of BH3
Mini project
Aim: Find the most stable conformation of Fe2(CO)9 and Ru2(CO)9 by calculating the energy of their isomers. To fulfil 18 electrons rule, there are two types of conformation for d8 transition metal: 3 bridged CO and single bridged CO, as shown below:
As shown above, both structures have M-M bond to stablise the bridged complex. We can count the number of electrons for the complex based on single metal atom(half complex):
| 1 CO bridge | 3 CO bridges | |
|---|---|---|
| terminal CO(2e-) | 4×2 | 3×2 |
| bridged CO(1e-) | 1×1 | 3×1 |
| d8 metal | 8 | 8 |
| M-M (1e-) | 1 | 1 |
| total No of e- | 18 | 18 |
Optimisation of geometry and energy
Visualize the optimised strcuture
output file link monobridged Fe2(CO)9
output file link tribridged Fe2(CO)9
output file link Monobridged Ru2(CO)9
output file link Tribridged Ru2(CO)9
The single M-M bond is drawn in my input file but the calculation eliminate the bond in the output indicates that the interaction is relatively weak. In theory, althougth M-M bond is required to fulfil the 18 electrons rule, the large M-M repulsion cannot be compensated by their weak interaction as the anti-bonding between M-M is more populated than bonding.[2] The calculation of tribridged complex takes 1/20 of the time of calculating monobridged complex as the former one has higher symmetry, D3h compare to C2.(1.5 minutes versus 30 minutes)
| Monobridged Fe | Tribridged Fe | Mono bridged Ru | Tribridged Ru | |
|---|---|---|---|---|
| Calculation type | OPT | OPT | OPT | OPT |
| Calculation Method | B3LYP | B3LYP | B3LYP | B3LYP |
| Basis set | 3-21G | 3-21G | 3-21G | 3-21G |
| Energy(Hatree) | -3529.88 | -3529.77 | -9860.95 | -9860.90 |
| Gradient(a.u) | 0.00002143 | 0.075 | 0.00000546 | 0.07 |
| Dipole Moment(Debye) | 1.04 | 0.06 | 1.07 | 0.17 |
| Point group | C2 | D3h | C2 | D3h |
Comment: The energy of tri-bridged Fe2(CO)9 is about 288±20kJ/mol higher than mono-bridged Fe2(CO)9. Similarly, the tri-bridged Ru complex is 131±20kJ/mol higher than mono-bridged form. The tri-bridged form has much lower dipole moment than mono-bridged form for their highly symmetrical conformation(D3h vs C2)
Bond length Interpretation
| Mono bridge Fe2(CO)9 | Tri bridge Fe2(CO)9 | Mono bridge Ru2(CO)9 | Tri bridge Ru2(CO)9 | |
|---|---|---|---|---|
| B3LYP calculated | 2.64 | 2.49 | 2.88 | 2.65 |
| experimental data | 2.52[3] | 2.85[4] | ||
| deviation | +4.76% | -1.19% | +1.05% | -7.02% |
The experimental bond length of Fe complex sits between the calculated bond length of two forms but closer to the tri-bridged one. For Ru complex, the literature is closer to the mono-bridged form.
Vibrational frequency analysis
=Fe2(CO)9
| Mono-bridged Fe2(CO)9 | Tri-bridged Fe2(CO)9 | Experimental | |
|---|---|---|---|
| Low frequency | -8.0018 -5.0352 0.0043 0.0048 0.0060 5.0209 | -405.8108 -405.6369 -392.2750 -391.0464 -390.8722 -390.1475 | |
| ν1 | 399 | 209 | |
| ν2 | 403 | 273 | |
| ν3 | 439 | 290(289) | |
| ν4 | 480 | 352 | |
| ν5 | 502 | 415(418) | 390(390) |
| ν6 | 560 | 566(569) | 604(605) |
| ν7 | 600 | 744 | |
| ν8 | 614 | 1771(1772) | 1814(1817) |
| ν9 | 637 | 2482(2482) | 2016(2020) |
| ν10 | 658 | 2485(2486) | |
| ν11 | 1842 | 2505 | |
| ν11 | 1997 | ||
| ν12 | 2015 | ||
| ν13 | 2018 | ||
| ν14 | 2028 | ||
| ν15 | 2032 | ||
| ν16 | 2056 |
Output file links
Mono-bridged Fe2(CO)9 Tri-bridged Fe2(CO)9 Mono-bridged Ru2(CO)9 Tri-bridged Ru2(CO)9)
Mono-bridged Fe2(CO)9 is lack of degenerate vibrational mode while tri-bridged one has plenty of degenerate vibrations for C=O and M-C stretches which are close to the experimental data.
- ↑ J.Glaser, G.Johansson, Acta Chem. Scand. A 36(1982)No.2
- ↑ E Hunstock,C Mealli,M J Calhorda and J ReinholdInorg. Chem. 1999, 38, 5053-5060DOI:10.1021/ic961206x
- ↑ Jee Hwan Jang, Jung Goo Lee, and Hosull LeeJ. Phys. Chem. A, Vol. 102, No. 27, 1998DOI:10.1021/jp981356o
- ↑ Churchill M R, Hollander F J, Hutchinson J P. An accurate redetermination of the structure of triruthenium dodecacarbonyl, Ru3(CO)12. Inorg Chem, 1977, 16(10): 2655—2659DOI:10.1021/ja01470a044


