
User:Ss4612
EX3 Section
BH3: B3LYP/3-21G(d,p)
Optimisation log file here
| summary data | convergence | Jmol | |||
|---|---|---|---|---|---|

|
         Item               Value     Threshold  Converged?
 Maximum Force            0.000217     0.000450     YES
 RMS     Force            0.000105     0.000300     YES
 Maximum Displacement     0.000692     0.001800     YES
 RMS     Displacement     0.000441     0.001200     YES
 Predicted change in Energy=-1.635269D-07
 Optimization completed.
    -- Stationary point found.
|
|
BH3: B3LYP/6-31G(d,p)
Optimisation log file here
| summary data | convergence | Jmol | |||
|---|---|---|---|---|---|

|
         Item               Value     Threshold  Converged?
 Maximum Force            0.000203     0.000450     YES
 RMS     Force            0.000098     0.000300     YES
 Maximum Displacement     0.000867     0.001800     YES
 RMS     Displacement     0.000415     0.001200     YES
 Predicted change in Energy=-1.436238D-07
 Optimization completed.
    -- Stationary point found.
|
|
GaBr3: B3LYP/LANL2DZ
Optimisation file DOI:10042/31234
| summary data | convergence | Jmol | |||
|---|---|---|---|---|---|

|
         Item               Value     Threshold  Converged?
 Maximum Force            0.000000     0.000450     YES
 RMS     Force            0.000000     0.000300     YES
 Maximum Displacement     0.000003     0.001800     YES
 RMS     Displacement     0.000002     0.001200     YES
 Predicted change in Energy=-1.307741D-12
 Optimization completed.
    -- Stationary point found.
|
|
BBr3: B3LYP/6-31G(d,p)LANL2DZ
Optimisation file DOI:10042/31147
| summary data | convergence | Jmol | |||
|---|---|---|---|---|---|

|
         Item               Value     Threshold  Converged?
 Maximum Force            0.000024     0.000450     YES
 RMS     Force            0.000014     0.000300     YES
 Maximum Displacement     0.000131     0.001800     YES
 RMS     Displacement     0.000089     0.001200     YES
 Predicted change in Energy=-3.306546D-09
 Optimization completed.
    -- Stationary point found.
|
|
| BH3 | BBr3 | GaBr3 | |
|---|---|---|---|
| r(E-X) | 1.19 | 1.93 | 2.35 |
| θ(X-E-X) | 120.0 | 120.0 | 120.0 |
As it can be seen from the geometry data of the EX3 compounds, they all have the same bond angles, however the bond lengths increases in the order: BH3< BBr3<GaBr3. B and H are relatively small atoms (1st and 2nd row of the periodic table) therefore, they have better orbital alignment giving a stronger bond, resulting in a shorter bond length. In BBr3, Bromine is a large atom, so has poorer orbital alignment with Boron, therefore forms weaker bond represented by the longer bond length. The effect of changing the central element from Boron to Gallium can be seen when comparing the data from BBr3 and GaBr3. However, the relative energies of the molecules cannot be directly compared in this case as the calculations have been done using different basis sets. We could compare the bond lengths, however it is not always a good indication of the bond strength, as Ga-Br may have a larger bond length than B-Br, but since Gallium and Bromine are on the same row of the periodic table, they should have better orbital overlap giving rise to a stronger bond. Boron and Gallium are both group 13 elements, therefore have 3 valence electrons, coordinating to 3 ligands to give rise to trigonal planar compounds.
A bond is an attraction between 2 atoms due to electrostatics, giving rise to orbital overlap. The atoms involved in a bond share electron density between them. Strong chemical bonds occur when the orbital overlap is good- the atoms are from the same row of the periodic table- orbitals of similar energy. However, when the orbitals are of different sizes (different energies), orbital mismatch can occur which lead to weak bonds. Gaussian doesn’t draw bonds in some structures due to the distance between the atoms being larger than the pre-set values which are defined from the vanderwaals radii of the constituent atoms. However, it doesn’t necessarily mean that there is no electron density between the atoms so there orbital overlap may still be present.
BH3:B3LYP/6-31G(d,p)
Frequency file: here
| summary data | low modes |
|---|---|

|
Low frequencies --- -0.9432 -0.8611 -0.0054 5.7455 11.7246 11.7625 Low frequencies --- 1162.9963 1213.1826 1213.1853 |
Vibrational spectrum for BH3
| wavenumber | Intensity | IR active? | type |
| 1163 | 93 | yes | bend |
| 1213 | 14 | very slight | bend |
| 1213 | 14 | very slight | bend |
| 2582 | 0 | no | stretch |
| 2715 | 126 | yes | stretch |
| 2715 | 126 | yes | stretch |
|
GaBr3:B3LYP/6-31G(d,p)
Frequency file: DOI:10042/31174
| summary data | low modes |
|---|---|

|
Low frequencies --- -0.5252 -0.5247 -0.0024 -0.0010 0.0235 1.2010 Low frequencies --- 76.3744 76.3753 99.6982 |
Vibrational spectrum for GaBr3
| wavenumber | Intensity | IR active? | type |
| 76 | 3 | very slight | bend |
| 76 | 3 | very slight | bend |
| 100 | 9.21 | very slight | bend |
| 197 | 0 | no | stretch |
| 316 | 57 | yes | stretch |
| 316 | 57 | yes | stretch |
|
Comparison of vibrational spectra of GaBr3 and BH3
| Molecule | Vibrational frequencies | |
|---|---|---|
| GaBr3 |
                      1                      2                      3
                     E'                     E'                     A2"
 Frequencies --     76.3744                76.3753                99.6982
 Red. masses --     77.4211                77.4212                70.9513
 Frc consts  --      0.2661                 0.2661                 0.4155
 IR Inten    --      3.3447                 3.3447                 9.2161
                      4                      5                      6
                     A1'                    E'                     E'
 Frequencies --    197.3371               316.1825               316.1863
 Red. masses --     78.9183                72.2067                72.2066
 Frc consts  --      1.8107                 4.2531                 4.2532
 IR Inten    --      0.0000                57.0704                57.0746
|
|
| BH3 |
                      1                      2                      3
                     A2"                    E'                     E'
 Frequencies --   1162.9963              1213.1826              1213.1853
 Red. masses --      1.2531                 1.1072                 1.1072
 Frc consts  --      0.9986                 0.9601                 0.9601
 IR Inten    --     92.5482                14.0551                14.0587

                     A1'                    E'                     E'
 Frequencies --   2582.2764              2715.4465              2715.4477
 Red. masses --      1.0078                 1.1273                 1.1273
 Frc consts  --      3.9595                 4.8977                 4.8977
 IR Inten    --      0.0000               126.3302               126.3206
|
The most obvious difference between the vibrational spectra of GaBr3 and BH3 is the reordering of the vibrational modes. GaBr3 and BH3 have different characteristics because in BH3, the ligands (hydrogen atoms) are lighter than the central atom (Boron) whereas in GaBr3, the heavier atoms (bromine) are the ligands and the lighter atom is the central atom (gallium). This causes a rearrangement in energies of the modes. For example, the a2” umbrella motion for BH3, the hydrogen atoms have the larger displacement vectors than the Boron; whereas in GaBr3, Ga has the higher displacement vector than the Br due to the Br being heavier than the Ga.
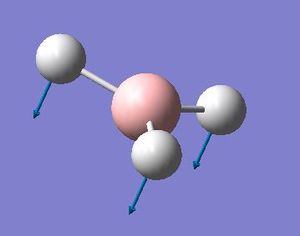 BH3 a2" mode with displacement vectors


GaBr3 a2" mode with displacement vectors
The large difference in the vibrational frequencies of BH3 and GaBr3 indicate that the nature of the strength of the bonding is different for the two. Vibrational frequency is related to the reduced mass of the molecule (inversely proportional). Since GaBr has a larger reduced mass of 70.95, which is due to the constituent atoms being heavier, the frequency of vibrations are much lower than that of B-H where the constituent atoms have much lower reduced mass of 1.25
The force constants give an indication of the strength of the bond (albeit being good at short displacements due to the harmonic potential being parabolic, whereas an actual bond potential is better modelled by the morse potential), it is the second derivative of the potential energy surface. For the a2" umbrella motion, the force constant for BH3 is 1.00, whereas for GaBr3 is 0.27. This suggests that the bonding between B and H in BH3 is much stronger than Ga and Br in GaBr3. Also, the intensity of the IR frequency for a2" motion differs vastly for GaBr3 and BH3, being 9.21 and 92.55 respectively which for BH3 is 10 times as large than that of GaBr3. This would indicate that for BH3, there is a much larger change in the dipole moment than in GaBr3 for this motion.
A frequency analysis is carried out for a few reasons. In particular, it gives an idea of how well the optimisation of the molecule was carried out. The better the optimisation (reaching the lowest energy in the potential surface for a particular geometry), the lower the range of the low frequencies and the closer to zero they are. As well, experimentally, only the IR modes of vibration that cause a change in the dipole moment of the molecule show up on the IR spectra, however, when we carry out a frequency analysis, we could get an idea of the frequency of the vibrations that do not cause a change in the dipole moment and hence can't be detected experimentally via IR spectroscopy.
It is crucial that the same basis sets and methods are used for the optimisation and frequency calculations as calculations using different methods and basis sets may yield meaningless values becuase a frequency analysis is carried out on an optimised molecule.
MO analysis of BH3
Energy MO file DOI:10042/31175

LCAO MOs and “real” MOs look quite similar. LCAO gives a good indication of the shape of the molecular orbital. The “real” MOs shows the overall orbital as a result of the atomic orbital contribution and also portrays well the extent of delocalisation of the orbitals of the molecule which from the LCAO approach can prove difficult to visualise. The bonding MO orbital has more contribution from the lower energy atomic orbital, where as the anti bonding orbital will have larger contribution from the contributing higher energy atomic orbital. It is useful to see the 3D computed MOs and derive the energies of the MOs. Qualitative analysis provides a quick and easy way of getting an idea of the MO and the relative energy levels, however it can prove difficult to judge the energies of the Molecular orbitals and thus the contributions from the atomic orbitals, through qualitative means.
NH3: B3LYP/6-31G
Optimisation log file here
| summary data | convergence | Jmol | |||
|---|---|---|---|---|---|

|
         Item               Value     Threshold  Converged?
 Maximum Force            0.000000     0.000450     YES
 RMS     Force            0.000000     0.000300     YES
 Maximum Displacement     0.000004     0.001800     YES
 RMS     Displacement     0.000002     0.001200     YES
 Predicted change in Energy=-2.495686D-12
 Optimization completed.
    -- Stationary point found.
|
|
NH3:B3LYP/6-31G(d,p)
Frequency log file here
| summary data | low modes |
|---|---|

|
Low frequencies --- -7.8755 -7.7311 -7.7308 0.0013 0.0021 0.0116 Low frequencies --- 1089.2805 1693.9179 1693.9180 |
Vibrational spectrum for NH3
| wavenumber | Intensity | IR active? | type |
| 1089 | 145 | yes | bend |
| 1694 | 14 | very slight | bend |
| 1694 | 14 | very slight | bend |
| 3461 | 1 | very slight | stretch |
| 3590 | 0 | yes | stretch |
| 3590 | 0 | yes | stretch |
|
NH3 population analysis: DOI:10042/31235
Charge Distribution of NH3

The following charge distribution is for NH3 molecule within the range -1.000 to +1.000. The colour red represents negative charge which sits on the Nitrogen atom due to it's high electronegativity; whilst green represents positive charge and sits on the Hydrogen atoms.
NBO charges on NH3

NH3BH3: B3LYP/6-31G(d,p)
Optimisation log file here
| summary data | convergence | Jmol | |||
|---|---|---|---|---|---|

|
         Item               Value     Threshold  Converged?
 Maximum Force            0.000006     0.000015     YES
 RMS     Force            0.000002     0.000010     YES
 Maximum Displacement     0.000054     0.000060     YES
 RMS     Displacement     0.000016     0.000040     YES
 Predicted change in Energy=-4.309418D-10
 Optimization completed.
    -- Stationary point found.
|
|
NH3BH3 frequency analysis
Frequency log file here
| summary data | low modes |
|---|---|

|
Low frequencies --- -6.2135 -0.1864 -0.0266 -0.0007 2.0267 2.0570 Low frequencies --- 263.2686 632.9065 638.4482 |
Vibrational spectrum for NH3BH3
| wavenumber | Intensity | IR active? | type |
| 263 | 0 | no | H-N-B-H bend |
| 633 | 14 | very slight | N-B stretch |
| 638 | 4 | very slight | H3N-BH3 bend |
| 638 | 4 | very slight | H3N-BH3 bend |
| 1069 | 41 | yes | H3N-BH3 bend |
| 1069 | 41 | yes | H3N-BH3 bend |
| 1196 | 109 | yes | B-H bend |
| 1204 | 3 | very slight | B-H bend |
| 1204 | 4 | very slight | B-H bend |
| 1329 | 114 | yes | N-H bend |
| 1676 | 28 | yes | N-H bend |
| 1676 | 28 | yes | N-H bend |
| 2472 | 67 | yes | B-H stretch |
| 2532 | 231 | yes | B-H asymmetric stretch |
| 2532 | 231 | yes | B-H asymmetric stretch |
| 3464 | 2.5 | very slight | N-H symmetric stretch |
| 3581 | 28 | yes | N-H asymmetric stretch |
| 3581 | 28 | yes | N-H symmetric stretch |
|
Relative energy of NH3BH3:
- E(NH3)=-56.5577686 a.u.
- E(BH3)=-26.6153235 a.u.
- E(NH3BH3)=-83.2246891 a.u.
- ΔE=E(NH3BH3)-[E(NH3)+E(BH3)]= -0.0515970 a.u. = -135.47 kJ/mol
Since the relative energy is negative, it indicates that NH3BH3 is more stable than the starting materials, hence the formation of NH3BH3 from NH3 and BH3 is favourable.
Project Section: Lewis Acids and Bases
Al2Cl4Br2: BL3YP; Al, Cl: 6-31G(d,p); Br: PP LANL2DZdp
Al2Cl4Br2: Bridging Bromine (isomer 1)
Optimisation log file here
| summary data | convergence | Jmol | |||
|---|---|---|---|---|---|

|
         Item               Value     Threshold  Converged?
 Maximum Force            0.000003     0.000450     YES
 RMS     Force            0.000001     0.000300     YES
 Maximum Displacement     0.000057     0.001800     YES
 RMS     Displacement     0.000015     0.001200     YES
 Predicted change in Energy=-2.941357D-10
 Optimization completed.
    -- Stationary point found.
|
|
Frequency analysis
Frequency log file here
| summary data | low modes |
|---|---|

|
Low frequencies --- -5.1748 -5.0353 -3.1463 -0.0039 -0.0038 -0.0035 Low frequencies --- 14.8261 63.2702 86.0770 |
Vibrational spectrum
| wavenumber | Intensity | IR active? | type |
| 15 | 0 | no | bend |
| 63 | 0 | no | bend |
| 86 | 0 | no | bend |
| 87 | 0 | no | bend |
| 108 | 5 | very slight | bend |
| 111 | 0 | no | bend |
| 126 | 8 | very slight | bend |
| 135 | 0 | no | bend |
| 138 | 7 | very slight | bend |
| 163 | 0 | no | bend |
| 197 | 0 | no | stretch |
| 241 | 100 | yes | stretch |
| 247 | 0 | no | symmetric stretch |
| 341 | 161 | yes | stretch |
| 467 | 347 | yes | stretch |
| 494 | 0 | no | stretch |
| 608 | 0 | no | stretch |
| 616 | 332 | yes | stretch |
|
Al2Cl4Br2: Bridging Br,Cl (isomer 2)
Optimisation log file here
| summary data | convergence | Jmol | |||
|---|---|---|---|---|---|

|
         Item               Value     Threshold  Converged?
 Maximum Force            0.000105     0.000450     YES
 RMS     Force            0.000026     0.000300     YES
 Maximum Displacement     0.001371     0.001800     YES
 RMS     Displacement     0.000597     0.001200     YES
 Predicted change in Energy=-1.135980D-07
 Optimization completed.
    -- Stationary point found.
|
|
Frequency analysis
Frequency log file here
| summary data | low modes |
|---|---|

|
Low frequencies --- -2.9949 -1.4967 -0.0018 -0.0009 0.0009 3.0905 Low frequencies --- 17.0179 55.9576 80.0483 |
Vibrational spectrum
| wavenumber | Intensity | IR active? | type |
| 17 | 0 | no | bend |
| 56 | 10 | no | bend |
| 80 | 0 | no | bend |
| 92 | 1 | no | bend |
| 107 | 0 | no | bend |
| 110 | 5 | very slight | bend |
| 121 | 8 | very slight | bend |
| 149 | 5 | very slight | bend |
| 154 | 6 | very slight | bend |
| 186 | 1 | no | bend |
| 211 | 21 | yes | stretch |
| 257 | 10 | very slight | stretch |
| 289 | 48 | yes | stretch |
| 384 | 154 | yes | stretch |
| 424 | 274 | yes | stretch |
| 493 | 107 | yes | stretch |
| 574 | 122 | yes | stretch |
| 615 | 197 | yes | stretch |
|
Al2Cl4Br2: Trans-terminal-Bromine (isomer 3)
Optimisation log file here
| summary data | convergence | Jmol | |||
|---|---|---|---|---|---|
         Item               Value     Threshold  Converged?
 Maximum Force            0.000004     0.000450     YES
 RMS     Force            0.000002     0.000300     YES
 Maximum Displacement     0.000052     0.001800     YES
 RMS     Displacement     0.000022     0.001200     YES
 Predicted change in Energy=-5.709023D-10
 Optimization completed.
    -- Stationary point found.
|
|
Frequency analysis
Frequency log file here
| summary data | low modes |
|---|---|
Low frequencies --- -4.2788 -2.4941 -0.0035 -0.0028 -0.0025 0.9634 Low frequencies --- 17.7201 48.9826 72.9516 |
Vibrational spectrum
| wavenumber | Intensity | IR active? | type |
| 18 | 0 | no | bend |
| 49 | 0 | no | bend |
| 73 | 0 | no | bend |
| 105 | 0 | no | bend |
| 110 | 0 | no | bend |
| 117 | 9 | very slight | bend |
| 120 | 13 | very slight | bend |
| 157 | 0 | no | bend |
| 160 | 6 | very slight | bend |
| 192 | 0 | no | bend |
| 264 | 0 | no | stretch |
| 289 | 29 | yes | stretch |
| 308 | 0 | yes | stretch |
| 413 | 149 | yes | stretch |
| 421 | 439 | yes | stretch |
| 459 | 0 | no | stretch |
| 574 | 0 | no | stretch |
| 580 | 316 | yes | stretch |
|![]()
Al2Cl4Br2: Cis-terminal-Bromine (isomer 4)
Optimisation log file here
| summary data | convergence | Jmol | |||
|---|---|---|---|---|---|

|
         Item               Value     Threshold  Converged?
 Maximum Force            0.000022     0.000450     YES
 RMS     Force            0.000012     0.000300     YES
 Maximum Displacement     0.000812     0.001800     YES
 RMS     Displacement     0.000297     0.001200     YES
 Predicted change in Energy=-2.336370D-08
 Optimization completed.
    -- Stationary point found.
|
|
Frequency analysis
Frequency log file here
| summary data | low modes |
|---|---|

|
Low frequencies --- -4.2142 -2.4692 -0.0045 -0.0039 -0.0032 0.9511 Low frequencies --- 17.0927 50.8321 78.6205 |
Vibrational spectrum
| wavenumber | Intensity | IR active? | type |
| 17 | 0 | no | bend |
| 51 | 0 | no | bend |
| 79 | 0 | no | bend |
| 99 | 0 | no | bend |
| 104 | 3 | very slightly | bend |
| 121 | 13 | very slight | bend |
| 123 | 6 | very slight | bend |
| 157 | 0 | no | bend |
| 159 | 0 | no | bend |
| 194 | 1.5 | very slight | stretch |
| 264 | 0 | no | stretch |
| 279 | 26 | yes | stretch |
| 309 | 2 | very slight | stretch |
| 413 | 149 | yes | stretch |
| 420 | 409 | yes | stretch |
| 461 | 36 | yes | stretch |
| 570 | 34 | yes | stretch |
| 582 | 277 | yes | stretch |
|
Relative energies of Al2Cl4Br2 isomers
- E(isomer1)= -2352.4063080 a.u.
- E(isomer2)= -2352.4110993 a.u.
- E(isomer3)= -2352.4162882 a.u. (lowest energy conformer)
- E(isomer4)= -2352.4162658 a.u.
Therefore the relative energies of the isomers:
- E(isomer1)= E(isomer1)-E(isomer3)= 0.0099802 a.u. = 26.20 kJ/mol
- E(isomer2)= E(isomer2)-E(isomer3)= 0.0051889 a.u. = 13.62 kJ/mol
- E(isomer3)= E(isomer3)-E(isomer3)= 0 a.u. = 0 kJ/mol
- E(isomer4)= E(isomer4)-E(isomer3)= 0.0022400 a.u. = 5.88 kJ/mol
Bridging ligands form 2 2c-2e bond with both metal centres. One being a covalent bond, the other is a donation of one of it's lone pairs to the other metal centre (dative covalent bond). As is reflected from the data, the most stable isomer of Al2Cl4Br2 is isomer 3 where the Bromine atoms are the furthest from each other, as they are terminal and trans. Isomer 4 is very similar in energy to isomer 3, but slightly higher in energy due to the configuration of the Bromine atoms being cis-terminal. Isomer 1 has the highest energy, and therefore the least stable due to the both the Bromine atoms being bridging. Bromine atoms are much larger than Chlorine, therefore has a larger van der waals radius, which are: 1.76 and 1.87 for Chlorine and Bromine respectively.[1]. Since in isomer 1, both the Br atoms are bridging, this would mean that they are very close to each other, which would make the structure strained.
AlCl2Br
Optimisation log file here
| summary data | convergence | Jmol | |||
|---|---|---|---|---|---|

|
         Item               Value     Threshold  Converged?
 Maximum Force            0.000136     0.000450     YES
 RMS     Force            0.000073     0.000300     YES
 Maximum Displacement     0.000760     0.001800     YES
 RMS     Displacement     0.000497     0.001200     YES
 Predicted change in Energy=-7.984435D-08
 Optimization completed.
    -- Stationary point found.
|
|
Frequency analysis
Frequency log file here
| summary data | low modes |
|---|---|

|
Low frequencies --- -0.0025 0.0006 0.0027 1.3569 3.6367 4.2604 Low frequencies --- 120.5042 133.9178 185.8950 |
Vibrational spectrum
| wavenumber | Intensity | IR active? | type |
| 121 | 5 | very slight | bend |
| 134 | 6 | very slight | bend |
| 186 | 33 | yes | bend (umbrella) |
| 313 | 7 | very slight | stretch |
| 552 | 174 | yes | stretch |
| 613 | 186 | yes | asymmetric stretch |
|
Dissociation energy of Isomer 3 into 2AlCl2Br
- E(isomer3)= -2352.4162882 a.u.
- E(AlCl2Br)= -1176.1901368 a.u.
Dissociation:
Al2Cl4Br2--> 2AlCl2Br
Dissociation energy:
ΔE= 2E(AlCl2Br) - E(isomer3)= 0.0360146 a.u. = 94.56 kJ/mol
Since the Dissociation energy is positive, energy needs to be put into the system in order for the Al2Cl4Br2 dissociation to occur into its monomers. Aluminium is a group 13 element, so has 3 valence electrons. Upon bonding to 3 ligands, it still has an incomplete octet, which makes the Aluminium centres electron deficient, therefore it acts as a lewis acid. Upon dimerisation, this electron deficiency is reduced by the electron rich bridging halide atoms.
Symmetry and IR bands
The 4 isomers of Al2Cl4Br2 have the following point groups:
- Isomer1: d2h; IR active modes: b1u, b3u, b2u
- Isomer2: c1; IR active modes: a
- Isomer3: c2h; IR active modes: au, bu
- Isomer4: c2v; IR active modes: a1, b1, b2
D2h point group has 3 IR active symmetry labels: b1u, b3u and b2u, all of which have translational motion that causes a change in the dipole moment of the molecule giving rise to IR bands. Isomer 2 has a C1 point group which have no symmetry elements, therefore most vibrations result in a change of dipole moment of the molecule, therefore it has the highest number of IR active vibrational modes. Isomer 3 has a C2h point group which has 2 IR active translational labels, giving rise to 2 main IR active bands. Isomer 4 has a C2v symmetry, with 3 IR active translational labels, giving 3 main IR active bands.
The more symmetrical a molecule, the lower the number of IR active bands due to the lower number of IR vibrational modes resulting in change of the dipole moment of the molecule.
Vibrational analysis of Al2Cl4Br2
| Mode | Isomer | Details |

Mode 18 |
Isomer 1 | Frequency: 616 cm-1
Intensity: 331 |
 
Modes 17 and 18 |
Isomer 2 | Mode 17: Frequency: 574 cm-1
Intensity: 122 Mode 18: Frequency: 615 cm-1 Intensity: 197 |

|
Isomer 3 | Frequency: 579 cm-1
Intensity: 316 |

|
Isomer 4 | Frequency: 582 cm-1
Intensity: 277 |
Similar vibrational mode for the 4 isomers are tabulated above. As it can be seen from the table above, isomer 2 with a point group of C1 is the least symmetrical. The two Al atoms carry different substituent atoms hence the spitting of the vibrational mode in two. Isomer 1 has all the Br atoms as bridging ligands. For this mode of vibration, Isomer 1 has the highest frequency. It involves the Al atoms bending around Br atoms, and the stretching of Al-Cl bonds. Here, all 4 bond stretches are Al-Cl bonds, and since Al-Cl bonds are stronger than Al-Br bonds, isomer 1 has the highest frequency. In mode 17 for isomer 2, it involves terminal asymmetrical stretches of Cl-Al-Br , compared to mode 18 where it is Cl-Al-Cl stretch. The frequency for mode 17 is lower than for mode 18, which reflects the weaker bonding in Cl-Al-Br, as well as the higher reduced mass of this component, reducing the frequency.
| Mode | Isomer | Details |

Mode 10 |
Isomer 1 | Frequency: 163 cm-1
Intensity: 0 |

Mode 10 |
Isomer 2 | Frequency: 186 cm-1
Intensity: 1 |

Mode 10 |
Isomer 3 | Frequency: 192 cm-1
Intensity: 0 |

Mode 10 |
Isomer 4 | Frequency: 194 cm-1
Intensity: 2 |
From the table presented above, the highest frequency for this mode is for isomer 4 where all the bridging atoms are Cl, and the Bromines are terminal and cis. A few interesting points are that there is a visible trend in the change in frequency of the isomers for this mode of vibration as the bridging substituents are changed from Cl to Br. Al-Cl bond in stronger, consequently, isomers 3 and 4 where all the bridging atoms are Cl, the frequency is higher. There is gradual shift to lower frequencies as the bridging ligands are replaced from Cl to Br which can be seen moving from isomers 3 to 1, where the stretching frequencies are: 192, 186 and 163 cm-1 respectively. The possible contributing factors could be the difference in the force constants of the Al-Cl and Al-Br bonds, as well as the change in the reduced mass of the mode due to Br being heavier than Cl.
MO analysis of Isomer 3
Orbital 37

Orbital 41

Orbital 43

Orbital 46

Orbital 49

Orbital 54

References
- ↑ Inorganic Materials, Vol. 37, No. 9, 2001, pp. 871–885. Translated from Neorganicheskie Materialy, Vol. 37, No. 9, 2001, pp. 1031–1046. Original Russian Text Copyright © 2001 by Batsanov.