User:Sk5812
EX3 Section
| BH3 | BBr3 | GaBr3 | |
|---|---|---|---|
| r(E-X) | cell | cell | cell |
| θ(X-E-X) | cell | cell | cell |
Structure Comparison BH3, GaBrH3 and BBr3
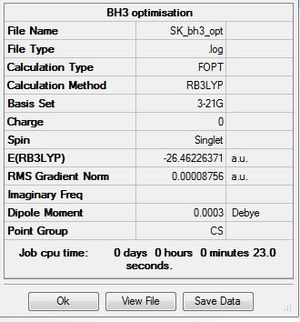
BH3 B3LYP/3-21G basis set
Optimisation log file here
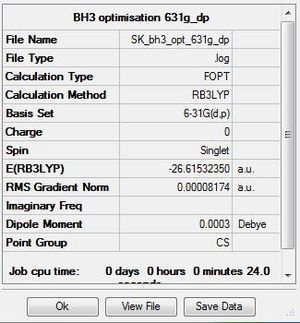
Improving the basis set for BH3 B3LYP/6-31G(d,p)
Optimisation log file here
| summary data | convergence | Jmol | |||
|---|---|---|---|---|---|
|
     Item               Value     Threshold  Converged?
 Maximum Force            0.000203     0.000450     YES
 RMS     Force            0.000098     0.000300     YES
 Maximum Displacement     0.000849     0.001800     YES
 RMS     Displacement     0.000415     0.001200     YES
 Predicted change in Energy=-1.436188D-07
 Optimization completed.
|
|
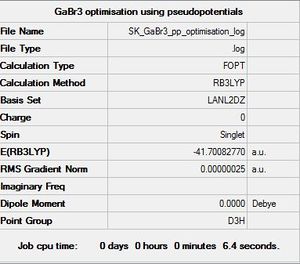
Using pseudo potenstials and larger basis sets for GaBr3 B3LYP/LANL2DZ
Optimisation log file [[DOI:10042/31139 | here]]
| summary data | convergence | Jmol | |||
|---|---|---|---|---|---|
|
Item Value Threshold Converged? Maximum Force 0.000000 0.000450 YES RMS Force 0.000000 0.000300 YES Maximum Displacement 0.000003 0.001800 YES RMS Displacement 0.000002 0.001200 YES Predicted change in Energy=-2.041155D-12 Optimization completed. |
|
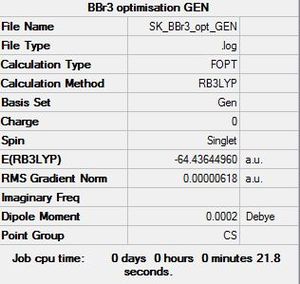
Using a mixture of pseudo potentials and basis sets BBr3 B3LYP/6-31G(d,p)LANL2DZ
Optimisation log file [[DOI:10042/31146 | here]]
| summary data | convergence | Jmol | |||
|---|---|---|---|---|---|
|
Item Value Threshold Converged? Maximum Force 0.000011 0.000450 YES RMS Force 0.000007 0.000300 YES Maximum Displacement 0.000048 0.001800 YES RMS Displacement 0.000031 0.001200 YES Predicted change in Energy=-6.908985D-10 Optimization completed. |
|
Geometry data
| BH3 | BBr3 | GaBr3 | |
|---|---|---|---|
| r(E-X) | 1.19 | 1.93 | 2.35 |
| θ(X-E-X) | 120.0 | 120.0 | 120.0 |
All three structures are trigonal planar with bond angles of 120°.
The difference in bond lengths can be rationalised using ideas about the relative orbital contribution each atom makes towards a stable bonding interaction if a molecular orbital diagram were to be made. A more electronegative atom will make a larger contribution towards the bonding molecular orbital; while degenerate orbitals will contribute the same amount.[1] Upon changing the ligand from H to the more electronegative Br, B contributes less toward the bonding orbital and more toward the antibonding orbital, there is lengthening of the B-Br bond. B and H are electropositive elements and so in BH3 the fragment orbitals are closer in energy compared to BBr3 where there is minimal stabilization and destabilization as well as relatively minimal covalent character. Br is a much larger atom compared to H, the 2p-4p interaction in B-Br bonds is weaker and less efficient compared to the more contracted 2p-1s interaction present in B-H bonds.
When changing the central atom from B to Ga, further down in group 3, electronegativity decreases. Furthermore, going down group 3 of the periodic table the orbitals become increasingly diffuse; there is poor 4p-4p overlap in Ga-Br relative to 2p-4p orbital overlap in B-Br. B is sp2 hybridized with six electrons and highly Lewis acidic; Br donates its lone pairs into the empty p orbital to relieve electron deficiency. Lewis acidity decreases down the group and so the donation from Br lone pairs does not have a significant effect on Ga. The method and basis set used for GaBr3 and BBr3 were different so we cannot decipher the bond strengths of these with absolute certainty. In order to do this force constants could be compared after doing a frequency analysis using the same method and basis set for both GaBr3 and BBr3.
In a bond there is electrostatic attraction between electrons and nuclei. A bonding interaction arises due to an in-phase orbital overlap. The magnitude of orbital overlap depends on the relative location, orientation and how diffuse the orbitals in question are. In general the order of bond strength between orbitals is as follows s>p>d. Examples of strong bonds are ionic (e.g. NaCl) and covalent bonds (N2) whereas hydrogen bonding and dipole-dipole interactions are weak. Strong bonds have good overlap with fragment orbitals close in energy, there is a high degree of stabilization and destabilization of the MOs when they overlap. Orbitals that are close in proximity and dense contribute to strong bonding. A medium bond could weaker overlap between diffuse orbitals or orbitals that are not close together.These may include simple covalent molecules such as ammonia. Weak bonds such as dipole dipole interactions are caused by an unequal distribution of electron density and are by no means a permanent arrangement.
In some structures Gaussview does not draw in bonds because it may exceed a pre-specified value where it assumes a bonding interaction does not exist, this is untrue.
Frequency and vibrational analysis of BH3 and GaBr3
BH3 B3LYP/6-31G(d,p)
Frequency file: here
| summary data | low modes |
|---|---|

|
Low frequencies --- -4.9663 -1.2173 -0.0053 0.9961 9.0323 9.1140 Low frequencies --- 1162.9784 1213.1706 1213.1733 |
6-31G(d,p) BH3 Vibrational Spectrum
| wavenumber | Intensity | IR active? | type |
| 1163 | 93 | yes | bend |
| 1213 | 14 | very slight | bend |
| 1213 | 14 | very slight | bend |
| 2582 | 0 | no | symmetric stretch |
| 2715 | 126 | yes | asymmetric stretch |
| 2715 | 126 | yes | asymmetric stretch |
6-31G(d,p) GaBr3 Freqency analysis Section
Frequency file: [[DOI:10042/31166 | here]]
| summary data | low modes |
|---|---|

|
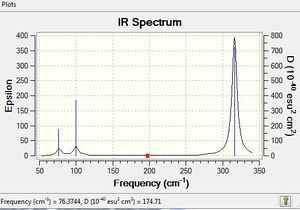
Low frequencies --- -0.5252 -0.5247 -0.0024 -0.0010 0.0235 1.2010 Low frequencies --- 76.3744 76.3753 99.6982 |
6-31G(d,p) GaBr3 Vibrational Spectrum
| wavenumber | Intensity | IR active? | type |
| 76 | 3 | yes | bend |
| 76 | 3 | very slight | bend |
| 99 | 9 | very slight | bend |
| 197 | 0 | no | symmetric stretch |
| 316 | 57 | yes | asymmetric stretch |
| 316 | 57 | yes | asymmetric stretch |
A higher vibrational frequency in the IR spectrum of BH3 relative to GaBr3 is indicative of a stronger bond. The force constants corresponding to each vibrational frequency for B-H is greater than that of Ga-Br. In addition to this the reduces mass of Ga-Br is greater than that of B-H corresponding to a lower vibrational frequency.
There are fewer vibrational peaks than vibrations as only modes involving a change in dipole moment are IR active.The low frequency represents the last 6 vibrational frequencies out of total 3N-6 degrees of freedom where N is the total number of atoms. These correspond to translational and rotational motion. These should lie within a small range typically 15 cm-1 and confirm the geometry after optimization has worked; the structure can be said to be close to a minimum on a potential energy surface. A frequency analysis confirms the presence of the minimum structure, essentially the second derivative of the potential energy surface. If the frequencies are all positive a minimum is present. The frequency analysis shows all possible degrees of freedom and so allows comparison between computed and experimental IR spectra. The same method and basis set must be used for optimisation and frequency analysis as it would be meaningless to compare calculations that have use different levels of accuracy. Furthermore, computing energies is highly dependent on the method and basis set and errors could result if these were not consistent.
Molecular orbitals
6-31G(d,p) BH3 MO
Population analysis file: [[DOI:10042/31176 | here]]
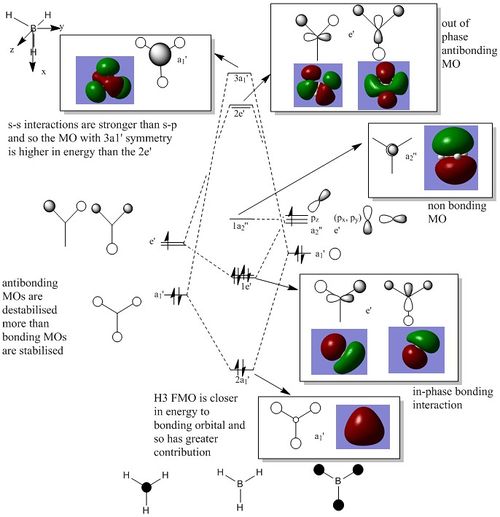
The Lewis acidic character is reflected in the relatively low energy LUMO of BH3 (non bonding pz with a2’’ symmetry), it can accept electrons without changing its overall bonding character. There is some debate as to the relative ordering of the 3a1' and the 2e' energy levels. For this particular calculation the 3a1' was higher however it would also be plausible to suggest the 3a1' to be lower than 2e' since the a1' energy levels are lower in energy. [1]There are no significant differences between the real and LCAO MOs, the LCAO MOs are perhaps slightly more localised. The real MOs appear slighly more delocalised across the molecule. This suggests qualitative MO theory provides a good approximation for what the real MOs should look like and which orbitals are interacting.
6-31G(d,p) NH3 Optimisation
Optimisation log file here
| summary data | convergence | Jmol | |||
|---|---|---|---|---|---|

|
    Item               Value     Threshold  Converged?
 Maximum Force            0.000005     0.000450     YES
 RMS     Force            0.000003     0.000300     YES
 Maximum Displacement     0.000010     0.001800     YES
 RMS     Displacement     0.000007     0.001200     YES
 Predicted change in Energy=-7.830781D-11
 Optimization completed.
|
|
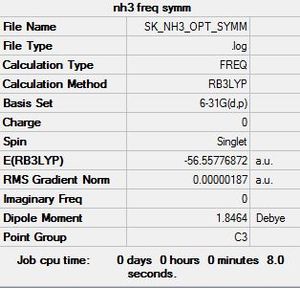
6-31G(d,p) NH3 Freqency analysis Section
Frequency file: here
| summary data | low modes |
|---|---|
|
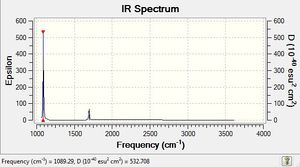
Low frequencies --- -0.0411 -0.0143 0.0005 1.6412 1.6437 2.4682 Low frequencies --- 1089.2851 1693.9239 1693.9239 |
6-31G(d,p) NH3 Vibrational Spectrum
| wavenumber | Intensity | IR active? | type |
| 1089 | 145 | yes | bend |
| 1694 | 14 | very slight | bend |
| 1694 | 14 | very slight | bend |
| 3461 | 1 | no | symmetric stretch |
| 3590 | 0 | yes | asymmetric stretch |
| 3590 | 0 | yes | asymmetric stretch |
Comparing the umbrella motion in BH3 and NH3
| BH3 | GaBr3 |
|---|---|
|
|

|

|
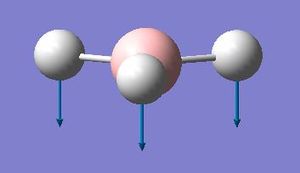
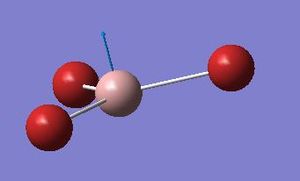
The a2’’ umbrellla motion in BH3 and GaBr3 have undergone a reordering of modes. In BH3 the umbrella motion refers to 1163 cm-1, in GaBr3 it is at 99cm-1. GaBr3 has a greater reduced mass than BH3 and so the frequency will be lower. The intensity is about 10 times greater for BH3. In BH3 the umbrella motion is largely made up by movement of the relatively lighter H ligands. On the other hand in GaBr3 the umbrella motion is due to the movement of the central Ga atom as opposed to the Br ligands.
6-31G(d,p) NH3 MO
Population analysis file: [[DOI:10042/31209 | here]]
Association energy
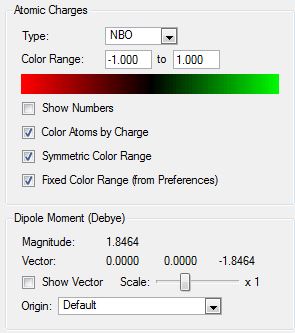
6-31G(d,p)NBO analysis of NH3
| Charge distribution | Colouring atoms by chrage | Specific NBO charges for N and H atoms | |
|---|---|---|---|
|
|
6-31G(d,p) NH33BH3 optimisation
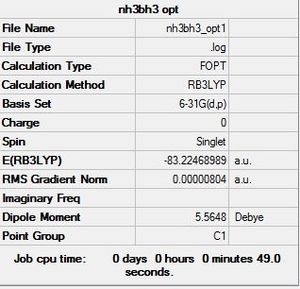
Optimisation log file here
| summary data | convergence | Jmol | |||
|---|---|---|---|---|---|
|
         Item               Value     Threshold  Converged?
 Maximum Force            0.000013     0.000015     YES
 RMS     Force            0.000005     0.000010     YES
 Maximum Displacement     0.000056     0.000060     YES
 RMS     Displacement     0.000023     0.000040     YES
 Predicted change in Energy=-1.048072D-09
 Optimization completed.
|
|
6-31G(d,p) NH3BH3 Freqency analysis Section
Frequency file: here
| summary data | low modes |
|---|---|

|
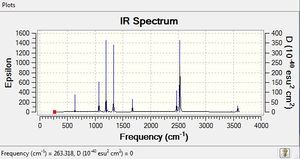
Low frequencies --- -4.8743 -3.3287 -3.3183 0.0008 0.0163 0.1393 Low frequencies --- 263.3176 633.0895 638.4825 |
6-31G(d,p) NH33BH33 Vibrational Spectrum
| wavenumber | Intensity | IR active? | type |
| 263 | 0 | no | bend |
| 633 | 14 | yes | bend |
| 638 | 4 | very slight | bend |
| 638 | 4 | no | bend |
| 1069 | 41 | yes | bend |
| 1069 | 41 | yes | asymmetric stretch |
| 1196 | 109 | yes | bend |
| 1204 | 3 | very slight | B-H bend |
| 1204 | 3 | very slight | B-H bend |
| 1328 | 114 | yes | B-H bend |
| 1676 | 28 | yes | N-H bend |
| 1676 | 28 | yes | N-H bend |
| 2472 | 67 | yes | B-H stretch |
| 2532 | 231 | yes | B-H stretch |
| 2532 | 231 | yes | B-H stretch |
| 3464 | 3 | very slight | N-H symmetric stretch |
| 3681 | 28 | yes | N-H asymmetric stretch |
| 3581 | 28 | yes | N-H asymmetric stretch |
Energy of NH33BH33 relative to fragments NH33 and BH33
· E(NH3)=-56.5677686 a.u.
· E(BH3)=-26.6153236 a.u.
· E(NH3BH3)=-26.6153236 a.u.
· Dissociation energy
· ΔE=E(NH3BH3)-[E(NH3)+E(BH3)]
· ΔE=(-84.33468989)-[(-56.5677686)+(- 26.6153236)]
· 1 a.u = 2625.51 kJ/mol
· ΔE=-0.0515978 a.u
· ΔE=-135.47 kJ/mol
Forming a new N-B bond is favorable as the dissociation energy is negative. The lone pair on nitrogen is able to donate to the electron deficient boron enabling a full octet. An acid base pair is formed; the adduct consists of a strong bond. Ammonia acts as a nucleophile which donates a lone pair to the vacant p orbital on boron. The B-N bond has strong 2p-2p overlap, which is highly efficient.
Project Section: Investigating the conformers, vibrations and MOs of Al2Cl4Br2
Introduction
The idea of monomers being able to dimerise to relieve electron deficiency can be rationalised by MO theory. This project will look at how Al2Cl4Br2, each Al forms 2c-2e bonds to both terminal and bridging groups, the latter using sigma donation from a halogen lone pair into the empty sp3 orbital on Al to form an octet.This project will look at the conformers of Al2Cl4Br2; using these to create optimised structures and subsequently perform frequency and molecular orbital analysis.
Optimisation of conformers of Al2Cl4Br2
For each conformer to be optimised a full basis set 6-31G(d,p) on Al and Cl and a PP LANL2DZdp on Br were used.UsingGEN allowed basis sets to be specified for the Al and Cl atoms while the key words pseudo=read gfinput specified the pseudo-potnetial LANL2DZdp for the Br atoms. This was added to the input file. The symmetry of each conformer was imposed individually before optimisation.
Al2Cl4Br2 Conformer 1: D2h symmetry
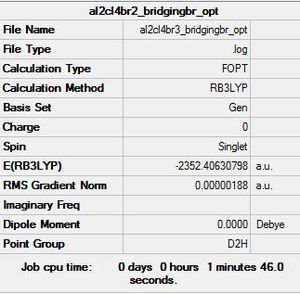
Optimisation log file here
| summary data | convergence | Jmol | |||
|---|---|---|---|---|---|
|
Item Value Threshold Converged? Maximum Force 0.000003 0.000450 YES RMS Force 0.000001 0.000300 YES Maximum Displacement 0.000057 0.001800 YES RMS Displacement 0.000015 0.001200 YES Predicted change in Energy=-2.949438D-10 Optimization completed. |
|
Al2Cl4Br2 Conformer 2: C1 symmetry
Optimisation log file here
| summary data | convergence | Jmol | |||
|---|---|---|---|---|---|

|
Item Value Threshold Converged? Maximum Force 0.000105 0.000450 YES RMS Force 0.000026 0.000300 YES Maximum Displacement 0.001354 0.001800 YES RMS Displacement 0.000595 0.001200 YES Predicted change in Energy=-1.132620D-07 Optimization completed |
|
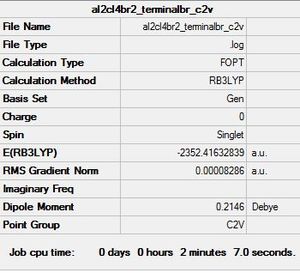
Al2Cl4Br2 Conformer 3(geminal): C2v symmetry
This particular conformer has resulted from an intramolecular exchange occuring within conformer 2 whereby, the bridging Br-Al bond has broken followed by a rotation so that the Br is now terminal and a new Bridging Cl-Al bond has formed.
Optimisation log file here
| summary data | convergence | Jmol | |||
|---|---|---|---|---|---|
|
Item Value Threshold Converged? Maximum Force 0.000126 0.000450 YES RMS Force 0.000045 0.000300 YES Maximum Displacement 0.000162 0.001800 YES RMS Displacement 0.000052 0.001200 YES Predicted change in Energy=-1.541824D-08 Optimization completed. |
|
Al2Cl4Br2 Conformer 4: C2v symmetry
Optimisation log file here
| summary data | convergence | Jmol | |||
|---|---|---|---|---|---|

|
Item Value Threshold Converged? Maximum Force 0.000022 0.000450 YES RMS Force 0.000012 0.000300 YES Maximum Displacement 0.000817 0.001800 YES RMS Displacement 0.000299 0.001200 YES Predicted change in Energy=-2.356235D-08 Optimization completed. |
|
Al2Cl4Br2 Conformer 5: C2h symmetry
Optimisation log file here
| summary data | convergence | Jmol | |||
|---|---|---|---|---|---|

|
Item Value Threshold Converged? Maximum Force 0.000004 0.000450 YES RMS Force 0.000002 0.000300 YES Maximum Displacement 0.000055 0.001800 YES RMS Displacement 0.000024 0.001200 YES Predicted change in Energy=-6.297488D-10 Optimization completed. |
|
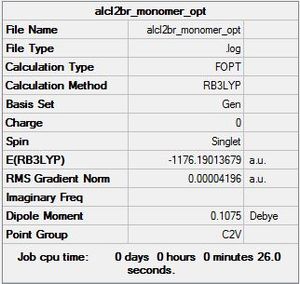
AlCl2Br monomer C2v symmetry
Optimisation log file here
| summary data | convergence | Jmol | |||
|---|---|---|---|---|---|
|
Item Value Threshold Converged? Maximum Force 0.000136 0.000450 YES RMS Force 0.000073 0.000300 YES Maximum Displacement 0.000760 0.001800 YES RMS Displacement 0.000497 0.001200 YES Predicted change in Energy=-7.984419D-08 Optimization completed. |
|
Energy of conformers
· E(isomer 1 D2h)-E(isomer 5 C2h)=9.98018 x 10^(-3) a.u. = + 26.20 kJ/mol
· E(isomer 2 C1)-E(isomer 5 C2h)=5.18885 x 10^(-3) a.u. = + 13.62 kJ/mol
· E(isomer 3 C2v)-E(isomer 5 C2h)=- 4.0238 x 10^(-5) a.u. = -0.11 kJ/mol
· E(isomer 4 C2v)-E(isomer 5 C2h)=2.235 x 10^(-5) a.u . = + 0.06 kJ/mol
For the purposes of this exercise isomer 3 was ignored as is formed from intramolecular exchange of isomer 2 and not directly from the monomers.Isomers 1, 2 and 4 are higher in energy relative to the conformer with C2h symmetry. When the larger Br atoms are in a bridging position they are constrained to a small space, causing the energy for this conformer to increase. When Cl atoms are bridging on the other hand, there is better overlap with the Al centres, the orbitals here are relatively more contracted and are better suited to being in the constrained bridging position. In isomer 2 where one Br atom is bridging, the energy is less than that of isomer 1 where both Br atoms are bridging. In isomer 3 where the Br atoms are arranged in a germinal manner the energy is lower than that of C2h. The lowest energy conformer has C2h symmetry whereby the terminal Br atoms are furthest apart and trans relative to each other. By contrast the highest energy conformer has D2h symmetry and has both Br atoms in the bridging position. The Al-Br bond is generally weaker than Al-Cl bonds as the orbitals are more diffuse; the extent of 3p-4p overlap is far less efficient than 3p-3p. Bridging bonds are generally considered to be weaker than terminal ones and so have longer bond lengths.
Finding the dissociation energy:
Al2Cl4Br2→2AlCl2Br
E(Al2Cl4Br2) Energy of lowest energy conformer (C2h)=-2352.4162882 a.u
E(AlCl2Br) = -1176.1901368 a.u
ΔE=E(AlCl2Br)-[2*E(Al2Cl4Br2)]
ΔE=[ 2*(-1176.1901368)]-E(-2352.4162882)]
ΔE= 0.0360145 a.u
ΔE= + 94.56 kJ/mol
The difference between the products and reactants has resulted in a positive dissociation energy. This indicates that the dimer is the more stable arrangement and lies lower in energy relative to individual monomers. Energy must be put into the system in order to break the bridging Cl-Al bond in the dimer, this is unfavourable.
Frequency and vibrational analysis of conformers
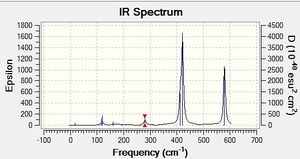
For an IR active vibration there must be an overall change in dipole moment. When the symmetry of the molecule is high the number of IR active stretches decreases. This trend is observed in all the conformers. The tabulated frequencies only includes the IR active stretches with an intensity greater than 1. Isomer 2 has C1 symmetry, since there are no symmetry elements theoretically all 18 modes should be IR active however it can be observed that many have intensities below 1.
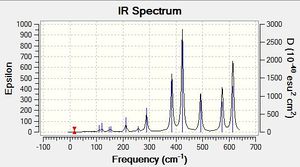
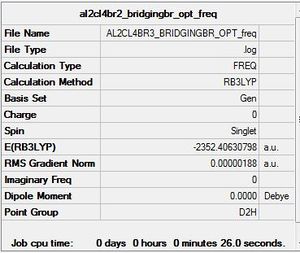
Al2Cl4Br bridging Br D2h Freqency analysis Section
Frequency file: here
| summary data | low modes |
|---|---|
|
Low frequencies --- -5.1748 -5.0352 -3.1462 0.0029 0.0030 0.0036 Low frequencies --- 14.8261 63.2702 86.0770 |
| Mode | Wavenumber | Intensity | Type |
| 5 | 108 | 5 | Al-Cl bend |
| 7 | 126 | 8 | Al-Cl bend |
| 9 | 138 | 7 | Al-Cl bend |
| 12 | 241 | 100 | Al-Cl bend |
| 14 | 341 | 161 | Al-Br stretch |
| 15 | 467 | 347 | Al-Cl bend |
| 18 | 616 | 332 | Al-Cl stretch |
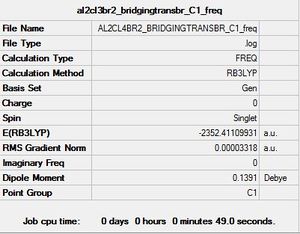
Al2Cl4Br Bridging/terminal Br C1 Vibrational Spectrum
Frequency file: here
| summary data | low modes |
|---|---|
|
Low frequencies --- -2.9935 -1.4857 -0.0030 -0.0027 -0.0013 3.0841 Low frequencies --- 17.0167 55.9579 80.0479 |
| Mode | Wavenumber | Intensity | Type |
| 6 | 110 | 5 | Al-Cl bend |
| 7 | 121 | 8 | Al-Cl bend |
| 8 | 149 | 5 | Al-Cl bend |
| 9 | 154 | 6 | Al-Cl bend |
| 11 | 211 | 21 | Al-Br stretch |
| 12 | 257 | 10 | Al-Cl stretch, Al-Br stretch |
| 13 | 289 | 48 | Al-Cl stretch |
| 14 | 384 | 154 | Al-Cl stretch, Al-Br stretch |
| 15 | 424 | 274 | Al-Cl stretch |
| 16 | 493 | 107 | Al-Cl bend |
| 17 | 574 | 122 | Al-Cl stretch |
| 18 | 615 | 197 | Al-Cl stretch |
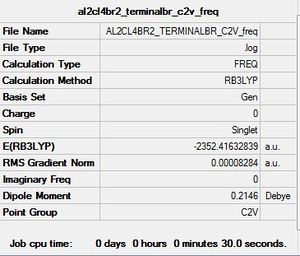
Al2Cl4Br geminal Br C2v Vibrational Spectrum
Frequency file: here
| summary data | low modes |
|---|---|
|
Low frequencies --- -4.1744 -2.6801 -1.2854 0.0036 0.0041 0.0043 Low frequencies --- 17.8156 50.9345 72.1839 |
| Mode | Wavenumber | Intensity | Type |
| 6 | 112 | 8 | Al-Cl bend, Al-Br bend |
| 7 | 120 | 11 | Al-Cl bend |
| 8 | 160 | 1 | Al-Cl bend |
| 9 | 166 | 7 | Al-Cl bend |
| 10 | 187 | 2 | Al-Cl bend, Al-Br stretch |
| 12 | 271 | 13 | Al-Cl stretch, Al-Br stretch |
| 13 | 322 | 41 | Al-Cl stretch |
| 14 | 413 | 150 | Al-Cl stretch |
| 15 | 419 | 310 | Al-Cl stretch |
| 16 | 495 | 134 | Al-Br stretch |
| 17 | 503 | 104 | Al-Cl stretch |
| 18 | 615 | 177 | Al-Cl stretch |
Al2Cl4Br cis Br C2v Vibrational Spectrum
Frequency file: here
| summary data | low modes |
|---|---|

|
Low frequencies --- -4.2128 -2.4692 -0.0034 -0.0032 -0.0031 0.9519 Low frequencies --- 17.0927 50.8319 78.6209 |
| Mode | Wavenumber | Intensity | Type |
| 5 | 104 | 3 | Al-Cl bend |
| 6 | 121 | 13 | Al-Cl bend |
| 7 | 122 | 6 | Al-Cl bend |
| 9 | 158 | 5 | Al-Cl bend |
| 10 | 194 | 2 | Al-Cl bend |
| 12 | 279 | 26 | Al-Cl stretch |
| 13 | 309 | 2 | Al-Cl stretch |
| 14 | 413 | 149 | Al-Cl stretch |
| 15 | 420 | 409 | Al-Cl stretch |
| 16 | 461 | 36 | Al-Cl stretch, Al-Br stretch |
| 17 | 570 | 34 | Al-Cl stretch |
| 18 | 582 | 277 | Al-Cl stretch |
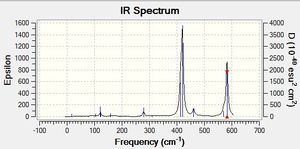
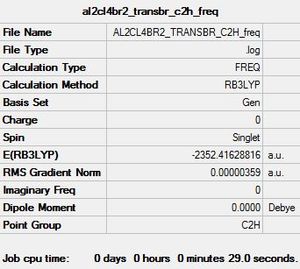
Al2Cl4Br trans Br C2h Vibrational Spectrum
Frequency file: here
| summary data | low modes |
|---|---|
|
Low frequencies --- -4.2810 -2.4948 -0.0016 0.0012 0.0029 0.9598 Low frequencies --- 17.7196 48.9824 72.9515 |
| Mode | Wavenumber | Intensity | Type |
| 6 | 117 | 9 | Al-Cl bend |
| 7 | 120 | 13 | Al-Cl bend |
| 9 | 160 | 6 | Al-Cl bend |
| 12 | 280 | 29 | Al-Cl stretch |
| 14 | 413 | 149 | Al-Cl stretch |
| 15 | 421 | 439 | Al-Cl bend |
| 18 | 579 | 316 | Al-Cl stretch, Al-Br stretch |
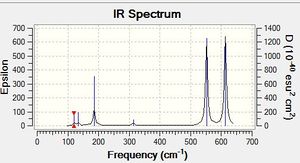
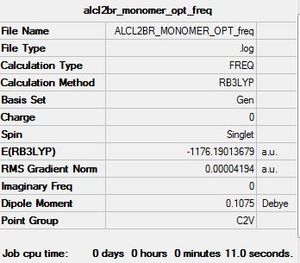
AlCl2Br monomer c2v Vibrational Spectrum
Frequency file: here
| summary data | low modes |
|---|---|
|
Low frequencies --- -0.0026 0.0006 0.0026 1.3569 3.6367 4.2604 Low frequencies --- 120.5042 133.9178 185.8950 |
| wavenumber | Intensity | IR active? | type |
| 121 | 5 | yes | bend |
| 134 | 6 | very slight | bend |
| 186 | 33 | yes | bend |
| 313 | 7 | no | symmetric stretch |
| 552 | 174 | yes | asymmetric stretch |
| 613 | 186 | yes | asymmetric stretch |
Key features of Vibrational Spectra of Al2Cl2Br2
The equation below tells us that higher force constants result in higher vibrational frequencies, while increasing the reduced mass will lower the vibrational frequency. These ideas can be used to rationalise the key frequencies listed in the tables below.
This vibrations shown in the table below involve both bending and stretching within the conformer. The bridging atoms are involved in a bending motion while the terminal ones undergo a stretch. Both the Al centres move together in the same direction in this vibration as shown in the images below. The terminal Cl-Al stretch is observed in isomers 1, 2 and 3 at wavenumber 616 cm-1; in these conformers the Cl atoms are bonded to the same Al centre. By contrast in isomers 4 and 5, each Al centre is bonded to one Cl and one Br and the observed wavenumber is lower. It is possible to conclude that having Br attached to the Al centre is a weaker interaction overall compared to having two Cl atoms. Br is a much larger atom; therefore there is less efficient overlap between the orbitals compared to the relatively smaller Cl atom. This idea is reflected in the force constants, for example in isomer 4 where the Al is bonded to both Cl and Br the force constant is 5.86 and it is much higher with a value of 6.51 in isomer 1. Force constants are used to compare bond strength; we can observe that replacing a terminal Cl with Br atom has resulted in a weaker bond and consequently lower frequency.
The extent of Al-Cl bond stretching is greater than for Al-Br; since Cl atoms are smaller they can approach the Al to a greater degree before repulsive forces take effect. In isomers 2 and 3 the Al centres do not move together, rather there are two different modes for each isomer where each Al moves independently. In isomer 3 one Al centre is bonded to two terminal Br atoms. The frequency for this is much lower at 495 cm-1 compared to when the Al is bonded to one Br and one Cl in the terminal positions. This arrangement can be understood to be much weaker as both Br atoms are in close proximity and may suffer a degree of repulsion. The intensity of the Al-Br stretch when the Br is in a terminal position is larger in isomers 4 and 5 compared to isomers 2 and 3. This could be due to the fact that in isomers 4 and 5 both Al centres are bonded to a terminal Br atom as opposed to only one Al centre bearing a terminal Br in isomers 2 and 3. Terminal Br atoms in a cis position as in isomer 4 show a slightly higher frequency compared to isomer 5 where they are trans. This could be due to a weakly through space bonding interaction (4p-4p overlap) between the cis Br atoms; the force constant for isomer 4 (5.86) is greater suggesting stronger bonding here relative is isomer 5(5.60). For this vibrational mode there is no Al-Br stretching when the Br is in a bridging position.
| isomer | mode | wavenumber | intensity | Al-Br stretch? | Force constant | Image |
| 1 | 18 | 616 | 332 | no | 6.51 | 
|
| 2 | 17, 18 | 574, 615 | 122, 197 | yes, no | 5.72, 6.48 | 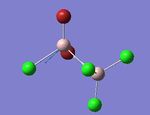 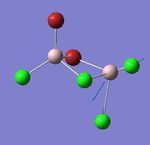
|
| 3 | 16, 18 | 495, 615 | 134, 177 | yes, no | 4.36, 6.49 |  
|
| 4 | 18 | 582 | 277 | yes | 5.86 | 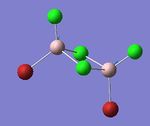
|
| 5 | 18 | 579 | 316 | yes | 5.60 | 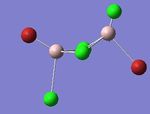
|
To observe the effect of having an Al-Br stretch where the Br is in a bridging position, the vibrational mode below was chosen. In this vibration the Al atoms move up together while the bridging atoms move downwards in the opposite direction. The bridging atoms undergo a stretching motion. This is illustrated in the images below. Isomers 3, 4 and 5 have a frequency at 413 cm -1 corresponding to the bridging Cl-Al stretch. These have intensities and force constants which agree to a great extent, indicating the position of the Br has little or negligible effect. Having just one bridging Br atom is a stronger interaction as opposed to when both Br atoms are bridging. This can be understood considering Br is a larger, heavier atom relative to Cl and has been constrained in a bridging position while simultaneously bonding to two Al centres. The bridging Br-Al interaction is weak with a low force constant. Going from isomer 2 to isomer 1 a lower frequency is observed, here both bridging atoms are Br with overlap of weak diffuse orbitals. We can conclude increasing the number of Br atoms in the bridging positions has led to weaker interactions with lower force constants and frequencies.
| isomer | mode | wavenumber | intensity | Al-Br stretch? | Force constant | Image |
| 1 | 14 | 341 | 161 | yes | 2.07 | 
|
| 2 | 14 | 384 | 154 | yes | 2.61 | 
|
| 3 | 14 | 413 | 150 | no | 2.95 | 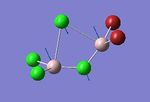
|
| 4 | 14 | 413 | 149 | no | 2.95 | 
|
| 5 | 18 | 413 | 149 | no | 2.95 | 
|
Overall Al-Br stretches are generally weaker than Al-Cl stretches. Al-Br stretches are considerably weaker in the bridging position and when both bridging atoms are Br; this was the lowest observed frequency at 341 cm-1. Terminal Br-Al stretches were lowest when the Al centre was bonded to two terminal Br atoms. High wavenumbers indicate more energy is required to cause bond vibration according to the equation: E=hν. Weaker bonds require a smaller amount of energy to cause vibrations.
Visualising MOs of lowest energy conformer
Population analysis file: [[DOI:10042/31367 | here]]
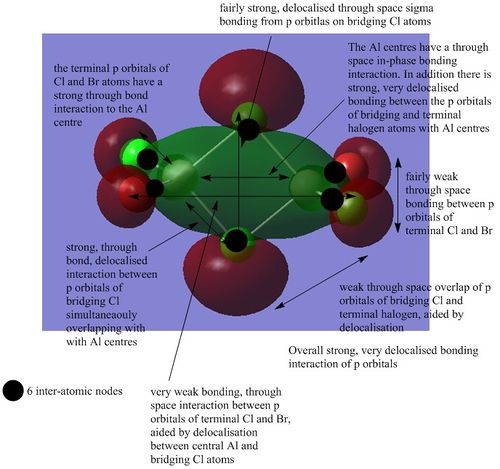
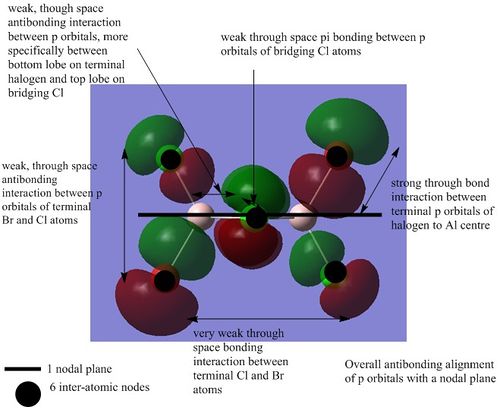
There are 54 occupies energy levels. The non-core orbitals exist from MO 31 and upwards. The non core orbitals tend to be more delocalised as illustrated below.
MO 38:
MO 40:
MO 46
MO 47
MO 51
Conclusion
This project involves creating optimized structures for the conformers of Al2Cl4Br2 and studying the energies of this with respect to the monomers AlCl2Br. Association of these monomers was found to be a favorable process in order to relieve electron deficiency and allow Al to achieve an octet through formation of 2c-2e bonds. Frequency analysis was carried out and IR spectra were computed for all monomers. Key Al-Br stretching bands were identified and tabulated to show the effects of bridging and terminal Br atoms. Bridging Br atoms were found to have lower frequencies relative to terminal ones. One limitation of this is that there is a 10 % systematic error associated with the frequency analysis due to use of the harmonic approximation; this could in fact be a small error of around 10 cm-1 that may not significantly deviate from the computed values. Non-core molecular orbitals of the lowest energy conformer with C2h symmetry were visualized and the various intramolecular interactions were identified.
Further study
Possible extensions to this project could include studying the effect of replacing Al with elements in the same group. Boron is known to be highly Lewis acidic and investigating this property could confirm this trend. Alternately the effects of changing the ligands could be investigated. This could involve changing the number and type of group 7 halogen, replacing the halogens with methyls or hydrogens etc. This introduces the possibility of analyzing 3c-2e bonds as well as 2c-2e bonds. Investigating the MO diagrams for these compounds would be interesting and a better idea of how orbitals are involved in bonding would be understood. NBO analysis would be especially useful here to quantify the relative contributions each atomic orbital makes towards the overall bonding in the molecule.

